
Statista Alternatives: Where to Find the Statistic You Need
Compare five alternatives for published statistics, industry context and audience data. Start with the measure, source and usage rights your decision needs.
The best Statista alternative is the source that covers your exact measure and permits your intended use. Start with World Bank, OECD or Eurostat for relevant official indicators; IBISWorld for industry research; and GWI for survey-based audience profiles. These products answer different questions. A custom study or simulated audience can investigate a new decision, but cannot supply a missing observed historical statistic.
If the decision extends beyond finding a statistic, compare the broader syndicated research routes before buying a report, dataset or new study.
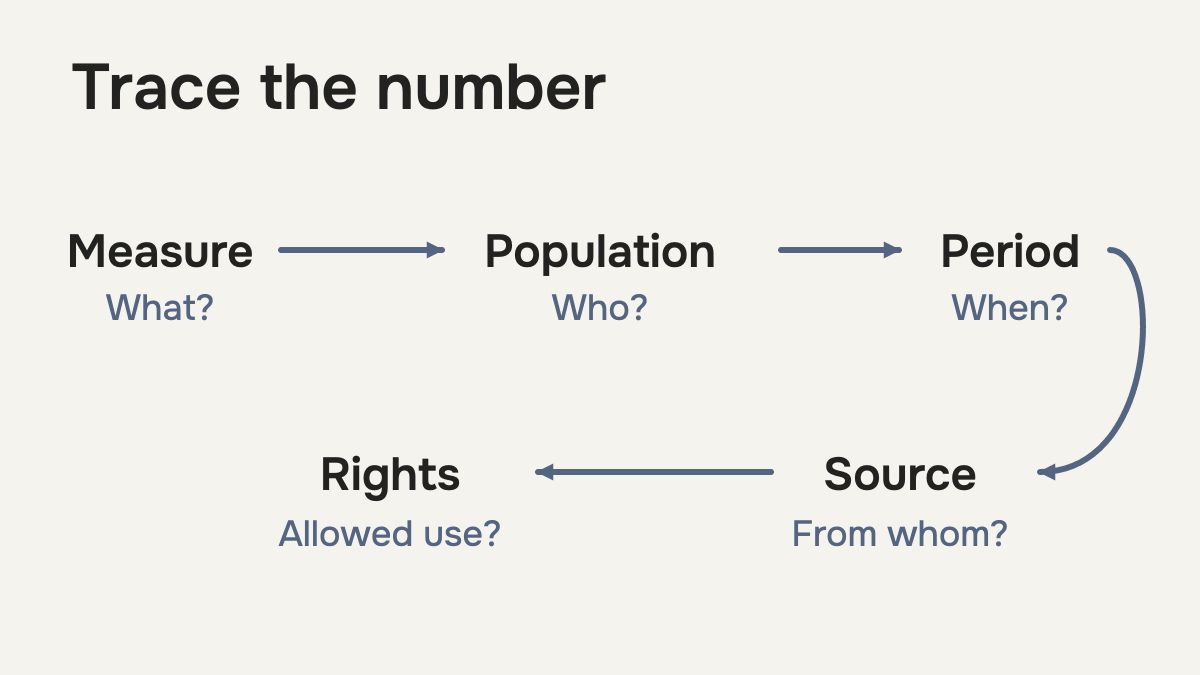
Before comparing subscriptions, write the number you need in a complete sentence: what is measured, for which population and place, during which period, and in which units? That often reveals whether you need another data platform, the original source behind a chart or a different research design.
Five alternatives by research job
Source | Best fit, access model and boundary |
|---|---|
Published development, economic and social indicators across economies, with downloadable data and metadata. Public access and stated reuse terms. Check the indicator's definition and source; it may not cover a narrow consumer product category. | |
Published economic, social and policy statistics for the covered countries and datasets. Downloads and an SDMX API support analysis. Inspect coverage, definitions and update periods; different series are not automatically comparable. | |
European official statistics at relevant national or regional levels, with browser, download and API routes. Useful for the EU or euro area where the dataset fits. Some microdata require special access; public aggregate access does not establish access to individual records. | |
Analyst-produced industry reports and data in defined geographic and industry collections. Individual reports and tailored memberships are sold. Useful for industry structure and commercial context; inspect the report's category definition, estimates and forecast methods. | |
Recurring survey-based profiles of online consumers, covering the attitudes and behaviors included in the product. Subscription access is scoped to the plan and markets. Useful for audience and media questions; survey responses are different evidence from official population statistics or observed transactions. |
This is a shortlist by task, not an overall ranking. Check a sample table or dataset against the brief before comparing advertised breadth.
World Bank: begin with the indicator metadata
World Development Indicators offers development indicators from recognized sources, organized by economy and measure. It can be useful for a market-entry team that needs comparable macroeconomic or social context rather than a proprietary consumer-category estimate.
Open the definition and source before downloading. Check units, calendar coverage, missing values and any breaks in the series. A dataset's latest update date does not mean every economy has a newly collected value for that period.
World Bank data comes with reuse terms, including attribution requirements and relevant exceptions. Confirm the particular dataset's terms for the planned analysis and publication. A public indicator can be valuable context while still leaving the product's actual buyer population unresolved.
OECD: compare the same concept across the covered economies
OECD Data Explorer provides access to the OECD statistical warehouse. Its API supports programmatic access under the relevant terms and limits.
Use it when an available economic, social or policy series matches the decision. Keep the dataset code, selected dimensions and retrieval date with the output so another analyst can reproduce it. Confirm whether the selected countries, population and period support the comparison you want to make.
The work is partly analytical: choosing a series, reading definitions and explaining omissions. A paid collection may still be useful when it supplies other sources, interpretation or a workflow your team needs. Compare the full job rather than treating free API access as a finished report.
Eurostat: a strong starting point for European statistics
Eurostat's products and tools include a Data Browser and download routes for European official statistics. They are relevant when the research needs the published EU, national or regional measures it covers.
Check dimensions such as geography, population, unit and time before comparing values. Keep the access and versioning limitations in mind when a reproducible historical snapshot matters. Public aggregates and restricted microdata are separate products.
Read the reuse conditions and identify the source in your output. The ability to retrieve a table does not show that a differently defined commercial category has been measured.
IBISWorld: buy industry context rather than a generic chart library
IBISWorld's collections organize industry research by the relevant report series and geography. It sells single reports and memberships, with scope and rights to confirm.
This is worth investigating when you need an industry definition, competitive structure and analyst interpretation together. Read a sample report and establish whether its industry boundary matches your market. A report's industry total and an individual brand's reachable audience answer different questions.
Distinguish observed inputs, estimates and forecasts. A historical estimate can be useful without being a direct transaction count. If the decision depends on a specific subgroup or proposed offer, ask what additional research would be needed rather than stretching the industry report beyond its coverage.
GWI: investigate audience profiles and attitudes
GWI's plans and methodology describe recurring consumer-survey data and access options. It is a relevant alternative when your real question concerns the attitudes, media behavior or characteristics of the online consumers represented in the product.
Inspect the exact question, sample population, market and field period behind a result. A profile derived from a recurring survey is not equivalent to a population census or a purchase record. Confirm plan access, exports and the markets your team needs.
If your question concerns an offer that was not included in the survey, a new study may be necessary. Our consumer insights tools guide compares workflows for that wider job.
When keeping Statista is the better choice
Statista identifies sources and collection information for its statistics. A searchable collection spanning sources can be useful when your team needs to locate existing measures, inspect their provenance and prepare charts within the purchased rights.
Keeping it can make sense if the needed sources, coverage and workflow are already available under your plan. Replacing it with several individual sources can add work: finding data, reconciling definitions, maintaining extracts and explaining why series differ.
Ask what is included in the actual account: source access, downloads, chart use, users and permissions. Compare the work your team will complete with each option, rather than assuming a broad collection or an original source is always the better purchase.
A five-field check before a statistic reaches a presentation
Check | What to retain with the number |
|---|---|
Measure | Exact definition and units, including whether the value is observed, estimated, forecast or survey-based. |
Population | People, households, firms or transactions covered, with relevant exclusions and geography. |
Period | Collection or reference period, publication date, release and retrieval date. |
Source | Original provider and dataset or report, with a reproducible table, series or question identifier where available. |
Use | The rights and attribution conditions that apply to the intended analysis, sharing or publication. |
If two sources disagree, compare these fields first. They may measure different populations or periods rather than contradict one another. Keep an unresolved difference visible instead of selecting whichever number best supports the slide.
When you need a study rather than another statistics source
A published statistic can establish context. It does not tell you how buyers will understand two proposed messages unless the source actually studied them. New human research can collect relevant experiences or responses; simulated research can investigate a supported modeled audience under a defined task.
At Sapien, we develop simulated audiences and run surveys, interviews and comparisons, using supporting data and relevant customer research. The output should connect the responses to a useful recommendation. It remains modeled research, rather than a source of observed market history. Our synthetic research validation guide explains the evidence to inspect for the audience and task.
Use our syndicated-research alternatives guide to choose the wider route. For a modeled study, discuss the decision with Sapien, including the evidence you already have and what the next result needs to change.