
How Accurate Are Synthetic Users? 14 Tests Against Human Research
Fourteen tests put Sapien beside human research. See where the numbers match, where they miss, and which differences could change a decision.

A single score can hide a price gap large enough to change an offer. In one test, Sapien estimated willingness to pay for farm-raised beef at $6.80 per pound; a human choice study put it at $13.47. In another, both groups liked Budweiser best, but Sapien moved Uber Eats from second place to fifth.
Those misses have different consequences. A ranking can change which ad gets more work. A price gap can change the offer itself. To judge a synthetic result, you need the human comparison in the units of the decision, not just a percentage labeled accuracy.
We put Sapien through 14 tests drawn from published human research: ads, menu messages, products, electric vehicles, financial services, and interviews. Sapien builds synthetic populations grounded in real-world demographic, purchase, behavioral, and research data. We used the published studies as reference points for the synthetic tasks, then compared the group results.
Some answers came close. Others missed a ranking, a segment difference, or the size of an effect. The savings-offer test, for example, got the direction right but substantially understated how much an easier response process increased action.
The cases put the original human findings beside Sapien's estimates. The question throughout is whether a difference would change what a team does next.
How to read the scores
The charts compare group outcomes: average ratings, response shares, rankings, or modeled choices. They do not test whether a synthetic respondent predicts the answer of a particular person.
The source report uses a normalized accuracy score: average error divided by the full response scale, expressed as a percentage of closeness. A four-point miss on a 0–100% outcome becomes a 96% score. That makes cases easy to summarize, but it can hide an error that matters to a business.
A forecast of 6% against a human result of 12% is six percentage points away and predicts half as many responses. That is why each case leads with paired values. Prices stay in dollars; the interview case counts findings that reviewers judged to match.
Some human sources record stated intentions; others report experimental choices or actions people took. We label the outcome in each case. These replications do not establish accuracy in every new market. Sapien's estimates and reported scores come from our case-study report; the human results come from the linked research.
Every quotation comes from a synthetic respondent. Most explanations were collected after the answer. They suggest what to ask next, not why an entire population responded as it did.
Ads and messages
1 Which ads connect
A creative team choosing which ad to develop needs more than an average liking score. It needs to know whether the same work rises to the top with people.
We tested eight ads from the 2025 USA TODAY Ad Meter exercise on its 1–5 liking scale. Budweiser led both sets: Sapien rated it 3.69 and human panelists gave it 3.56. Across seven ads whose titles can be matched unambiguously, the larger miss was Uber Eats. Human panelists rated it 3.38, second among those seven; Sapien gave it 2.92, fifth. USA TODAY’s full ranking and winner announcement provide the human scores.
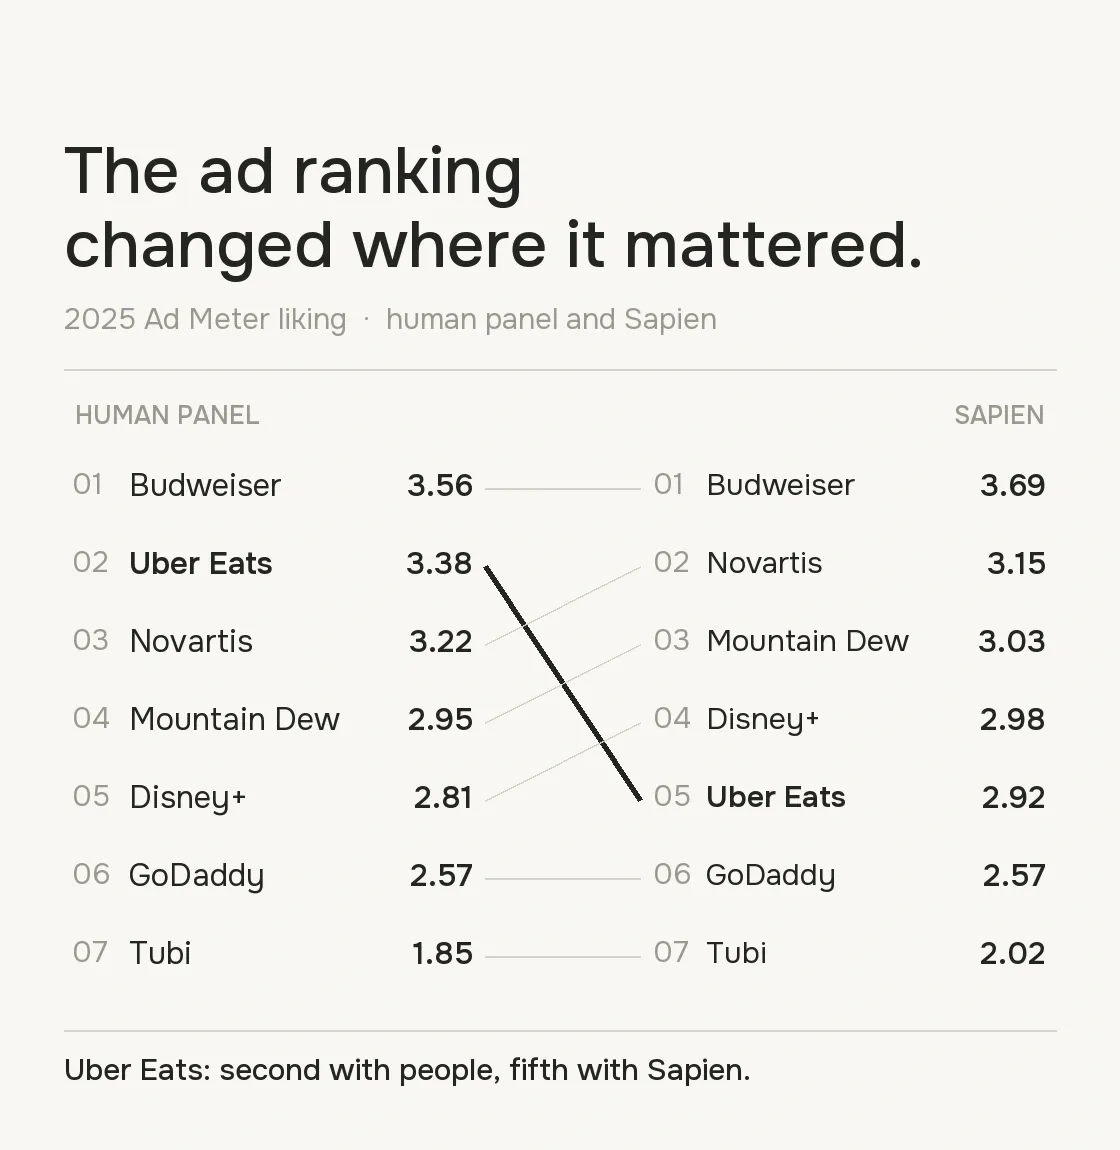
The report gives ad liking a 96.5% score across all eight ads. That average would not tell a creative team that Uber Eats fell three places in the matched ranking.
A synthetic father connected the young Clydesdale's persistence with wanting his child to grow into difficult things. Another viewer resisted the same story:
“I could see the emotional strings being pulled the whole time.”
Both understood the intended feeling. One connected it to his child; the other saw the effort to move him. An editor could test a subtler cue or a more credible moment. The liking scores show which spot deserves that closer look, not whether it will sell more beer.
2 Messages that change a choice
The message that moved the most diners in the human study was not the one Sapien favored.
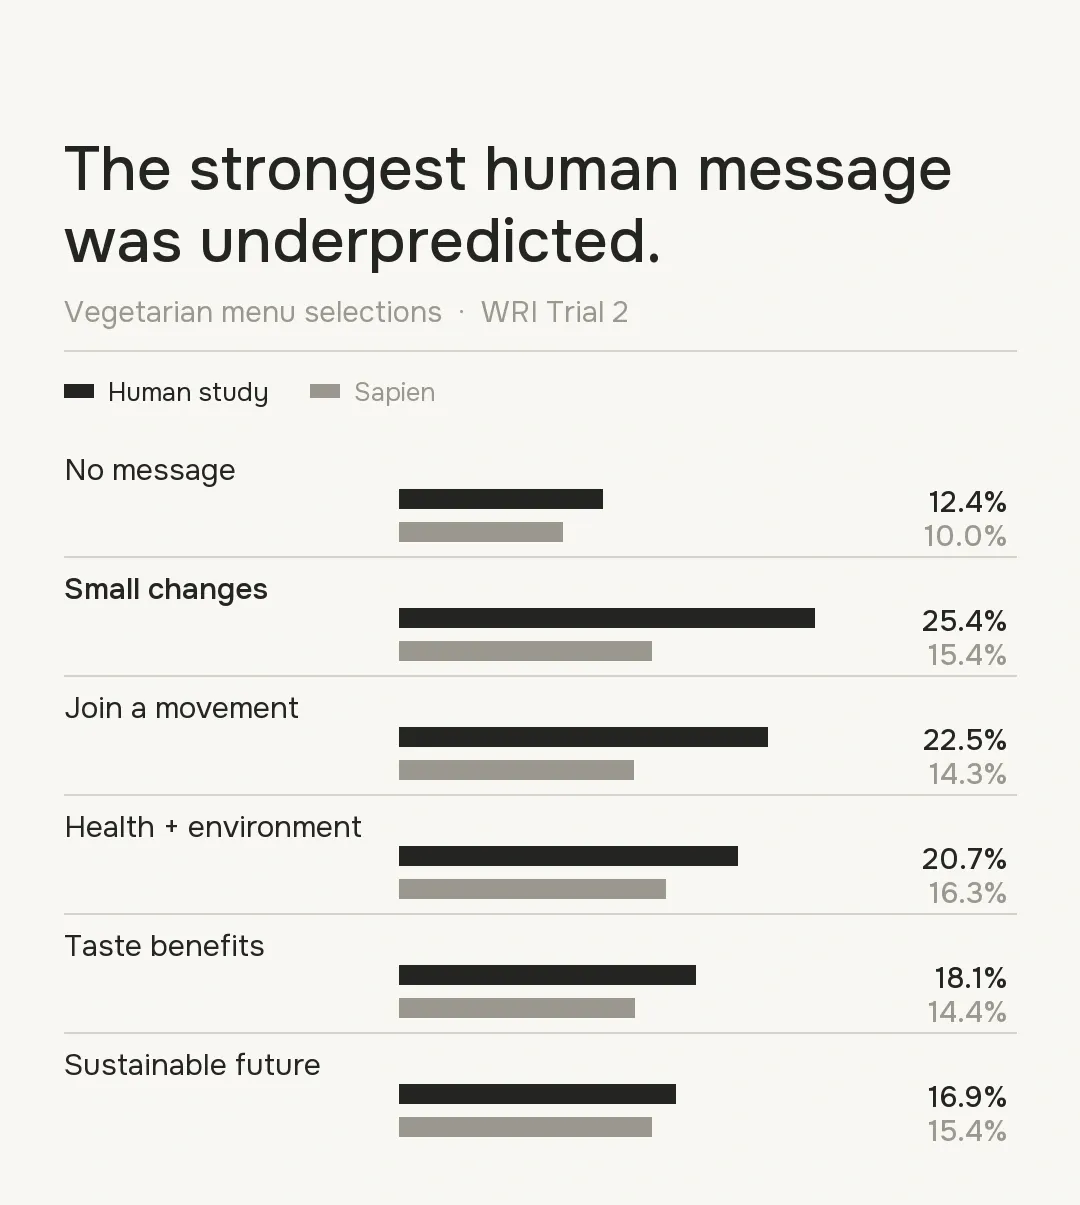
We recreated Trial 2 of the World Resources Institute's menu study. Synthetic respondents chose lunch and dinner with one of five messages or no message. The results combine both meal choices.
The human trial’s strongest message, “small changes, big impact,” raised vegetarian selections from 12.4% without a message to 25.4%. Sapien also predicted an increase, from 10.0% to 15.4%, but substantially understated it. Sapien instead put “health and environment” highest at 16.3%; the human result for that message was 20.7%.
One respondent said a message about other people's choices made ordering vegetarian feel easier in a family where meat was the default. Another dismissed the statistic as marketing. A sharper copy test would ask whether the line makes the choice fit the meal, or sounds like a brand asking diners to sacrifice it.
3 Believing a label and buying a product
An eco-score changed how sustainable a product seemed. It moved purchase intention less.
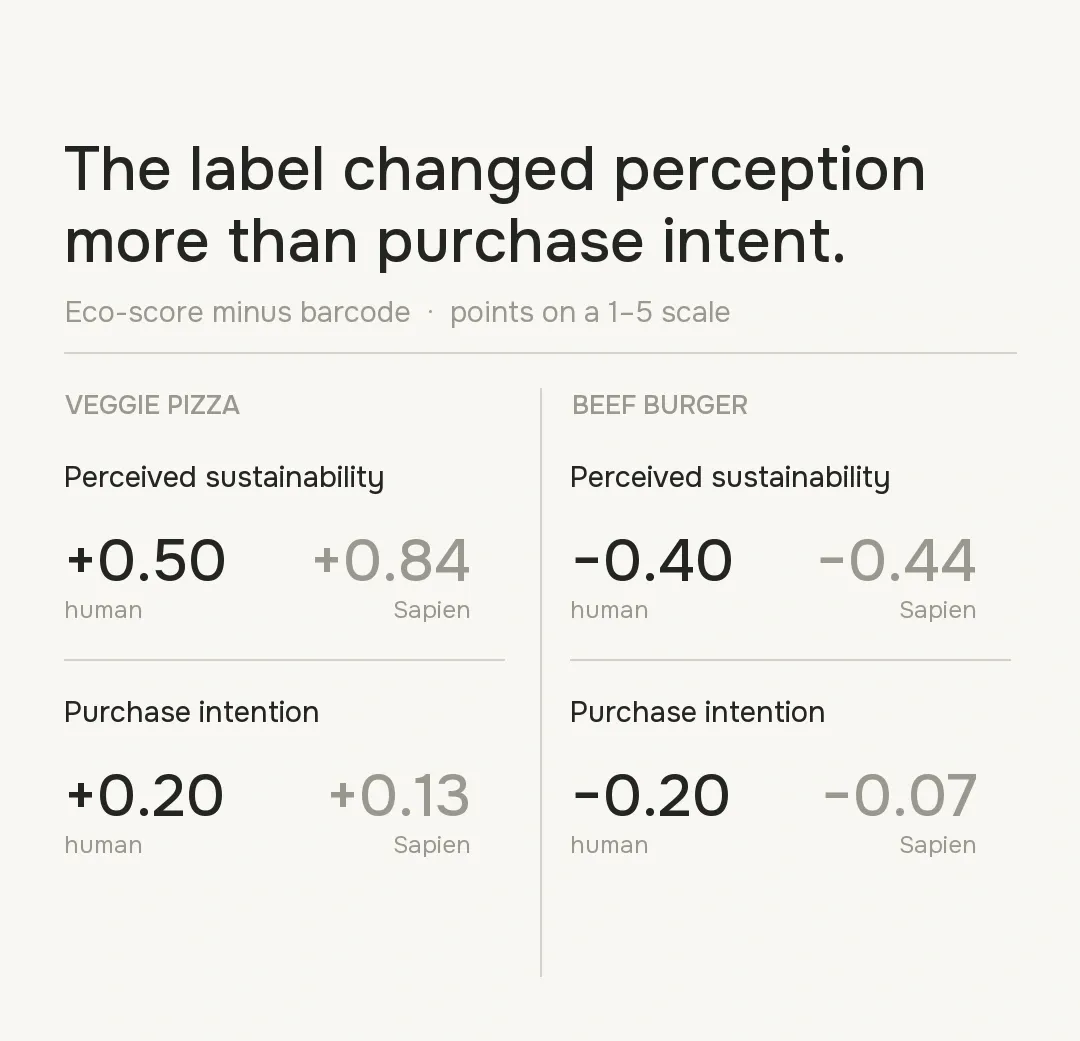
In the Taillie and colleagues experiment, US parents saw products with an eco-score or a barcode. Our recreation asked how sustainable each product seemed and how likely they were to buy it, each on a 1–5 scale.
Both studies found that the eco-score changed perceived sustainability more than purchase intention. But the size of each change matters. For veggie pizza, the human sustainability rating rose 0.50 points with the label; Sapien estimated 0.84. Human purchase intention rose 0.20 points, versus Sapien’s 0.13. For beef burgers, the human purchase-intention change was −0.20, while Sapien estimated −0.07. These are differences on 1–5 rating scales, not observed purchases.
A synthetic parent described feeding four people, including a six-year-old who would eat a burger without a fight. Environmental information had to compete with a meal the family would accept.
For packaging teams, a clearer environmental signal and a stronger reason to buy are different outcomes. The study measured ratings and stated intention, not purchases.
Products and purchase decisions
4 Trying a food and buying it regularly
Trying an unfamiliar food once is easier than putting it on the weekly shopping list.
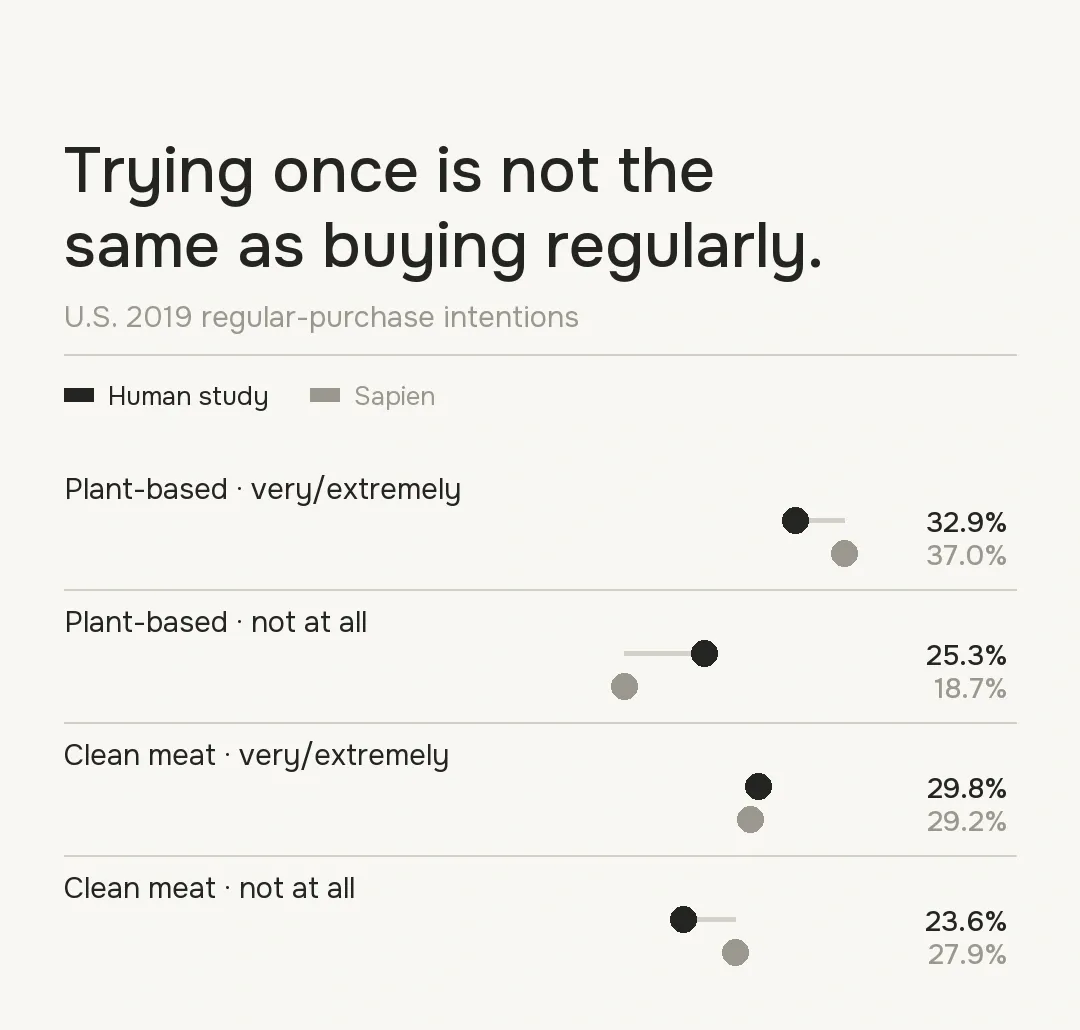
We used the US sample context from Bryant and colleagues' 2019 study. It compared plant-based meat with “clean meat,” the study's term for cultivated meat, and asked about regular purchase.
For regular purchase of plant-based meat, 32.9% of the original U.S. respondents were very or extremely likely, compared with 37.0% in Sapien. For clean meat, the figures were 29.8% human and 29.2% Sapien. The greater difference was among people saying they were not at all likely to buy plant-based meat: 25.3% human versus 18.7% Sapien.
Regular-purchase answer | Human U.S. study | Sapien |
|---|---|---|
Plant-based meat: very or extremely likely | 32.9% | 37.0% |
Plant-based meat: not at all likely | 25.3% | 18.7% |
Clean meat: very or extremely likely | 29.8% | 29.2% |
Clean meat: not at all likely | 23.6% | 27.9% |
The study uses “clean meat” for cultivated meat. These are stated regular-purchase intentions under its 2019 descriptions.
A skeptical respondent was willing to taste the product but uncomfortable eating it routinely. An enthusiast welcomed the chance to keep a familiar food while avoiding some effects of conventional animal agriculture.
The skeptical respondent's willingness to taste the product is a weak proxy for repeat purchase. The regular-use question is more useful, though it still measures stated intent under the study's 2019 descriptions, not today's sales.
5 What EV buyers prioritize
In the 2019 Dutch proEME survey, Sapien nearly matched the human share selecting purchase price: 54.0% versus 53.6%. The rest of the list was less close. Human respondents selected range at 32.4%, versus Sapien’s 40.5%, and 16.7% selected that they would not buy an EV, versus just 1.6% in Sapien. Respondents could select several answers, so shares do not add to 100%.
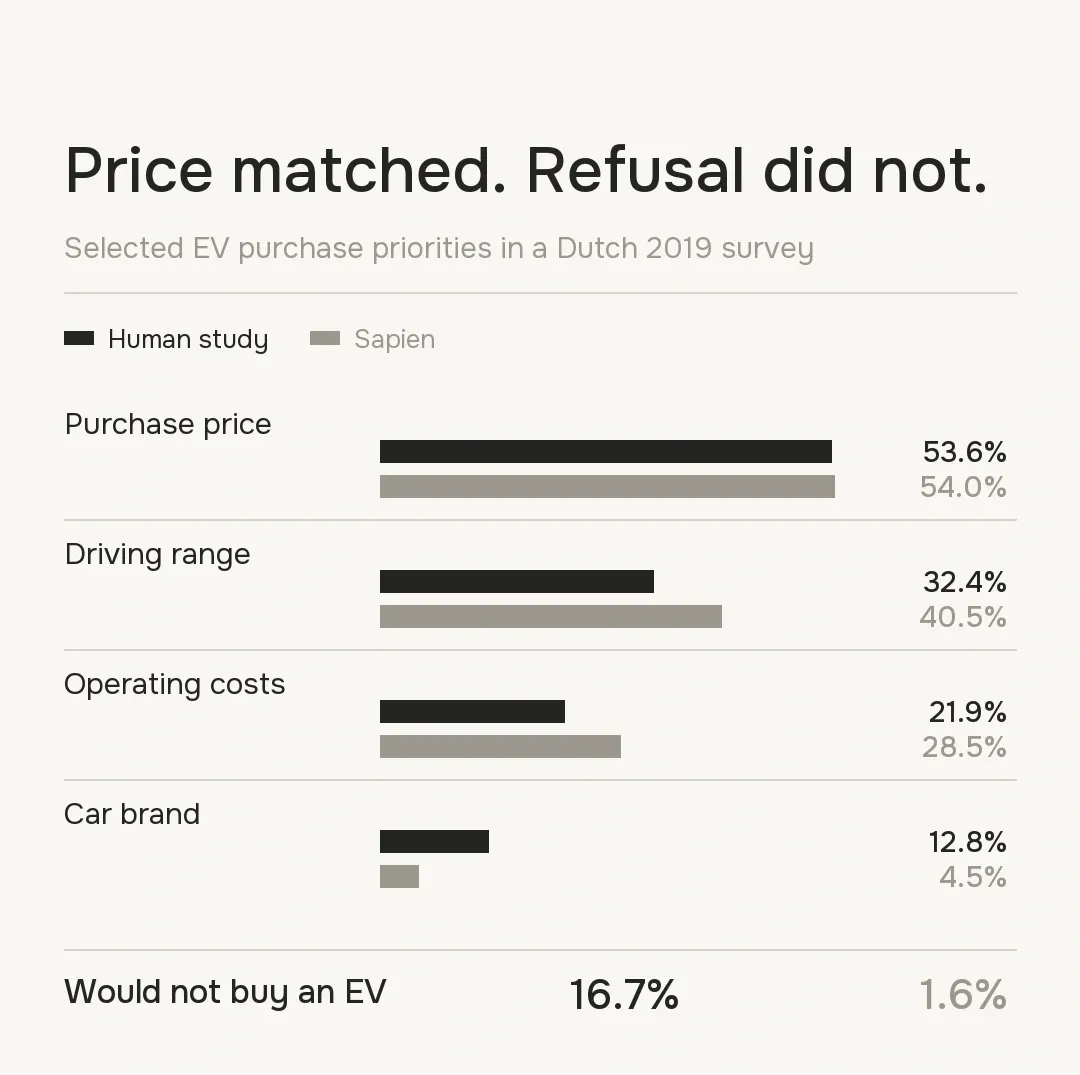
Sapien put brand at 4.5%, while the human share was 12.8%. One synthetic respondent explained that he could not confidently judge battery and software specifications, so a familiar badge reassured him about a car his household would depend on.
Brand was not the leading purchase priority. The account points instead to a question for the less confident buyer: would a clearer warranty, service offer, or account of ownership costs provide the same reassurance?
6 When the buyer chooses nothing
A pricing study needs room for the customer to walk away.
Our recreation of the Van Loo, Caputo, and Lusk burger experiment used choices with prices but no brand names. Customers could select farm-raised beef, one of three alternatives, or no purchase.
The original study’s unbranded control estimated willingness to pay at $13.47 per pound for farm-raised beef and $0.05 for lab-grown beef. Sapien estimated $6.80 and $3.98, respectively. It was much closer on pea-protein meat, at $4.33 against $4.25 human. These are choice-model estimates relative to buying nothing, not checkout prices.
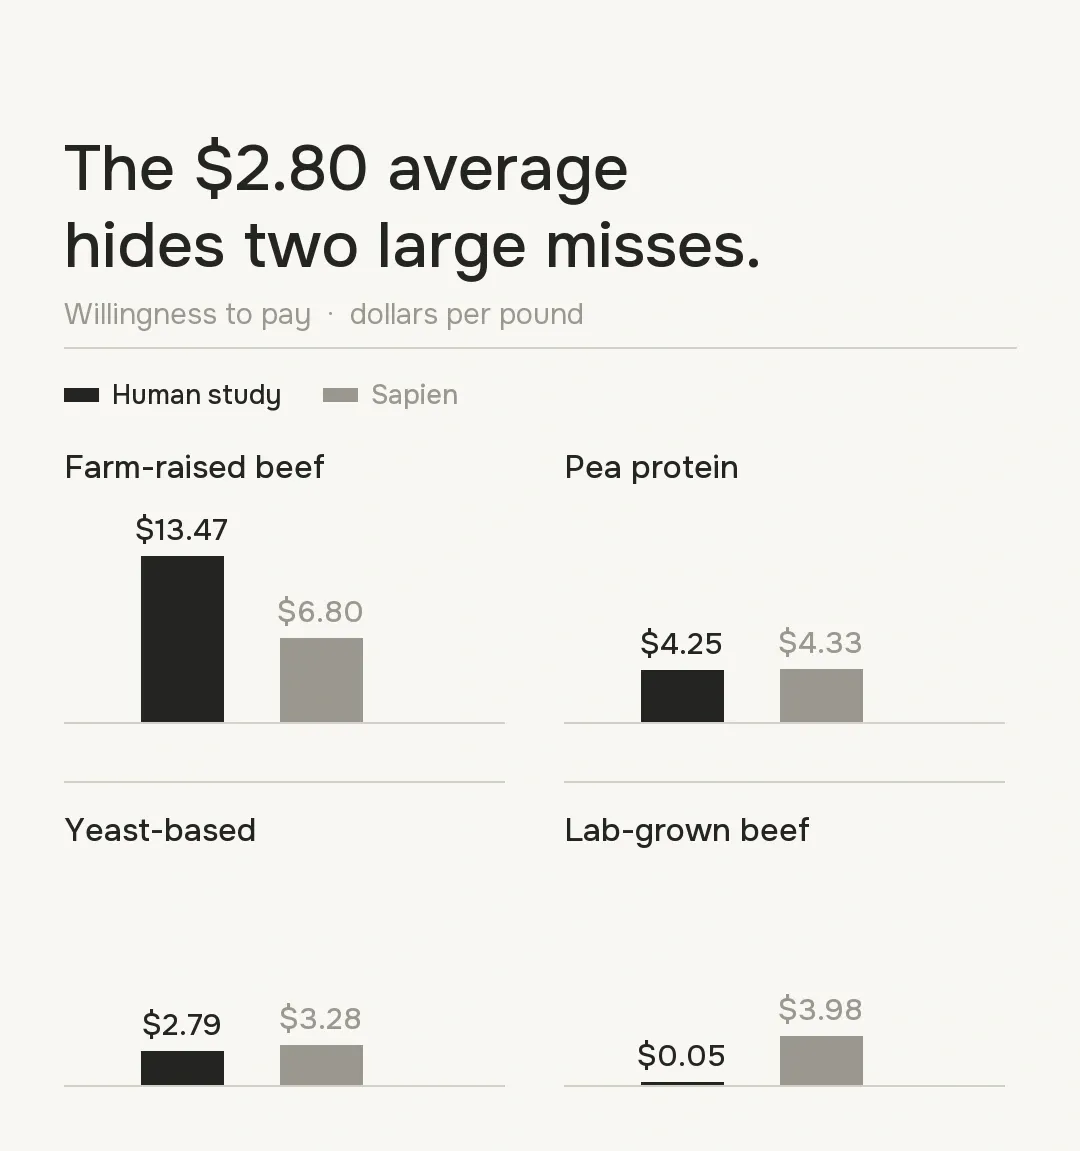
The report's average error was $2.80 per pound. That average hides the large errors for conventional and lab-grown beef, even though the pea-protein estimate was close.
One synthetic respondent who declined to buy weighed the food against heating, prescriptions, and unexpected repairs. Another liked lab-grown beef on the condition that taste and price were right.
The pea-protein estimate would point a pricing team in roughly the right direction. The beef estimates could set a very different price range. All four figures are inferred from choices against a no-purchase option, not prices people named or paid.
7 Fitting an EV into daily life
One synthetic buyer was offered an EV at the same price as a gasoline car, with 400 miles of range and fast charging along the highway. He pictured getting home late, leaving the car at a public charger, and walking 20 minutes back in the dark.
Using Zou, Khaloei, and MacKenzie's scenarios, we varied the walk to slow charging and access to fast charging within a 15-minute drive. Both the new- and used-car scenarios specified a 40-year-old man who did not own an EV.
At a 20-minute walk to slow charging, the human study’s published choice model implies about 34.7% EV choice for used-car buyers without fast charging in town. Sapien estimated 53.1%. For new-car buyers with fast charging, the comparison is much closer: approximately 73.3% human versus 69.1% Sapien.
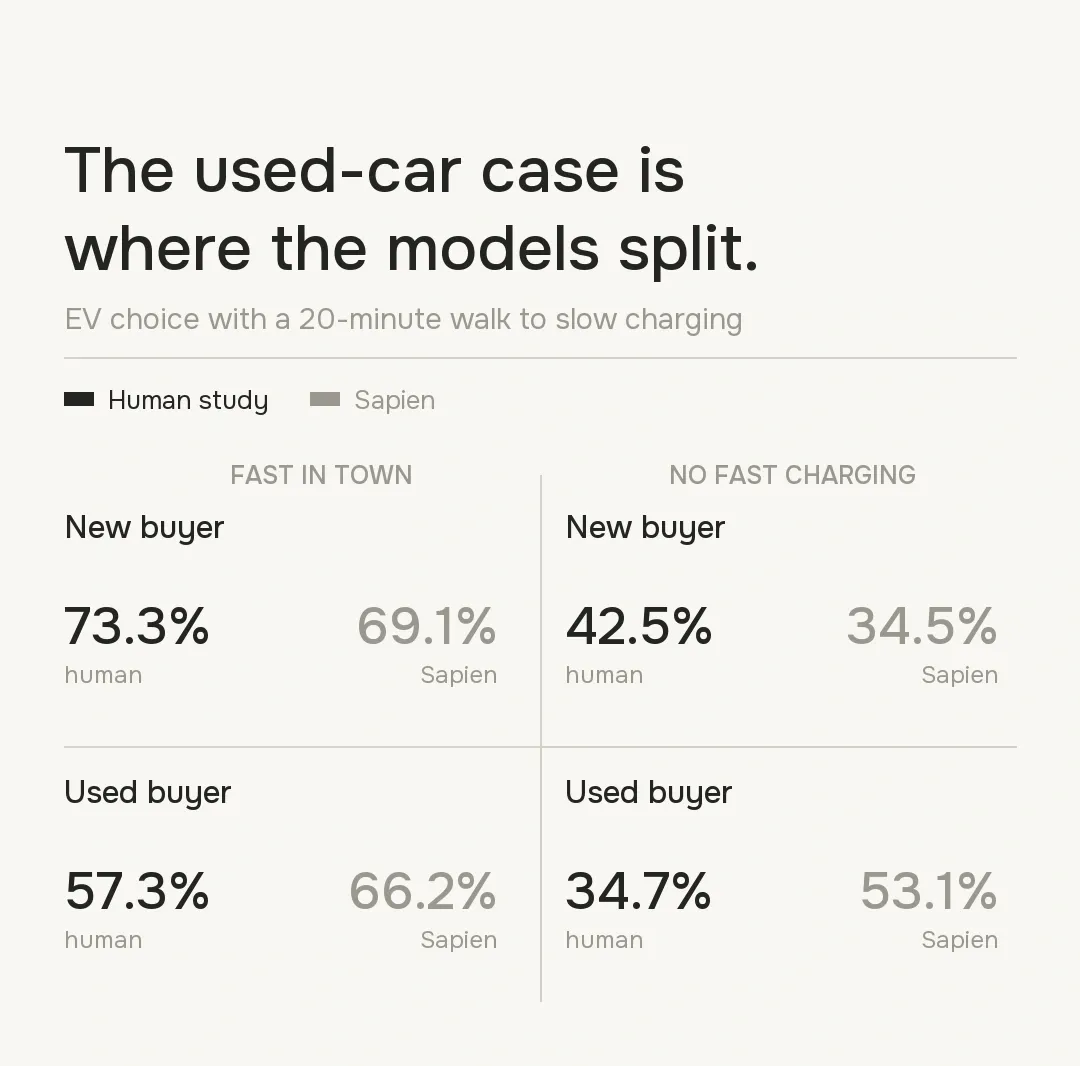
Sapien put used-car buyers above new-car buyers when fast charging was absent. At a 20-minute walk, the original human-study model put used buyers below new buyers, about 34.7% versus 42.5%. The reported 96.4% score averaged 36 scenarios; it did not make this particular difference small.
The buyers described different barriers. One worried about the walk home; another feared an aging battery and an expensive repair. A shorter walk would not answer the second concern. Those interviews suggest what to probe, while the paired choice estimates show why one charging message may not fit both groups.
Customers and audiences
8 How rising prices change the basket
When food prices rise, trading down can mean choosing a cheaper brand or giving up a premium product. We compared four reported behaviors in the 2024 IFIC Food and Health Survey. The audience was people who noticed higher prices; each share combines “always” and “often.”
The IFIC human survey found 48% always or often chose cheaper products or brands and 48% chose less-premium products. Sapien estimated 49.9% and 40.2%. It captured the cheaper-brand move but understated the move away from premium products.
Always or often after food prices rose | Human survey | Sapien |
|---|---|---|
Cut back on nonessential food or drinks | 47% | 51.0% |
Chose cheaper products or brands | 48% | 49.9% |
Chose less-premium products | 48% | 40.2% |
Made less-healthy choices | 26% | 28.0% |
Asked of people who noticed food and beverage price increases; human survey n=2,728. The shares combine “always” and “often.”
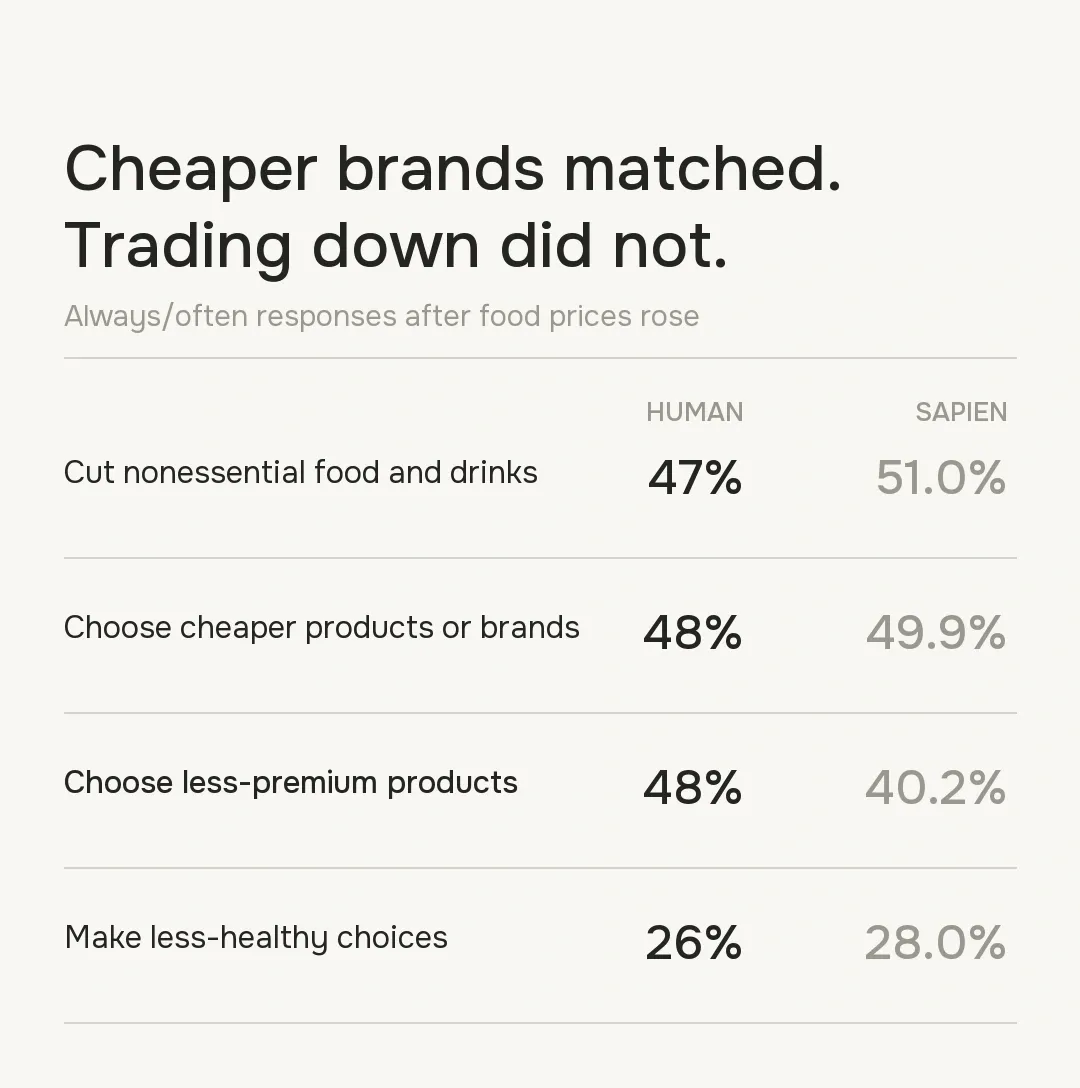
A synthetic respondent described leaving fresh berries, salad kits, lean meat, and fish behind as cheaper meals filled the basket. For someone living alone, the calculation also included fresh food that might spoil.
The interview points to pack size and shelf life as questions worth testing. A lower unit price may lose its appeal if food spoils before a small household can use it. The survey comparison records what people said they did, not what appeared in their baskets.
9 Differences between EV audiences
People who had driven an EV named different benefits from people who had never driven one, especially on lower running costs. We compared the two groups across six benefits.
The human gap on running costs is where Sapien lost the audience distinction: 34.4% of EV-experienced respondents selected it, against 23.2% of never-drivers. Sapien estimated 35.6% versus 37.2%, reversing the gap. On price, the groups were nearly alike in the human survey at 45.5% and 46.3%, while Sapien put them at 71.5% and 72.3%. It captured a small group difference but overstated the level for both.
Benefit | Human experienced minus never driven | Sapien difference |
|---|---|---|
Longer range | +9.6 pp | +4.2 pp |
Faster charging | +4.4 pp | +1.0 pp |
More charging stations | +7.3 pp | +2.5 pp |
Lower running costs | +11.2 pp | −1.6 pp |
Price | −0.8 pp | −0.8 pp |
Positive global-climate effect | −1.7 pp | +1.4 pp |
Human figures are weighted responses from the published 2019 Dutch survey data: 212 EV-experienced and 1,323 never-driven participants, excluding 18 unsure responses. pp means percentage points.
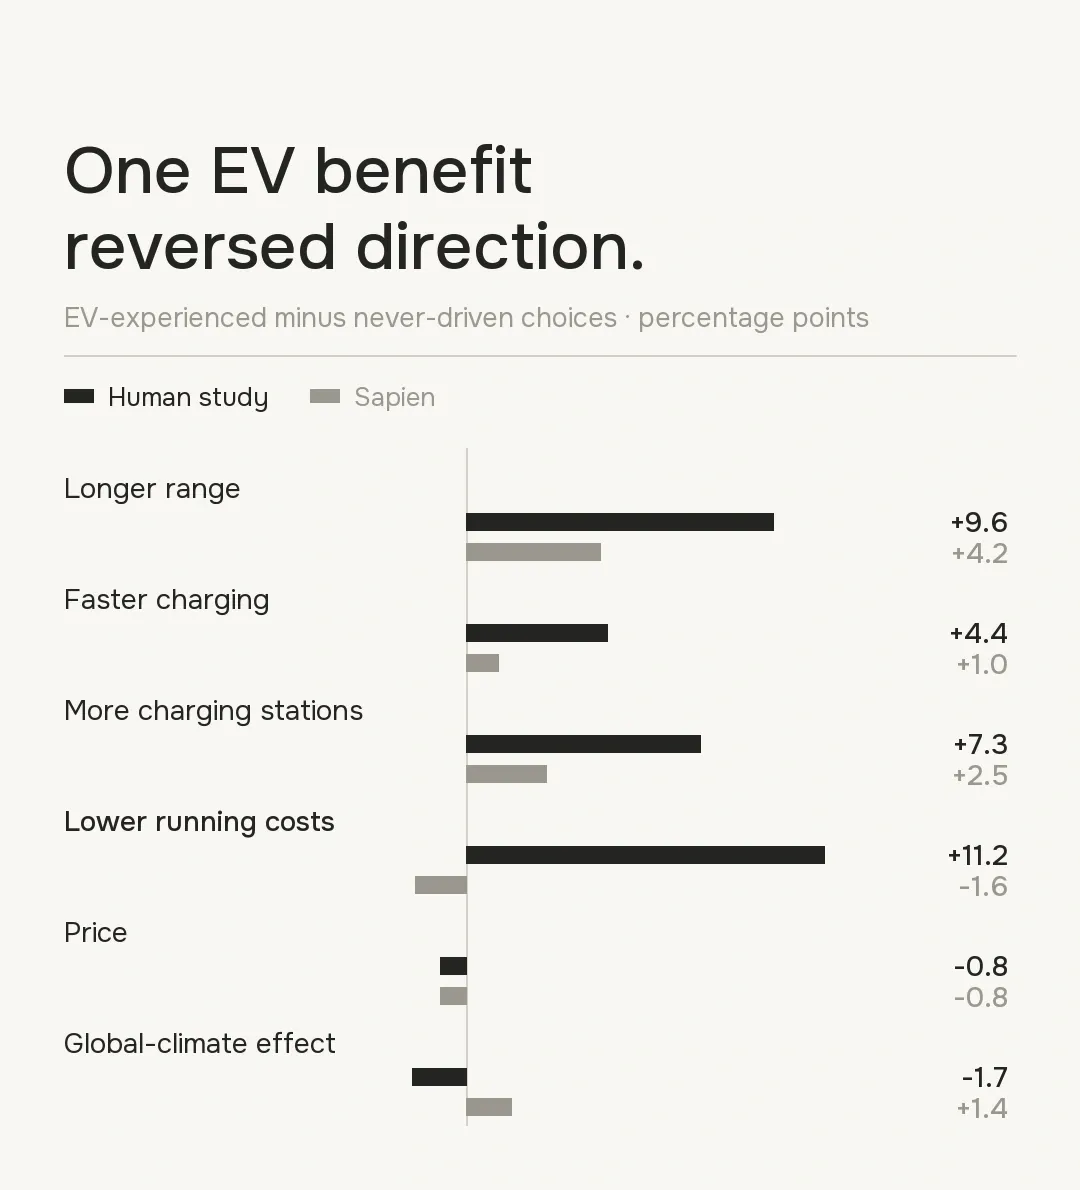
Human EV-experienced drivers placed more weight on range, charging access, and lower running costs; Sapien muted or reversed those gaps. One synthetic respondent enjoyed the quietness and acceleration but pictured fitting charging around work and children.
The distinction matters when deciding whether to speak to both groups alike. These are different respondents, so the comparison cannot show that driving an EV caused the differences. See the original survey and questionnaire.
10 Knowing a brand and choosing it
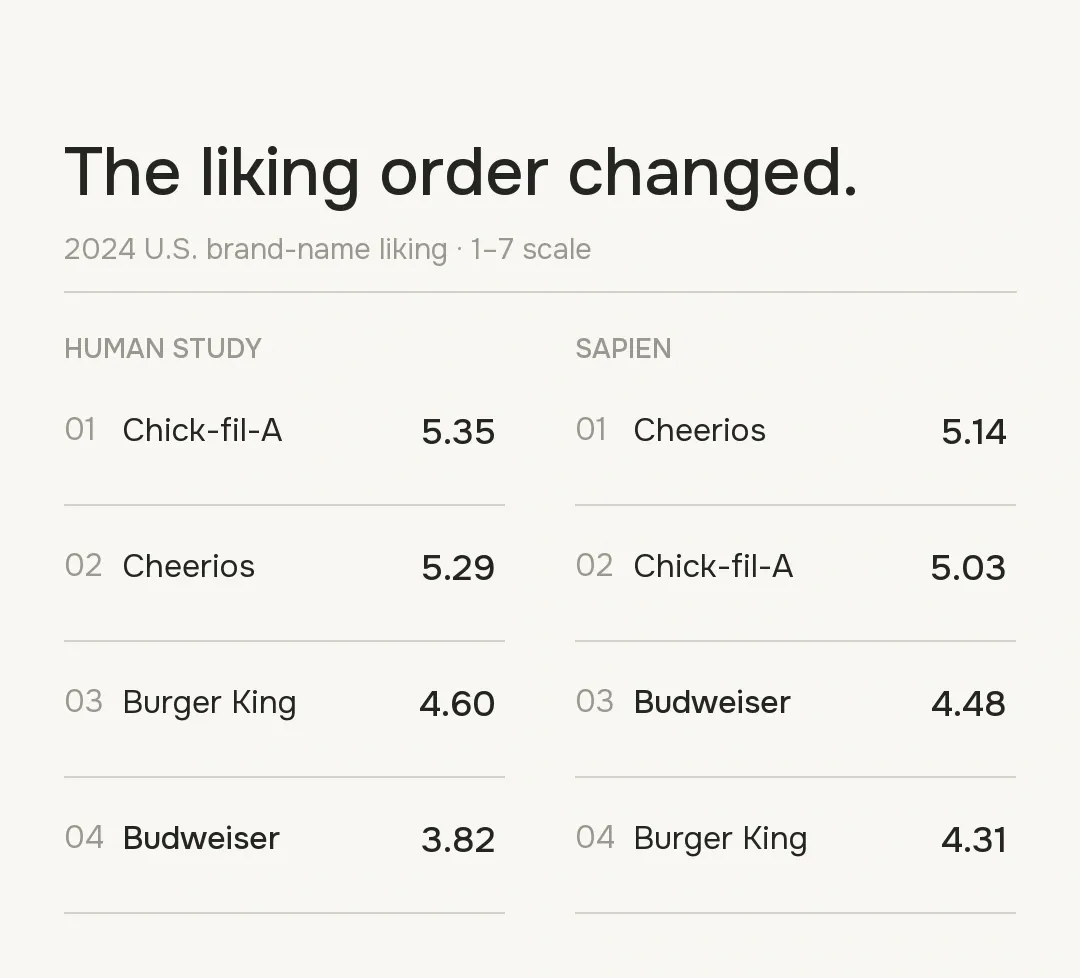
A familiar name is not necessarily a liked one. Here, even the order of brand liking changes.
The BRAND dataset measures familiarity and liking separately. We tested eight food, beverage, and restaurant names from its US brand-name study in 2024, using a 1–7 scale for each judgment.
Cheerios led the Sapien set on liking at 5.14, with Chick-fil-A at 5.03. In the human 2024 BRAND data, Chick-fil-A was slightly higher at 5.35, followed by Cheerios at 5.29. Budweiser is a clearer miss: Sapien’s liking estimate was 4.48, against 3.82 human.
Brand liking, out of 7 | Human 2024 | Sapien |
|---|---|---|
Chick-fil-A | 5.35 | 5.03 |
Cheerios | 5.29 | 5.14 |
Budweiser | 3.82 | 4.48 |
Burger King | 4.60 | 4.31 |
Brand-name liking, not logo liking. Each human brand mean is based on 39–41 ratings.
An older synthetic respondent associated 7-Up with hot summers and an ice-cold drink after working outside. A younger respondent knew the name but rarely encountered it at home:
“It feels familiar as a name, not like a brand that became part of my own routine.”
Those memories are useful for creative questions, not evidence of an age trend. A brand team could ask whether recognition comes with an occasion to choose the product, then test that separately from liking.
11 Satisfaction scores can hide a weak spot
A high satisfaction average can hide the service category that needs the most work. We tested customers' ratings of their own providers across eight product groups in FCA Financial Lives 2024. Sapien's averages stayed between 7.57 and 7.91 out of 10. The FCA's published results vary more sharply.
Provider category | Human average | Sapien average |
|---|---|---|
Contents insurance | 8.4 | 7.70 |
Day-to-day account | 8.1 | 7.81 |
Defined-contribution pension | 6.7 | 7.91 |
Selected categories, rated from 0 to 10. FCA averages exclude “don't know” answers. Each category covers holders of that product.
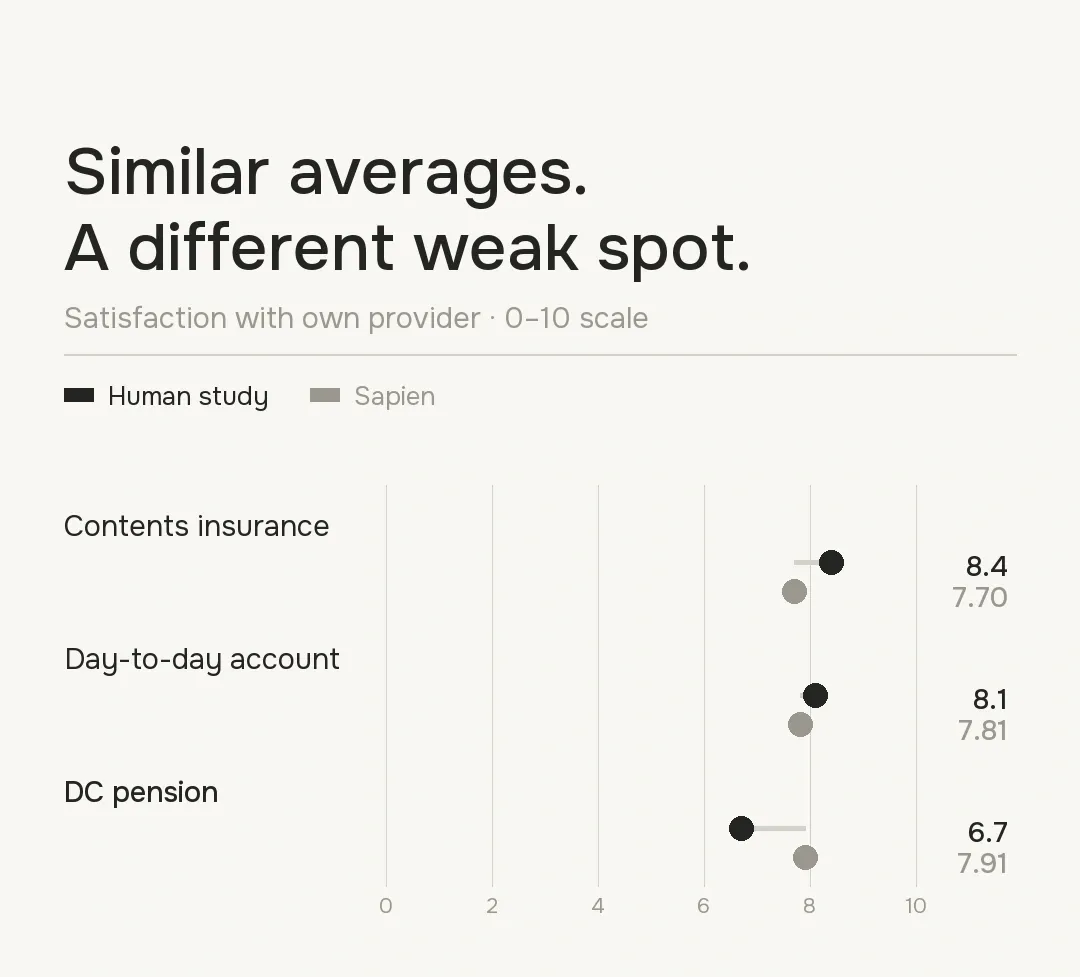
Sapien ranked pension satisfaction highest in its tested set; the FCA found it comparatively low. Contents insurance showed the reverse pattern. A team choosing where to improve service could pick the wrong category from Sapien's ranking alone.
The synthetic accounts still suggest useful questions. An insurance customer resented having to challenge a renewal price; a banking customer valued predictable payments and patient help. Neither account explains away the missed ranking.
Offers and understanding
12 Making a savings offer easier to accept
In Trial 3 of FCA Occasional Paper 19, longstanding savings customers received a letter offering a higher-rate account. Adding a prefilled form and prepaid envelope made it easier to act.
The human study recorded action within four weeks: converting or closing the account, or withdrawing at least 95% of its starting balance.
Outcome | Human study | Sapien forecast |
|---|---|---|
Letter alone | 3.0% | 2.9% |
Letter plus simplified response | 11.7% | 6.1% |
Increase | +8.7 pp | +3.2 pp |
For every 1,000 recipients, the human lift was about 87 additional actions; Sapien forecast 32. Both results favor the easier response process, but they imply very different returns from changing the letter.
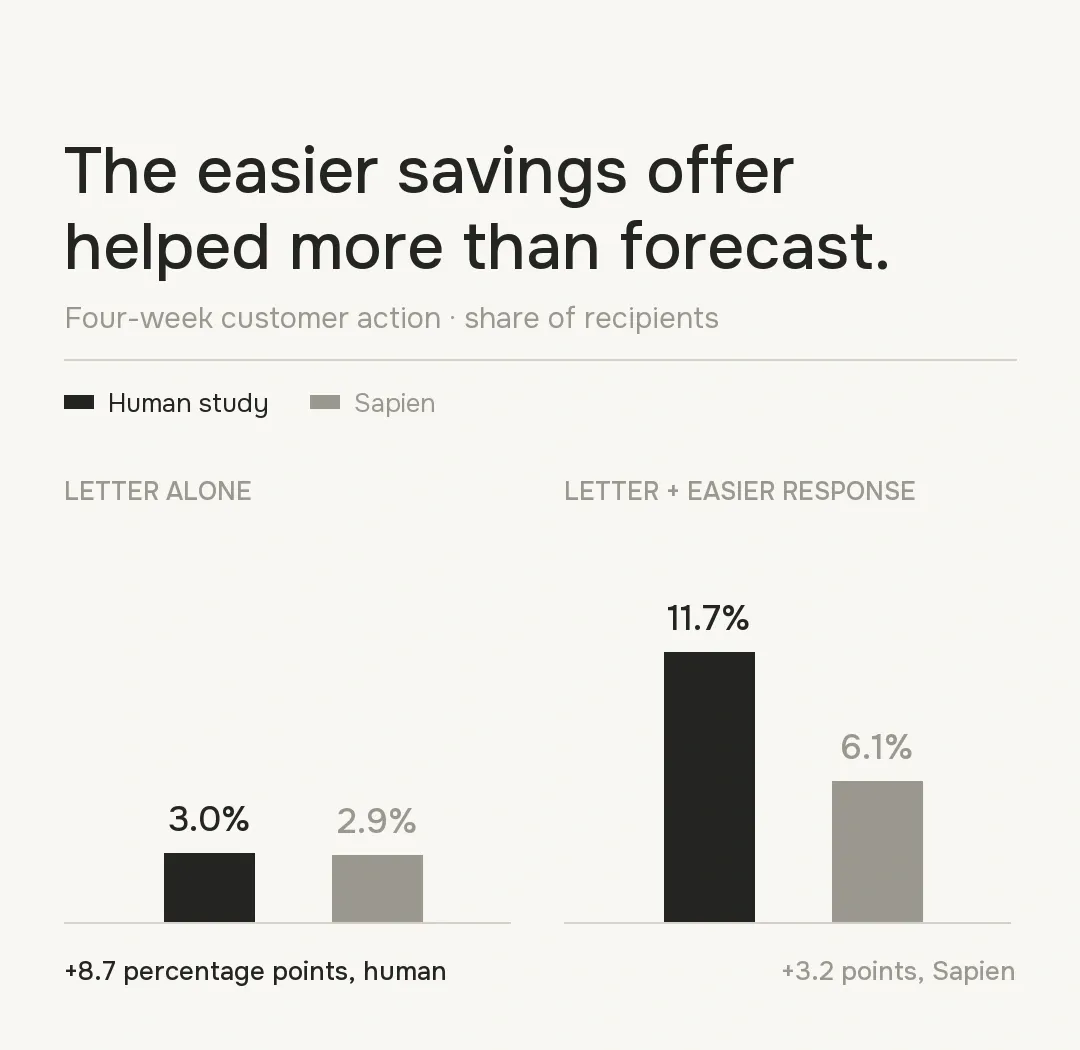
One synthetic respondent felt the prefilled form left only a small task to finish. Another found the offer suspiciously easy and worried about a catch. Fewer steps may help, but customers also need confidence about what happens after they sign.
13 What customers notice when ordering food
When ordering dinner, someone can care about food hygiene and still choose by price, delivery time, and reviews.
We recreated the early interviews from FSA/Ipsos research into online food ordering, before the discussion of display requirements. The original human report found that participants focused on cost, delivery time, reviews and familiar outlets. Many assumed food was safe without actively checking hygiene until an unfamiliar outlet or bad experience made it salient. The synthetic sample also included 40 participants: 20 in England and 20 in Northern Ireland.
The synthetic interviews echoed that ordering routine. One participant captured the gap between caring about hygiene and checking it while hungry:
“It is important to me, although it’s not necessarily the first thing I look at when I’m hungry and scrolling through an app.”
Each reviewer judged five of six published human findings to be specific matches in the synthetic interviews, or 83.3%. Both judged the same four findings to be specific matches, covering 66.7% of the six findings.
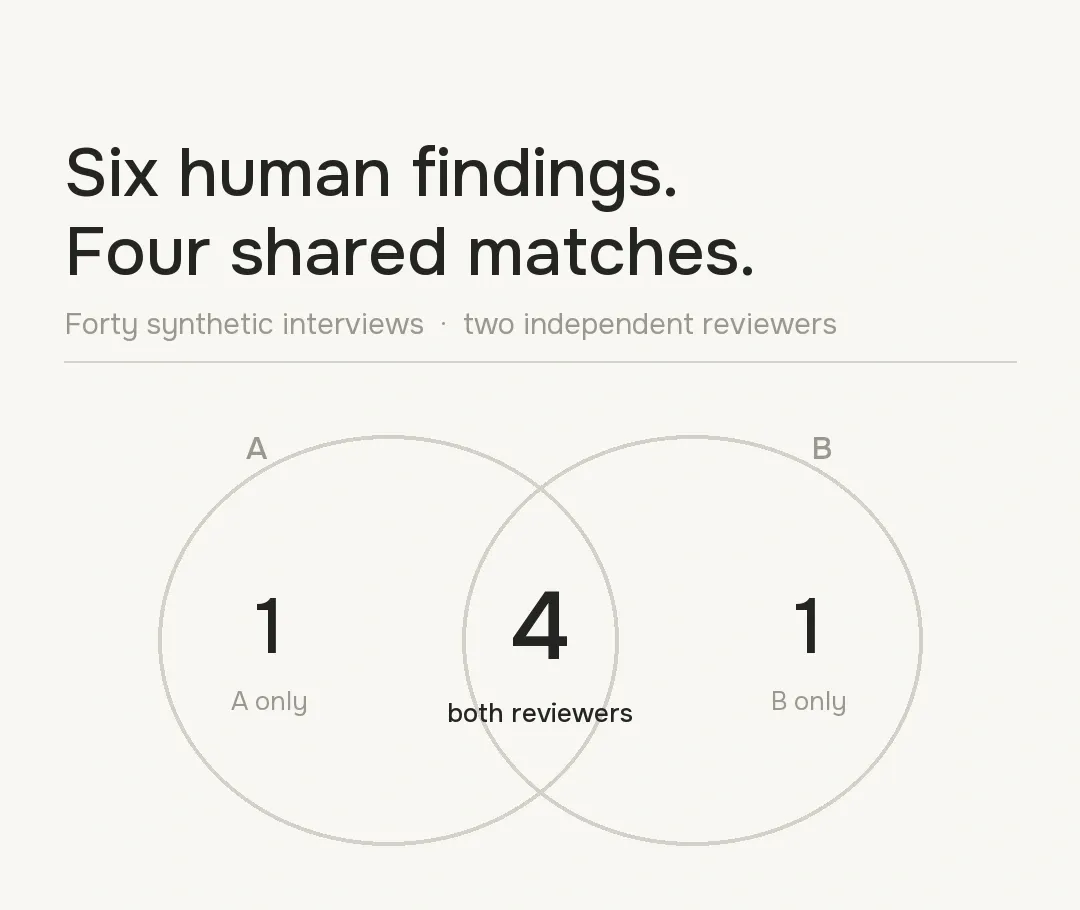
Both reviewers found much of the human pattern, but not exactly the same five findings. The match shows that the interviews surfaced familiar concerns; it does not show how common any concern is in the wider population.
14 Understanding who controls a home battery
A customer may understand that a battery saves money while misunderstanding who can use its power.
The BIT/Citizens Advice experiment compared a standard offer with one explained through a plain FAQ. We focused on three benefits: cheaper off-peak electricity, solar energy use, and “flexibility services,” which let an energy supplier use the battery.
Benefit understood | Human change after FAQ | Sapien change after FAQ |
|---|---|---|
Off-peak electricity savings | +0.9 pp | 0.0 pp |
Solar energy use | −4.4 pp | 0.0 pp |
Flexibility services | +15.1 pp | +33.7 pp |
Changes in the share answering correctly, FAQ minus standard offer. The human study reported these changes without testing whether they could be due to chance.
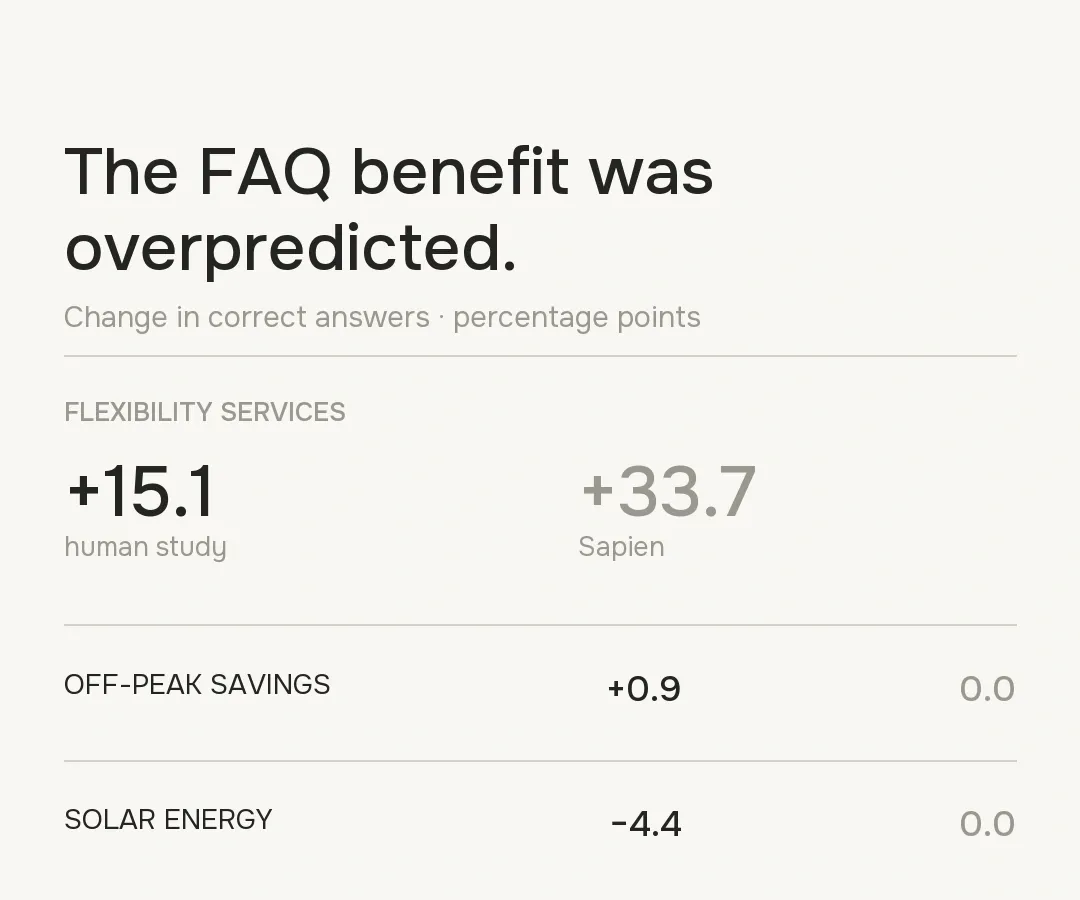
Sapien captured the improvement on flexibility services but estimated it at about 2.2 times the human result. It also missed the smaller decline on solar energy use.
One synthetic respondent assumed the supplier would take only spare capacity, leaving household needs protected. Another asked who would get first call on the power.
If the supplier can use more than spare capacity, an offer team needs to find that misunderstanding before relying on a favorable clarity score. A concrete situation in which the household and grid need power at once would test the assumption more directly. Predicting how much an FAQ improves understanding remains a separate question.
What these comparisons show
The paired values tell a more useful story than one score. Sapien put Budweiser first alongside the human Ad Meter panel and came close on the savings letter's 3.0% starting response rate. It missed the size of the easier letter's lift, understated human willingness to pay for conventional beef, overstated it for lab-grown beef, and muted an audience split on EV running costs.
Each miss asks for a different response. Recheck an ad ranking before choosing the next creative. Put a pricing forecast beside the economics of the offer. Examine a reversed audience gap before tailoring a campaign to the wrong group. The synthetic explanations help form the next question; they do not repair the numbers.
These were replication tests, with published human findings available to grade the synthetic response. Sapien can also run the research itself: define an audience, test a price or message, interview the respondents behind a surprising result, and return to the same population as the offer changes. The lesson from these 14 cases is to read the result in the units of the decision and look closely at any miss large enough to change it. Bring us the question behind your next decision.