The Data Center’s 9% Support Wasn’t One Problem
A simulated study found cash barely moved support for a data center. Bill protection, lower impact and trust changed the offer.
Sapien Experiments: Data Center Next Door
An 8.9% support rate sounds like a verdict. For the team deciding what to do next, it is barely a brief. Should they offer more money, protect household bills, redesign the site or find another location?
We put that decision into a Sapien study. Our hypothetical data center covered 100 acres a mile from homes, drew 100 megawatts of electricity and 500,000 gallons of water a day, and promised 50 permanent jobs and about $20 million a year in local property taxes. We modeled 10,000 synthetic U.S. residents across eleven versions of the proposal.
The ordinary offer drew 8.9% predicted support and 76.9% opposition. The more useful finding sat beneath that headline. Some respondents worried about an open-ended household cost. Others objected to the physical project. When those issues were addressed together, the question became whether anyone would keep the promises.
Cash was answering the wrong question
A $100 monthly payment to every nearby household lifted predicted support to 9.3%. It also produced a response a project team would hate to hear: 37.4% said they would take the money and still oppose the data center. A combined 27.6% called the payment a bribe or hush money.
Asked what amount would feel fair, 51.1% of the cash-only group picked about $500 a month. That sounds like a price to pursue until you see the rest of the answer. We never tested a $500 offer for support, and 16.9% said no amount would feel fair.
More useful was where respondents wanted the money to go. 53.3% preferred fixing the problem instead; 35.5% wanted a credit on everyone’s electricity bill. Equal household checks drew 1.1%. The company could increase the check and still leave the central exposure untouched.
Bill protection changed the comparison. The $100 payment alone reached 9.3% predicted support; the same payment paired with bill protection reached 16.4%. The share calling it a bribe or hush money was 10.1% in the protected offer.
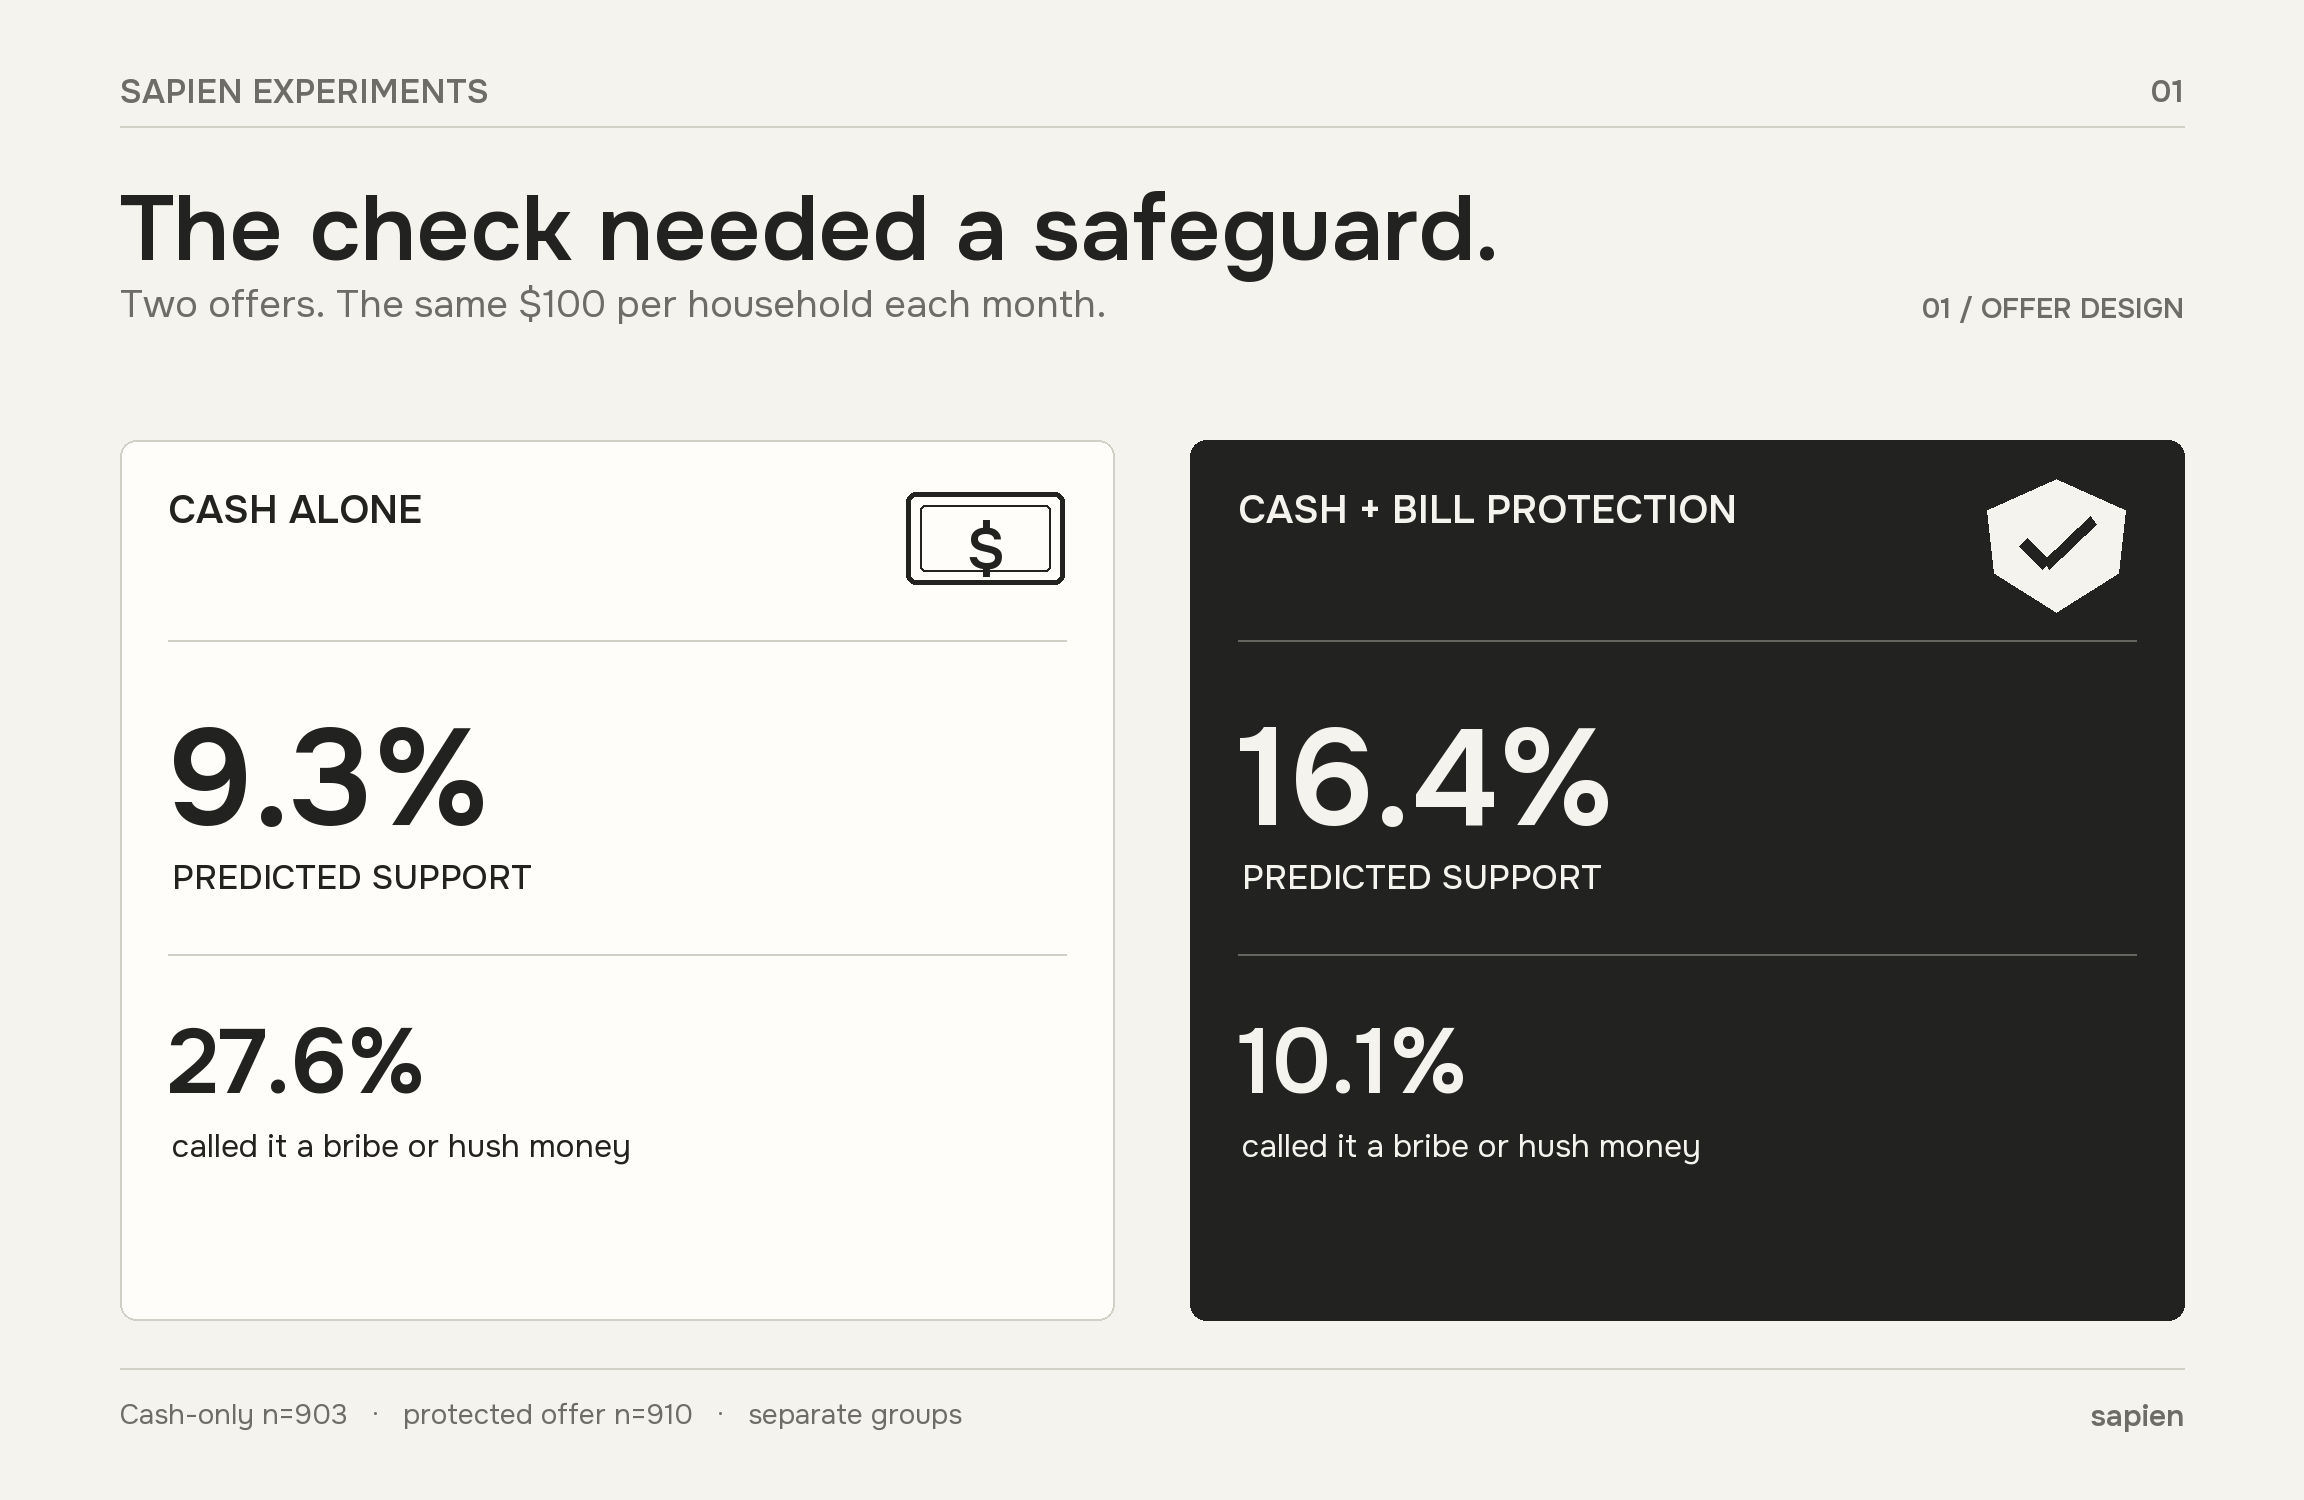
Cash-only n=903; $100 plus bill protection n=910. Different groups assessed the two offers. Support is the average predicted probability; payment reactions are selected answers.
The same amount of money belonged to two different deals. One offered a check alongside an unresolved bill concern. The other included a commitment to protect households from that cost. For anyone designing an offer, the distinction is larger than the dollar figure.
One objection could conceal another
The original proposal’s leading concerns were electricity bills (52.4%) and water (41.2%). Address bills, and water becomes the most selected concern in that proposal group (78.4%). Reduce water use, noise and the site’s surrounding impact instead, and electricity bills lead in the lower-impact group (89.9%).
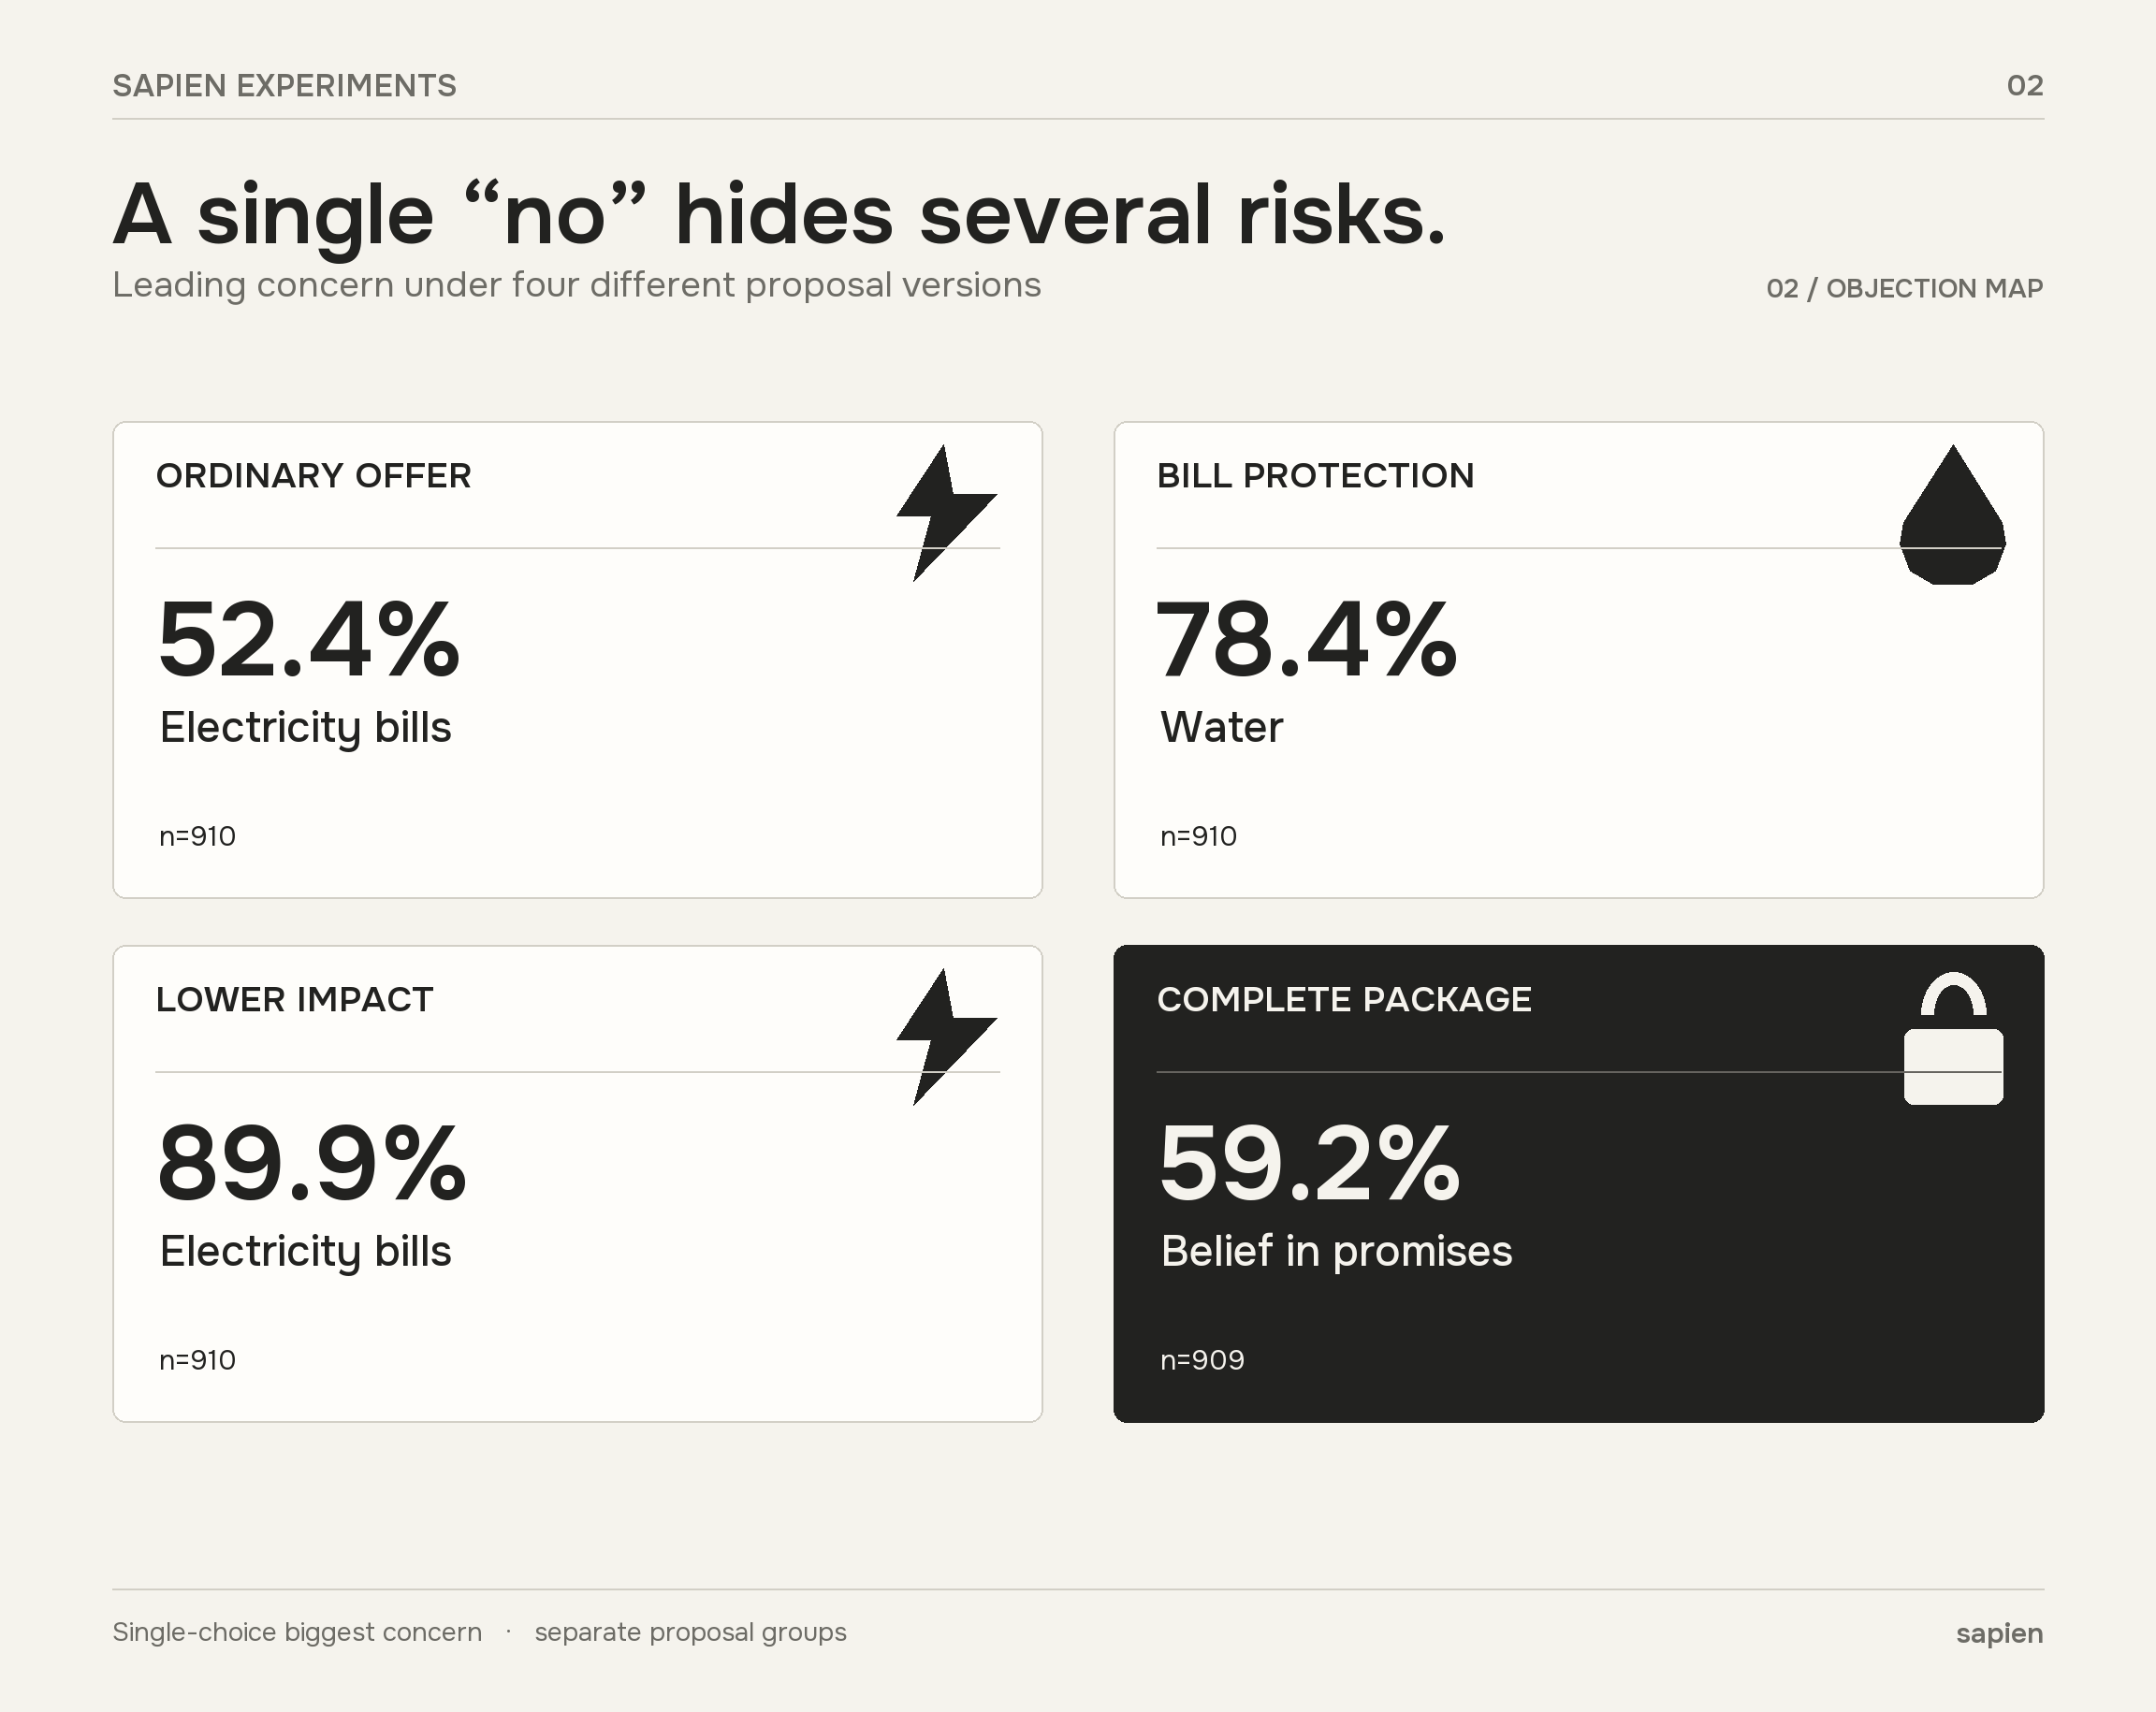
Each figure is the share selecting one biggest concern in its proposal group. Ordinary, bill-protection and lower-impact groups n=910 each; complete package n=909.
These are separate groups, so the chart does not follow individual residents changing their minds. It shows what each version of the project left unresolved. The lower-impact design reached 20.3% predicted support, more than twice the ordinary offer’s result, yet still left bills at the center of the response.
The mistake would be to take the first “no” as a single objection. A better offer has to address the conditions behind it, even when those conditions do not fit into one benefit statement.
The full package gained support and exposed a trust problem
The complete offer combined the lower-impact design, bill protection, community benefits and guarantees. Predicted support reached 37.6%, opposition 39.3%, with 23.1% unsure. That is 28.7 percentage points more support than the ordinary offer, but still short of a majority.
Among the 362 recorded supporters of the complete package, 46.7% named payments or protections as their main reason; 41.7% named what the money could do for local schools. The offer appealed through both private protection and a shared benefit. Those are supporters’ selected explanations, rather than a test of which element caused each person to support it.
Trust was the largest remaining concern. 59.2% in the complete-package group chose whether they believed the promises as their biggest issue. 88.9% picked an escrow arrangement the company would automatically lose if it failed to deliver as the way to make guarantees feel real. That term is a concrete next offer to test; its effect on support was not measured here.
It also matters that guarantees alone did little. Adding them to the lower-impact design left predicted support at 20.3%. A promise did not substitute for addressing the bill and site concerns.
The combined result hid different local stories
The complete package did not land the same way across the six modeled metro groups. Predicted support ranged from 46.2% in Des Moines to 30.1% in Richmond.
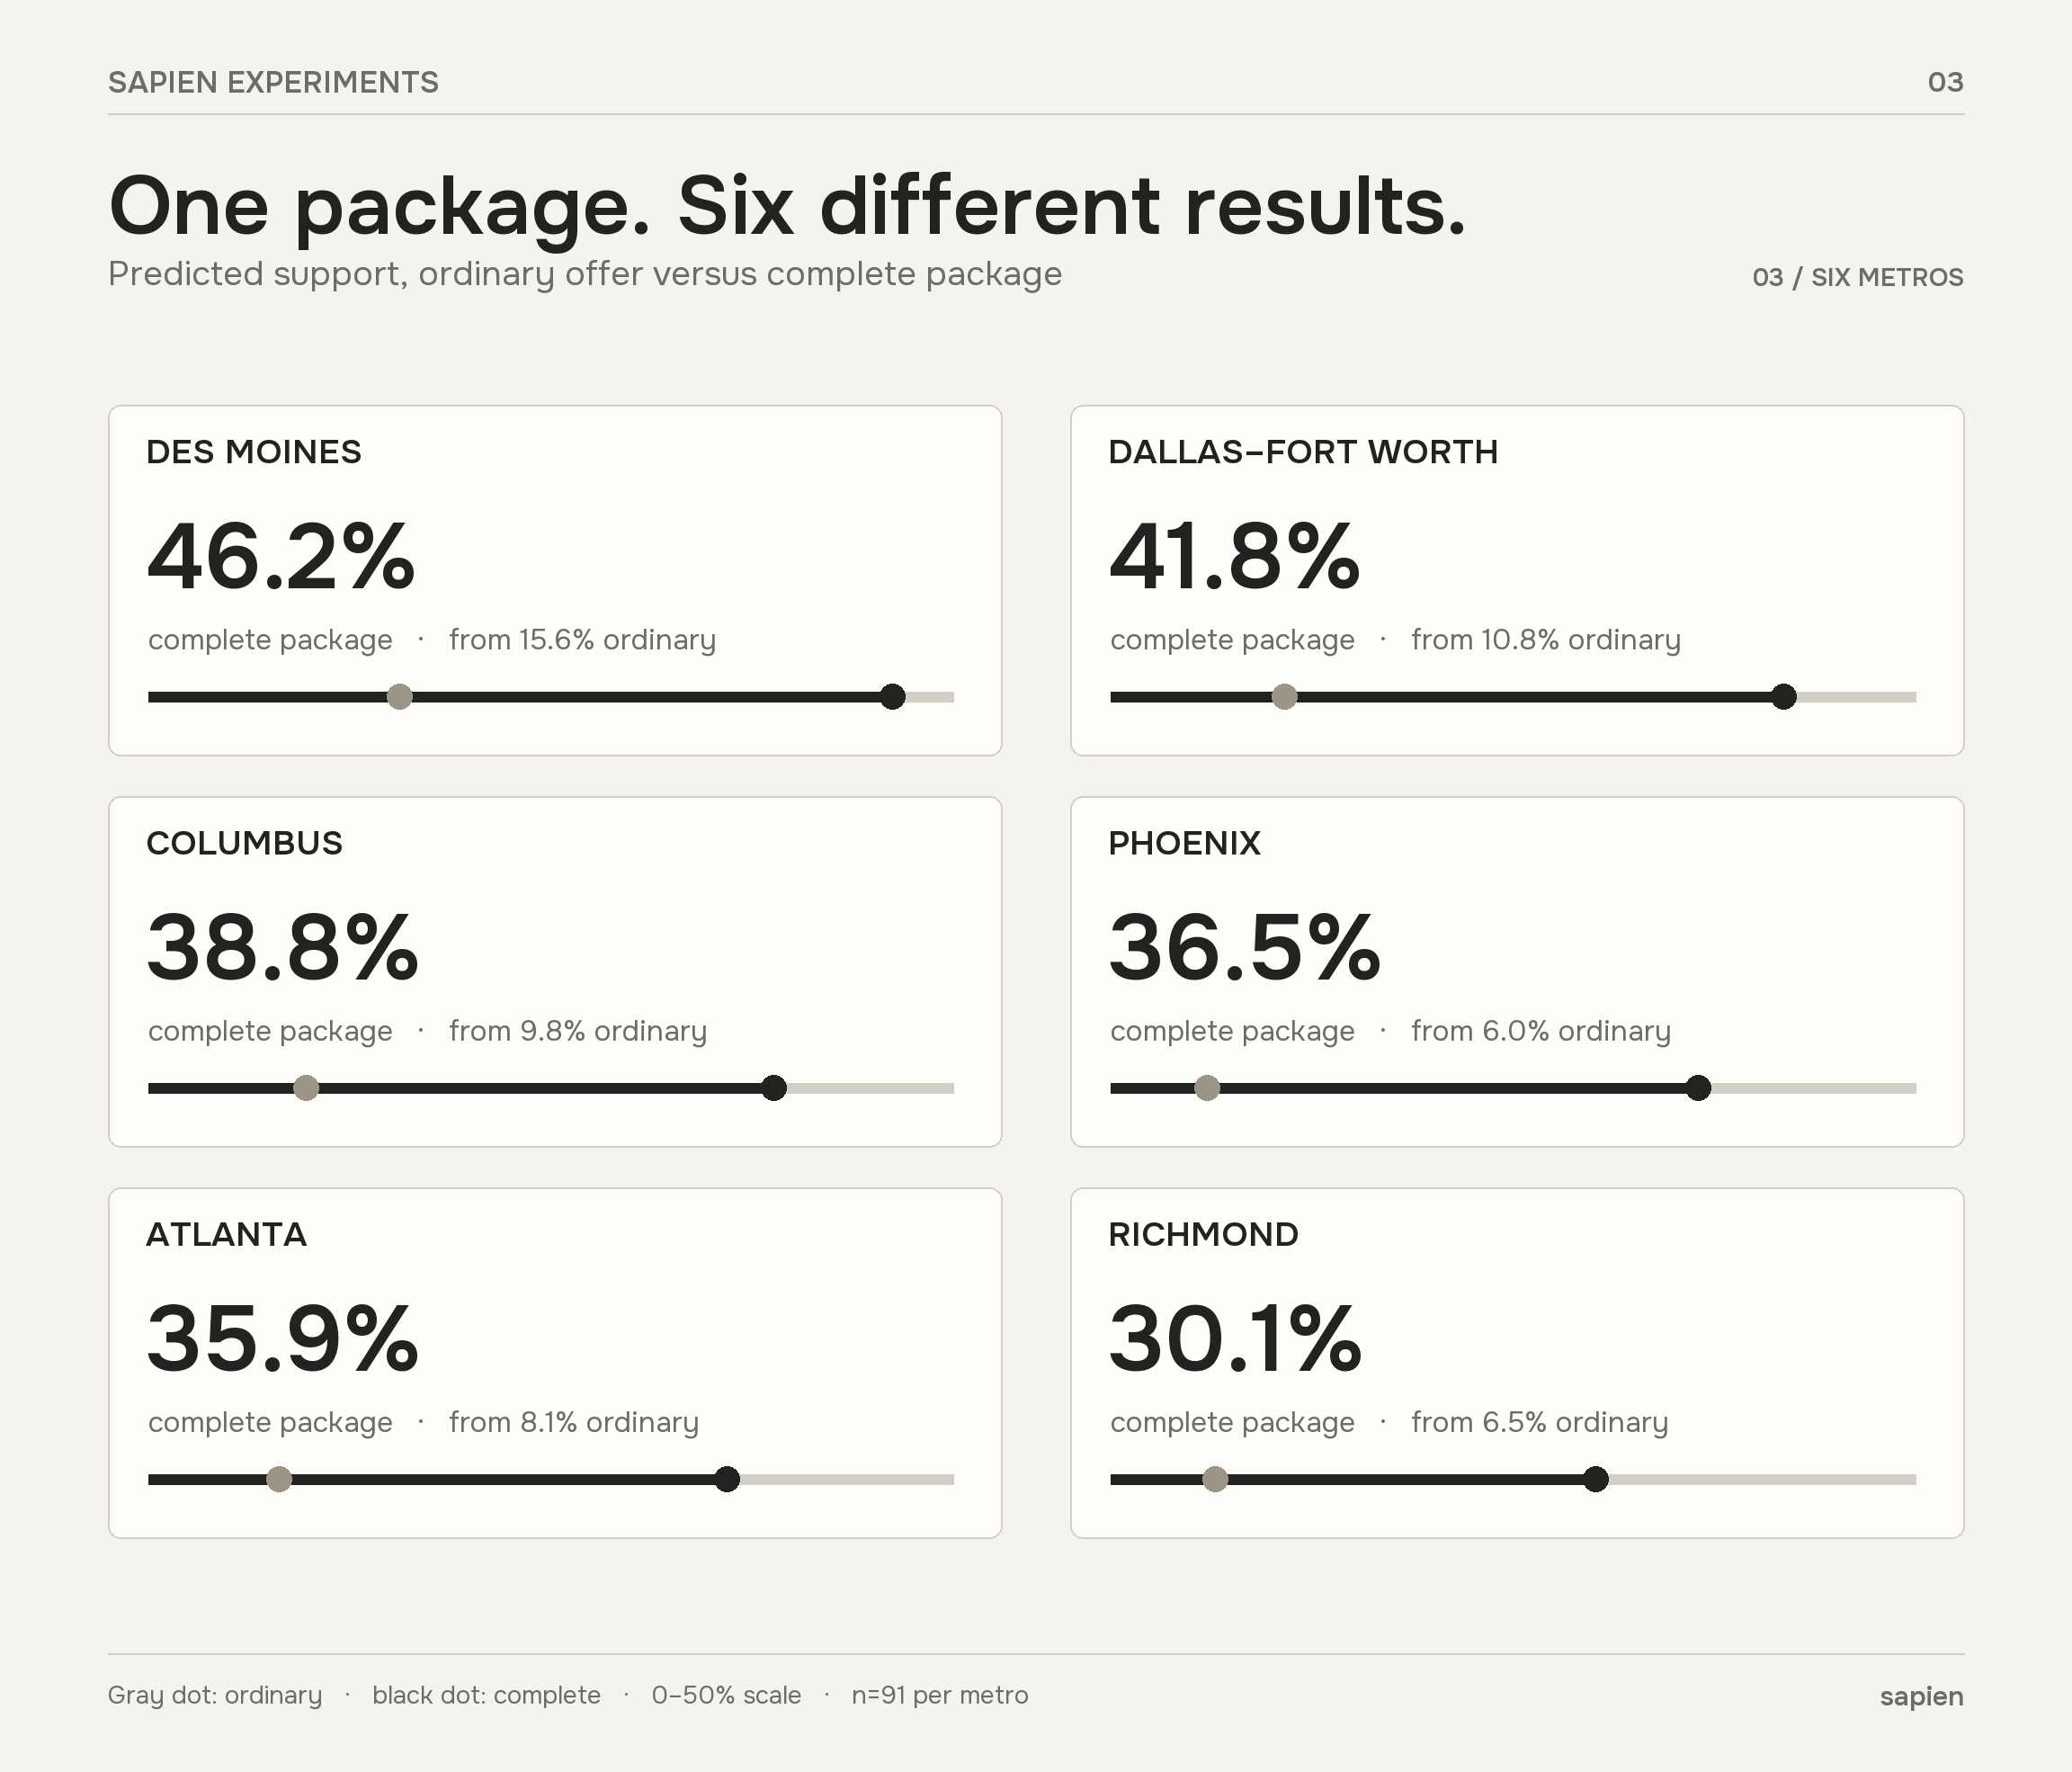
Each metro comparison used 91 modeled profiles per offer.
The first objection varied too. In the ordinary-offer groups, 97.8% in modeled Columbus chose electricity bills as their biggest concern; 97.8% in modeled Phoenix chose water. In Des Moines, 31.9% chose noise or the building’s presence, against 5.6% across the full ordinary-offer group. Water still led in Des Moines at 51.6%.
An insights team taking only the combined figure into a planning meeting would miss where the same proposal needs a different answer. The metro results are a reason to investigate those locations more closely, not to label any city won or lost.
The decision behind the research
This study did not produce a magic payment or a universal pitch. It produced a map of the offer. Cash alone left costs exposed. A quieter, lower-water design addressed another concern. A package that did more of both won substantially more support, then brought credibility to the front.
That is the kind of result Sapien is built to deliver. We build populations grounded in real-world data, compare complete propositions, and examine the answers behind the topline. The value for a product, strategy or insights team is knowing what to change next, for which audience, before treating the first approval number as the whole story.