SKU Rationalization Starts With the Lost Buyer
A slow seller can be worth keeping. Work through two removal scenarios and see how transferred purchases and avoidable costs change the decision.
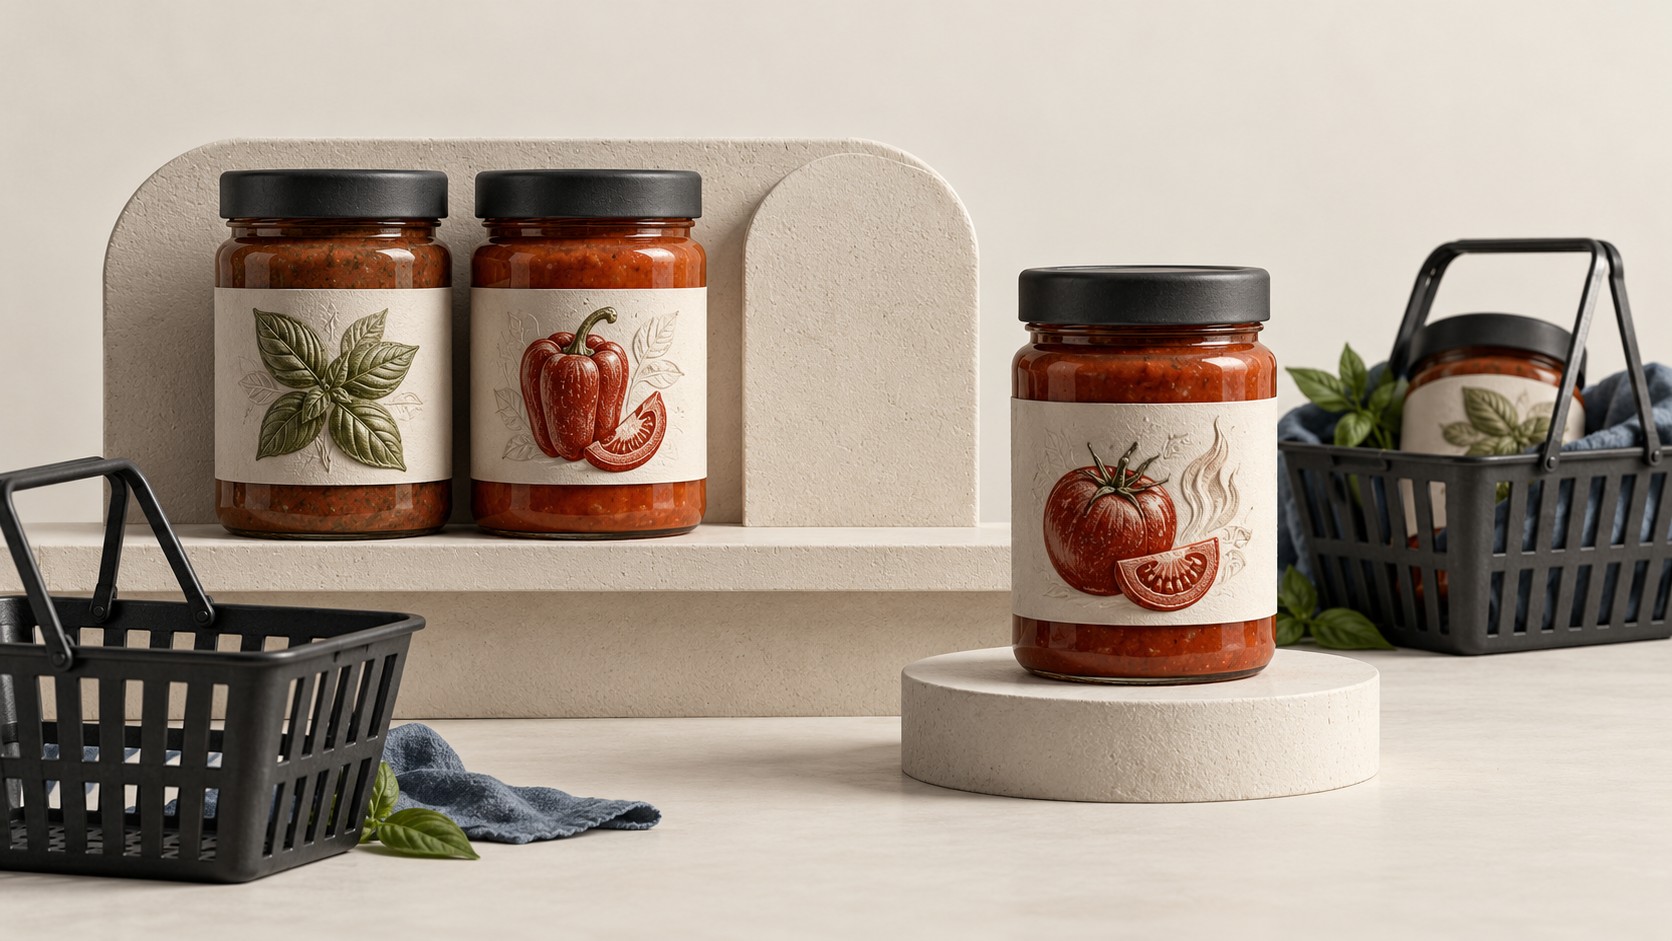
SKU rationalization is the decision to keep, change or remove products from a range based on what they contribute and what shoppers would do without them. The lowest-selling item is a starting point for investigation, not an automatic deletion.
Imagine a sauce brand with three 350 g jars. Its smoky tomato variant sells much less than basil or roasted pepper. Removing it would simplify production, but the commercial answer depends on who buys it. Some shoppers might switch to basil. Others might switch brands, skip the purchase or stop buying the brand altogether.
The useful research question is: how much of the removed item's contribution would the remaining range recover, and what would the business actually save?
A removal decision has a different counterfactual
A range-selection study asks which set of products covers the most buyer needs. A launch study asks what an additional item would replace. SKU rationalization asks what changes when an existing choice disappears.
That last question needs the current range as its reference. If you show people only the proposed smaller range, you can learn which remaining option they choose. You can't tell whether that choice replaces their previous purchase or whether the smaller range has lost them entirely.
Our TURF analysis guide covers unduplicated consideration across a constrained range. For removal, you also need substitution and the outside option. NIQ's assortment approach explicitly considers demand transfer and the sales risk of delisting. The important change in the research brief is from “Which items look strong?” to “What does each plausible removal do to the whole offer?”
The small item might protect a valuable purchase
For this illustrative sauce example, all three jars cost $5. The brand is considering removing smoky tomato. The figures below are planning assumptions, not results from a completed study.
Current item | Monthly sales and contribution |
|---|---|
Basil, 350 g | 1,000 jars; $2 contribution per jar |
Roasted pepper, 350 g | 600 jars; $2.20 contribution per jar |
Smoky tomato, 350 g | 200 jars; $1.80 contribution per jar |
Here, contribution means sales less the variable costs assigned to each jar. The smoky variant also creates $180 a month of production and handling cost that finance says would disappear if it were removed. That cost isn't included in the $1.80 figure; otherwise the saving would be counted twice.
The 200 smoky-tomato purchases represent purchase occasions, each involving one jar. They aren't assumed to be 200 different people. A household buying the variant every week could account for several occasions, and losing that household might affect other products in its basket.
A sales ranking won't reveal that dependency. Ask whether the variant supplies a distinct taste, pack, price point or usage situation, whether its buyers also purchase other items, and whether an apparent decline reflects demand or poor availability. A product that was frequently out of stock has had fewer chances to sell.
Where the displaced purchases go
Consider two possible allocations of those 200 occasions after removal:
Destination | Stronger retention / weaker retention |
|---|---|
Basil | 80 jars / 40 jars |
Roasted pepper | 60 jars / 30 jars |
Competitor, another category or no purchase | 60 occasions / 130 occasions |
Within-brand retention | 140 of 200, or 70% / 70 of 200, or 35% |
The outside choices remain in the base. A test that forces every shopper to select basil or pepper would manufacture complete retention.
With stronger retention, the brand recovers $292 in contribution: 80 × $2 plus 60 × $2.20. Removing smoky tomato loses its $360 contribution, while avoiding $180 in cost. The monthly change is therefore:
$292 recovered − $360 removed + $180 saved = $112 more contribution.
With weaker retention, recovered contribution is $146. The same calculation gives $146 − $360 + $180 = $34 less contribution.
Nothing changed about the item's original sales rank. The decision changed because the assumed substitution changed. The business needs at least $180 of recovered contribution to break even under these cost assumptions. Its research should concentrate on whether that recovery is plausible, and how uncertain it is.
A comparison buyers can actually make
Use a defined shopping situation with the current products, realistic prices and feasible alternatives. Compare the existing range with a version in which only the proposed item is removed. Keep the relevant display and availability conditions consistent, and allow a competing product, postponement or no purchase.
Give comparable groups their first encounter with one arrangement when you need an independent range comparison. A later direct comparison can help explain why someone objects to a removal, but it isn't the same as an ordinary first shopping encounter. Our shopper research guide works through this distinction with a constrained shelf.
Pay particular attention to current buyers of the proposed deletion. A sample of general category buyers can make a niche item look unnecessary because most respondents never bought it. Keep the eligible category base and the current-item-buyer base visible, with enough detail to see whose choice changes.
The report should connect the old choice with its replacement. If records can't support that link, label the source of switching unknown. Don't infer it by subtracting two unrelated sets of preferences.
Sapien can compare defined range scenarios with a modeled audience and explore the reasons behind its choices. Observed sales transfer still needs transaction or pilot evidence.
The decision sheet finance and category teams can share
Keep the calculation close to its evidence:
Decision input | What belongs beside it |
|---|---|
Removed contribution | Current units, period, price, variable-cost definition and availability |
Recovered contribution | Destination item, transferred units, contribution per unit and evidence source |
Avoided cost | The specific cash or operating cost that actually disappears, with its owner |
Other effects | Basket changes, service commitments, shelf constraints and transition costs |
Uncertainty | Alternative transfer and saving assumptions that could reverse the decision |
A freed production slot isn't automatically a cash saving. A discontinued item may leave fixed overhead unchanged, and an attractive replacement may require extra setup or stock. Use finance's avoidable-cost estimate rather than allocating a share of overhead and calling it saved.
The result also needs the retailer's operational view. A smaller range may improve availability of retained products, but that improvement has to occur in the proposed arrangement. Store capacity, replenishment and supplier terms belong in the feasible comparison.
A reversible removal before a permanent one
Where practical, test the smaller range in suitable stores or customer groups before a full withdrawal. Record whether the intended products were present, what competitors and promotions changed, and how units, value and contribution moved over comparable periods. Use an appropriate comparison design rather than crediting every before-and-after difference to the delisting.
Watch the buyers whose needs the item uniquely served. Total brand units can recover while a smaller group leaves; that can be acceptable or unacceptable depending on the range's purpose and the economics. State that trade-off rather than hiding it inside an average.
Remove an item when its absence improves the business after substitution, lost purchases, real savings and operational consequences have all been counted. A low sales rank alone doesn't settle that decision.