2026 Midterms forecast
Sapien’s call for every Senate and governor race and the 57 closest House seats, published before polls open on 3 November 2026.
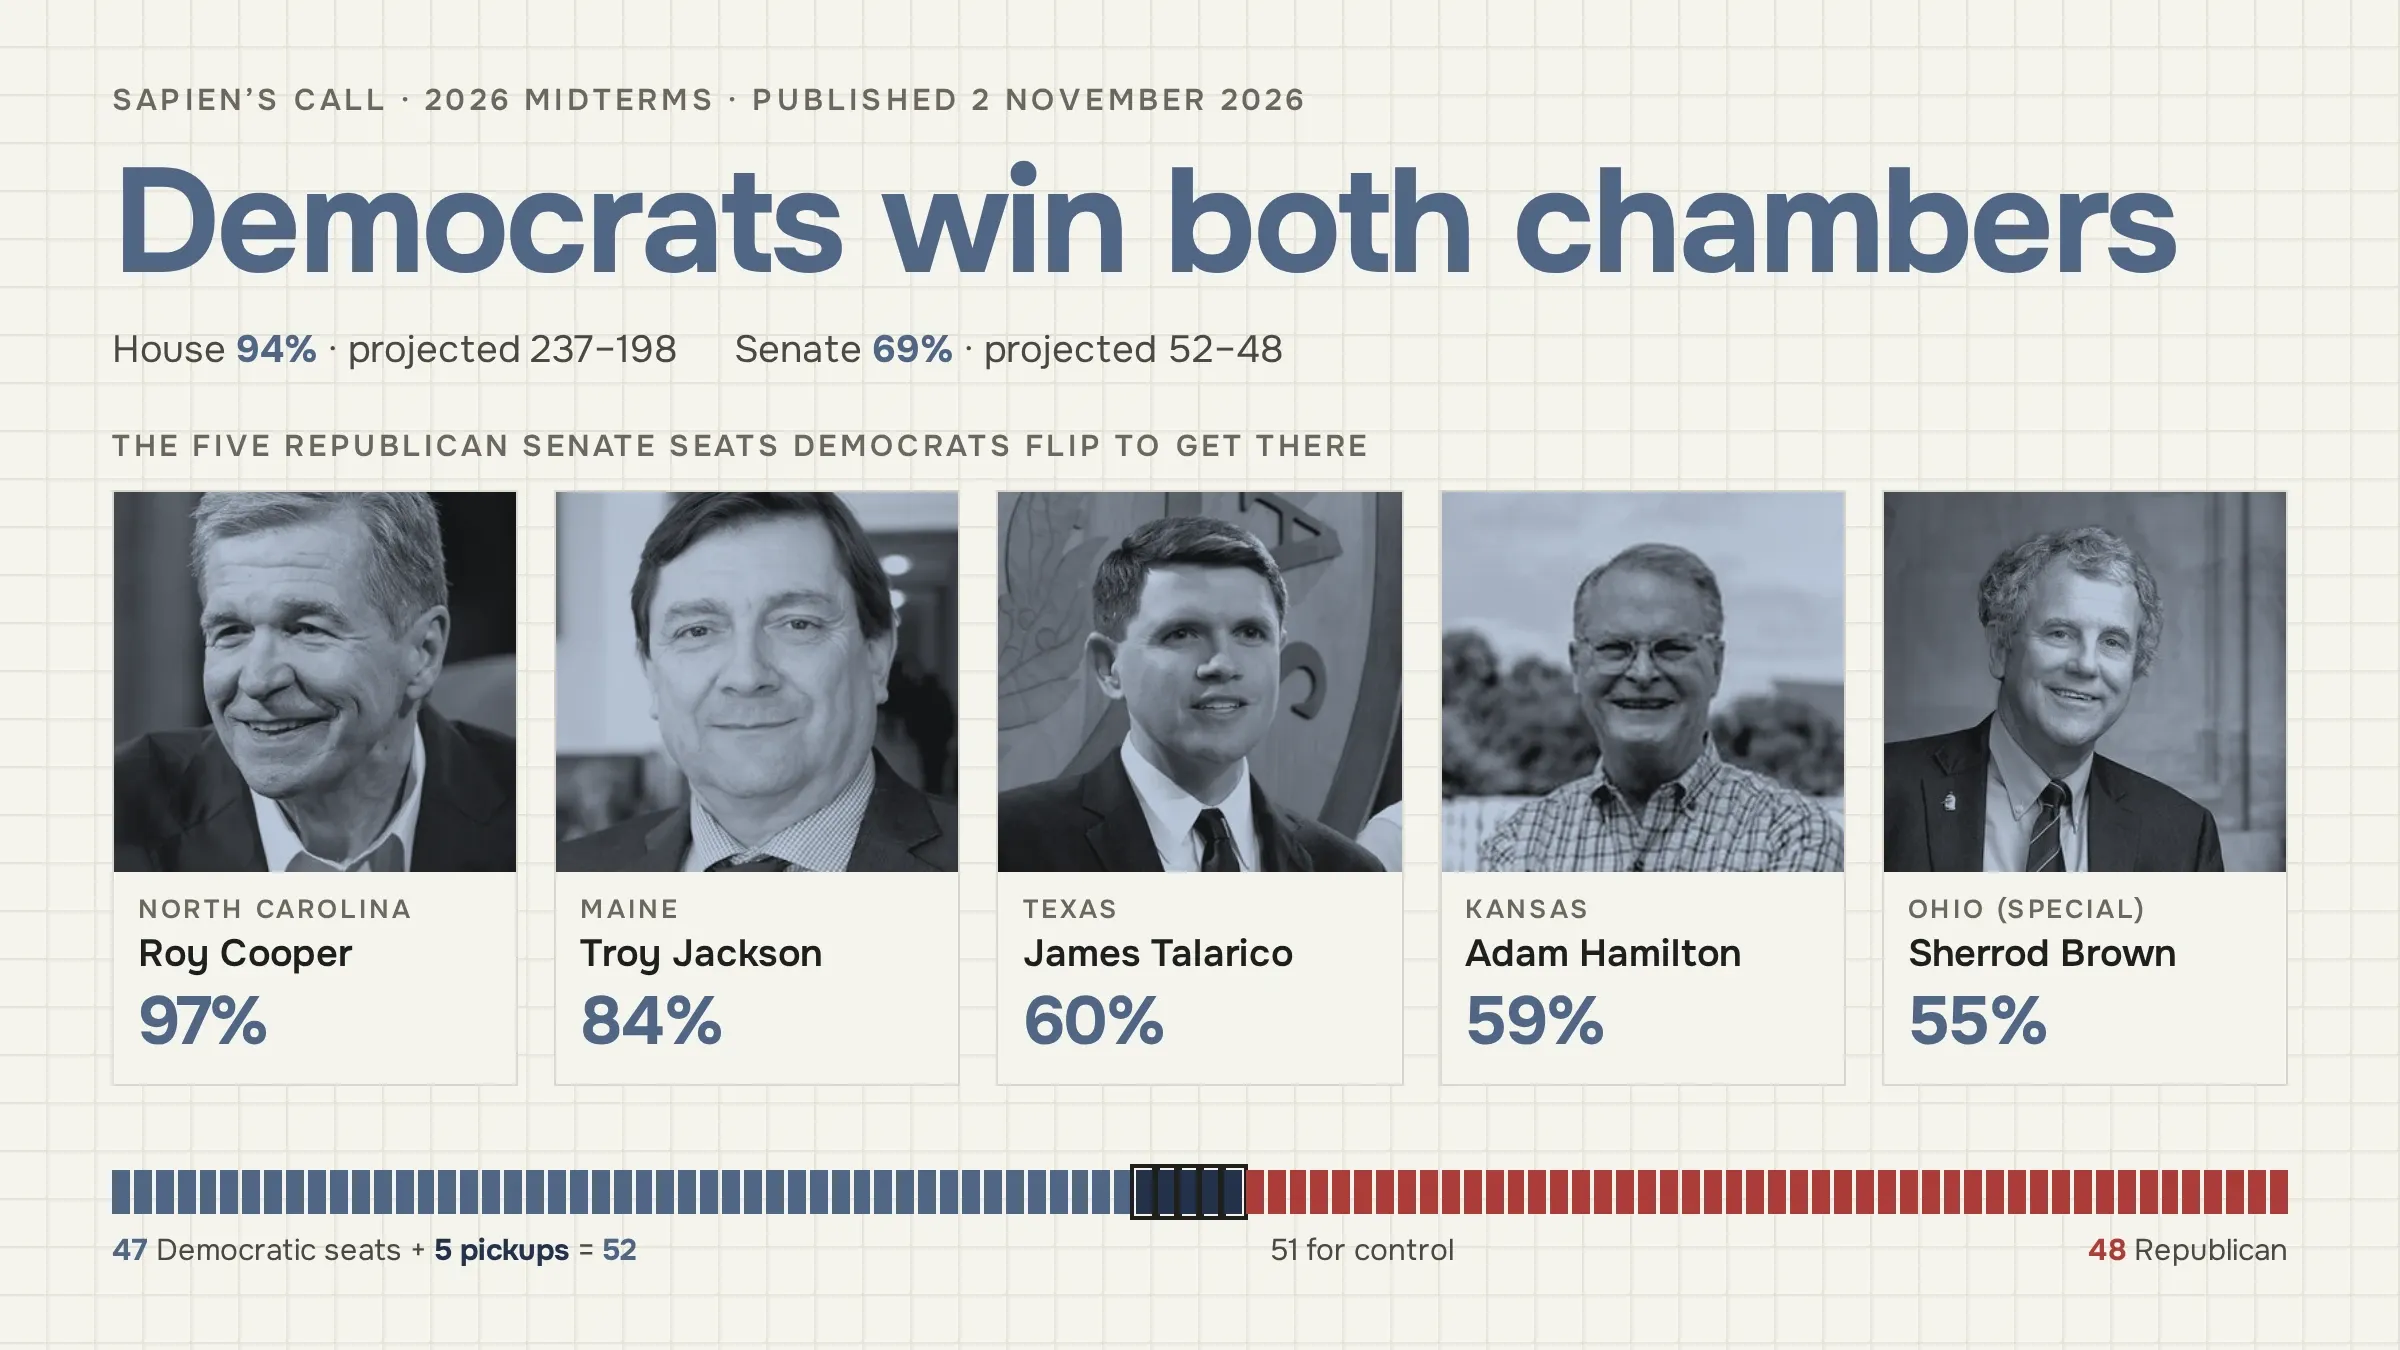
This is Sapien’s forecast for the 2026 US midterm elections. We are publishing it before polls open on 3 November and will not change it afterwards. The date on this page and the PDF at the bottom are the record of what we predicted.
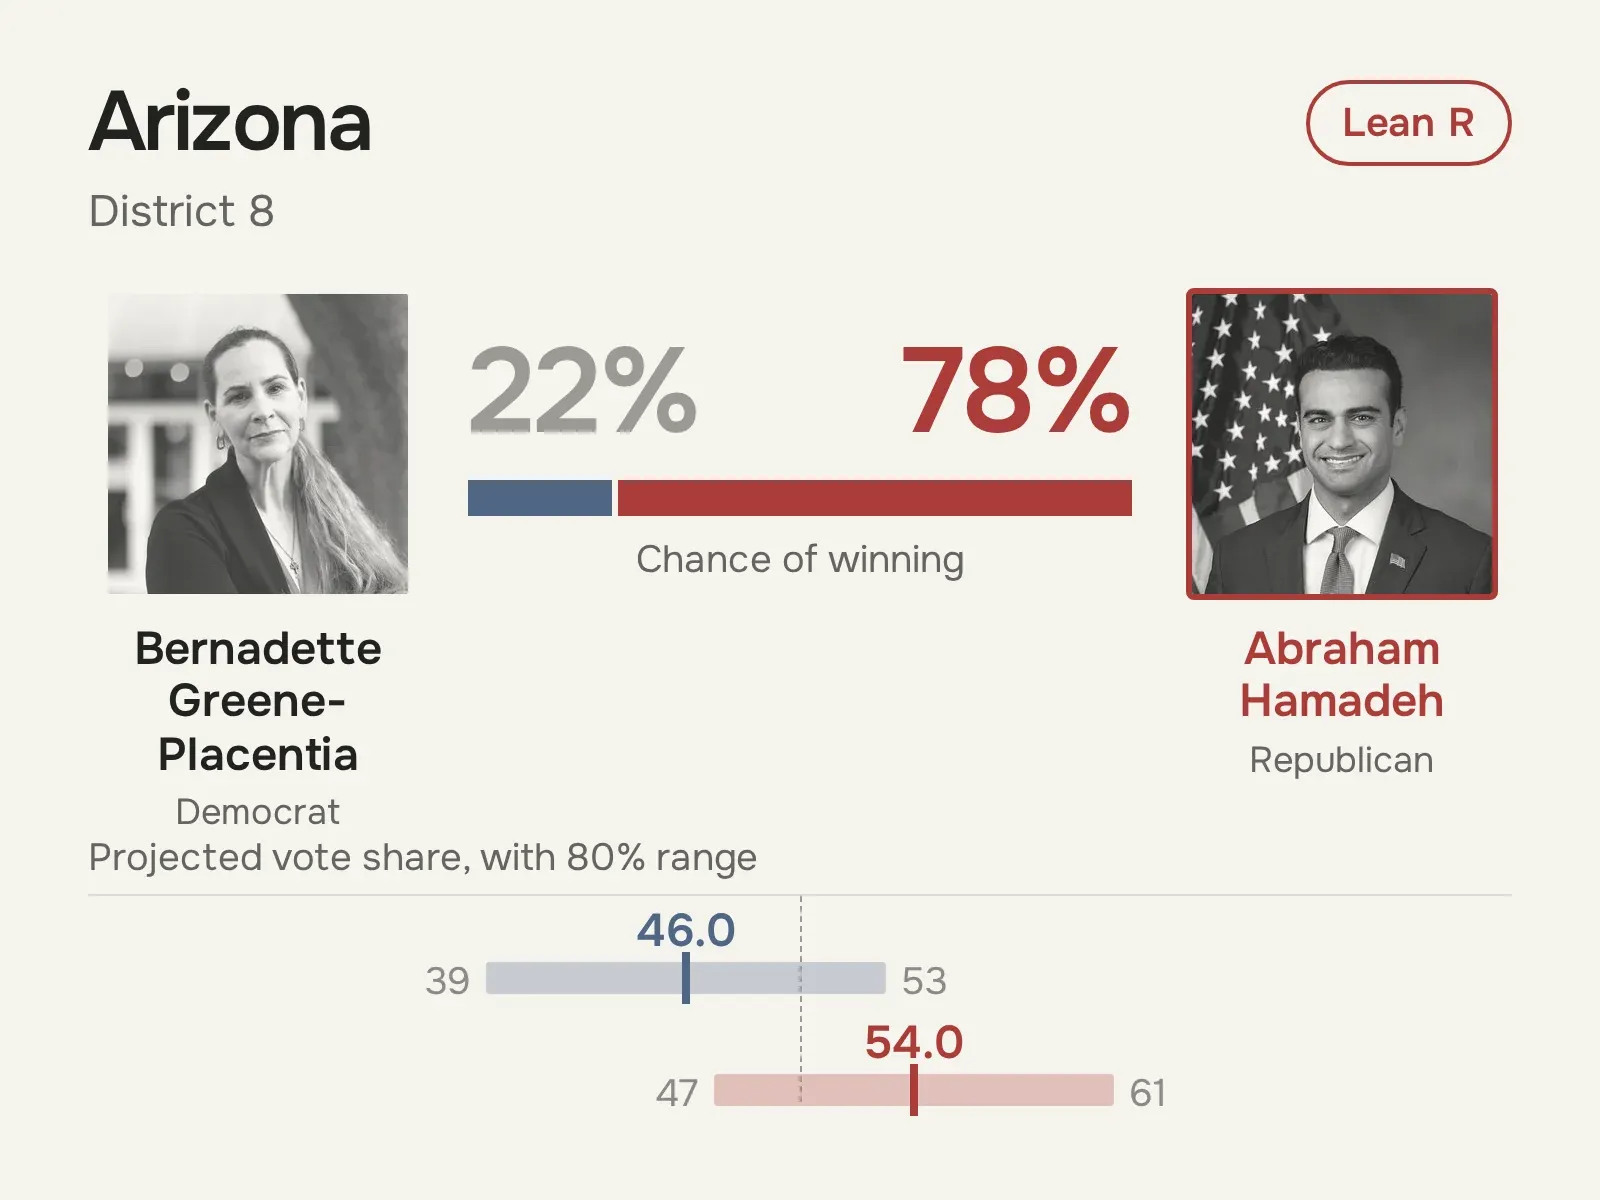
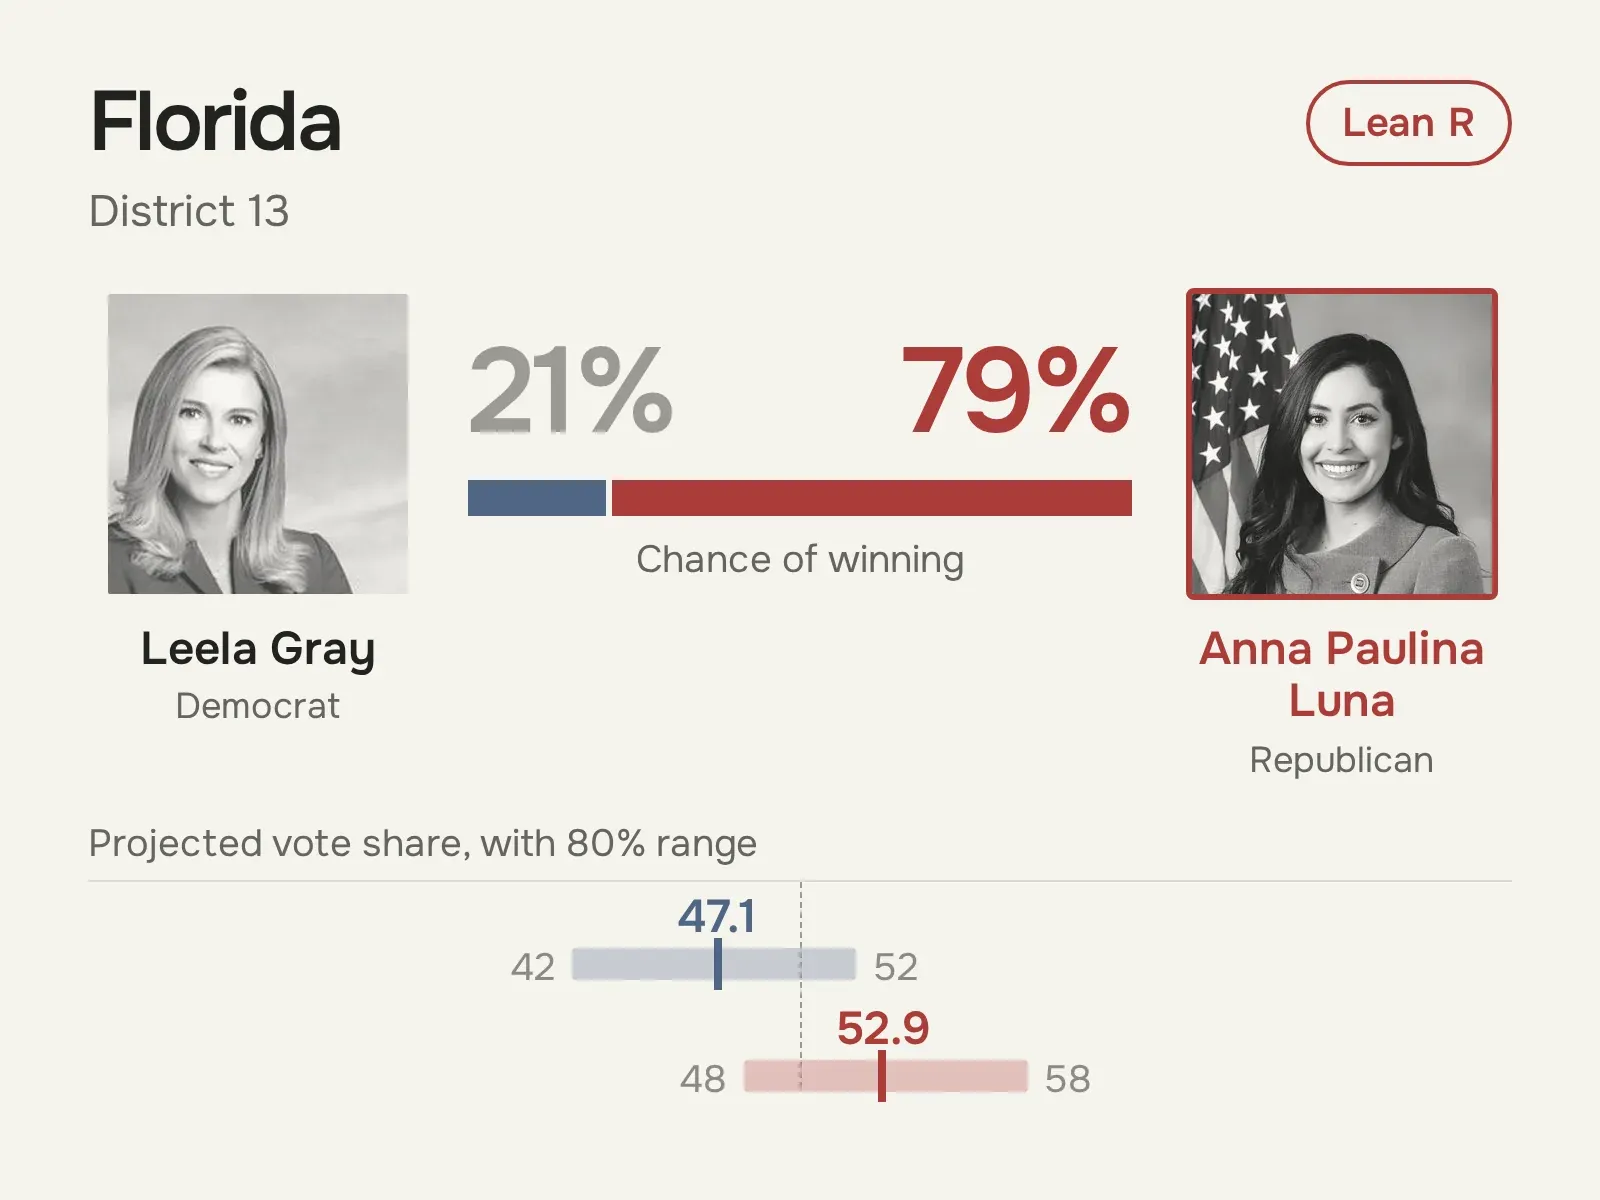
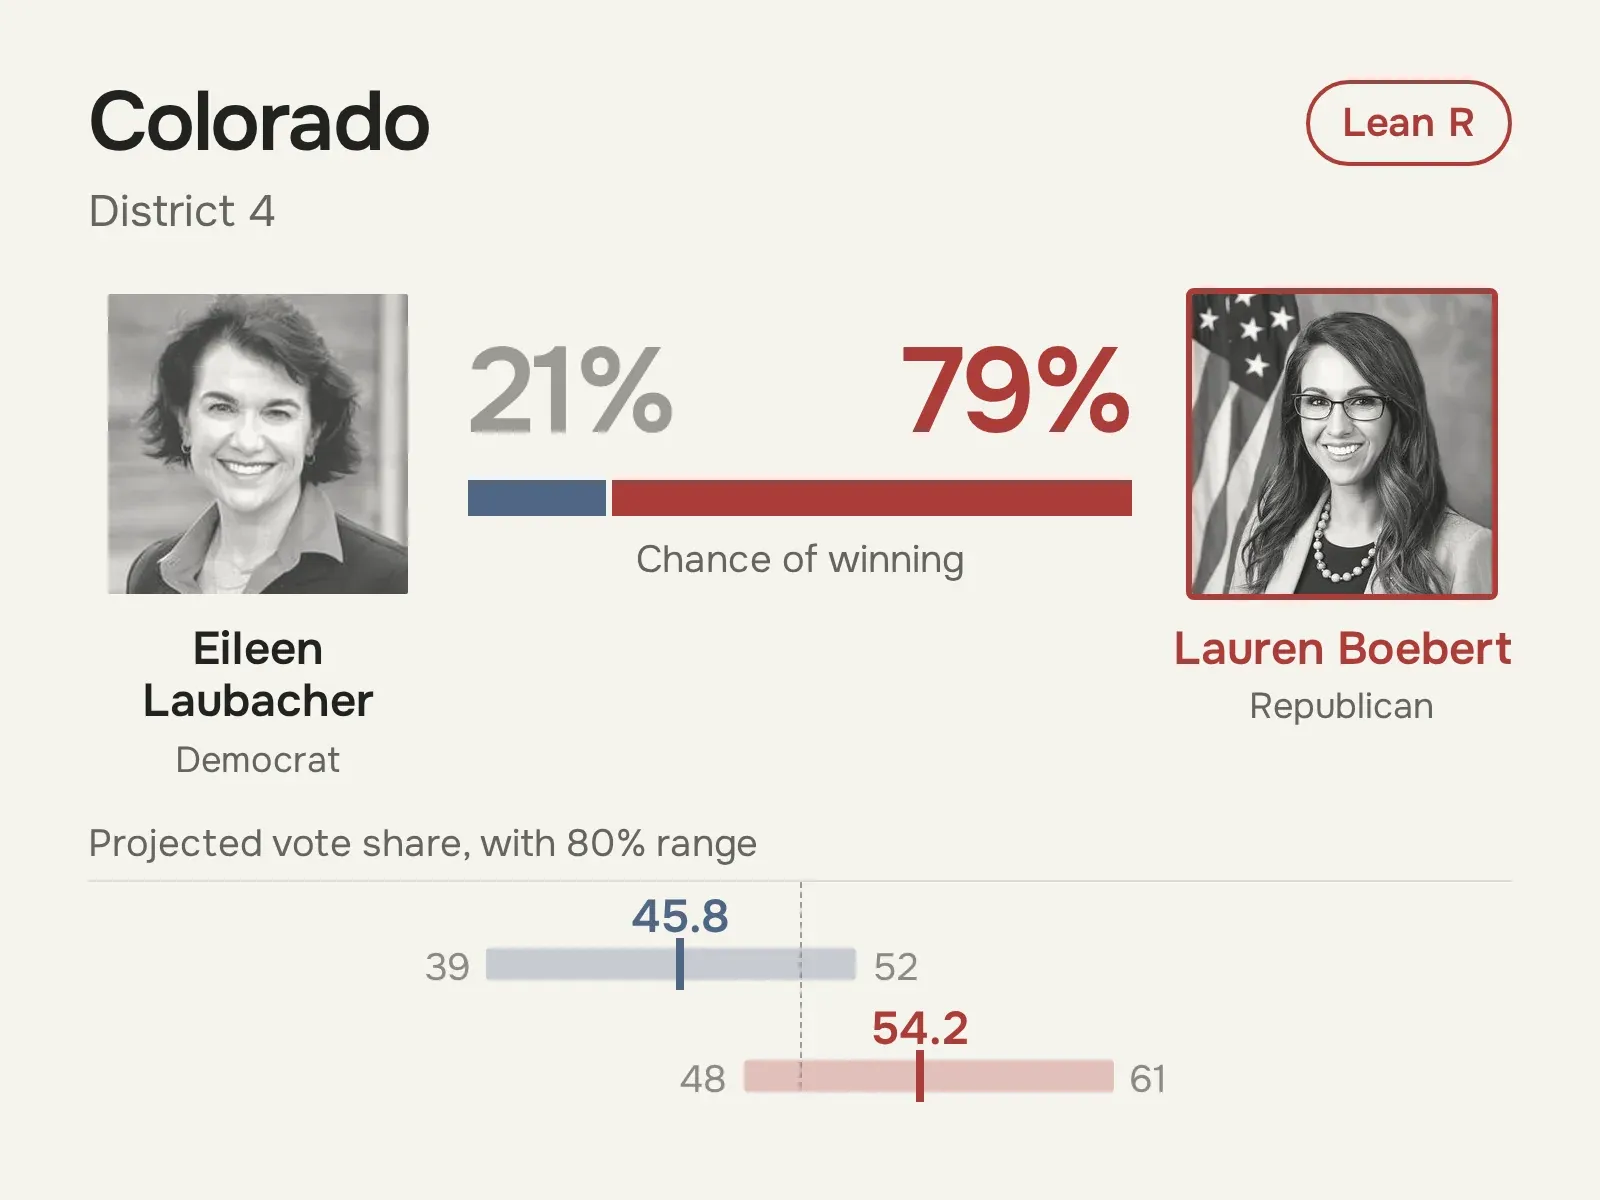
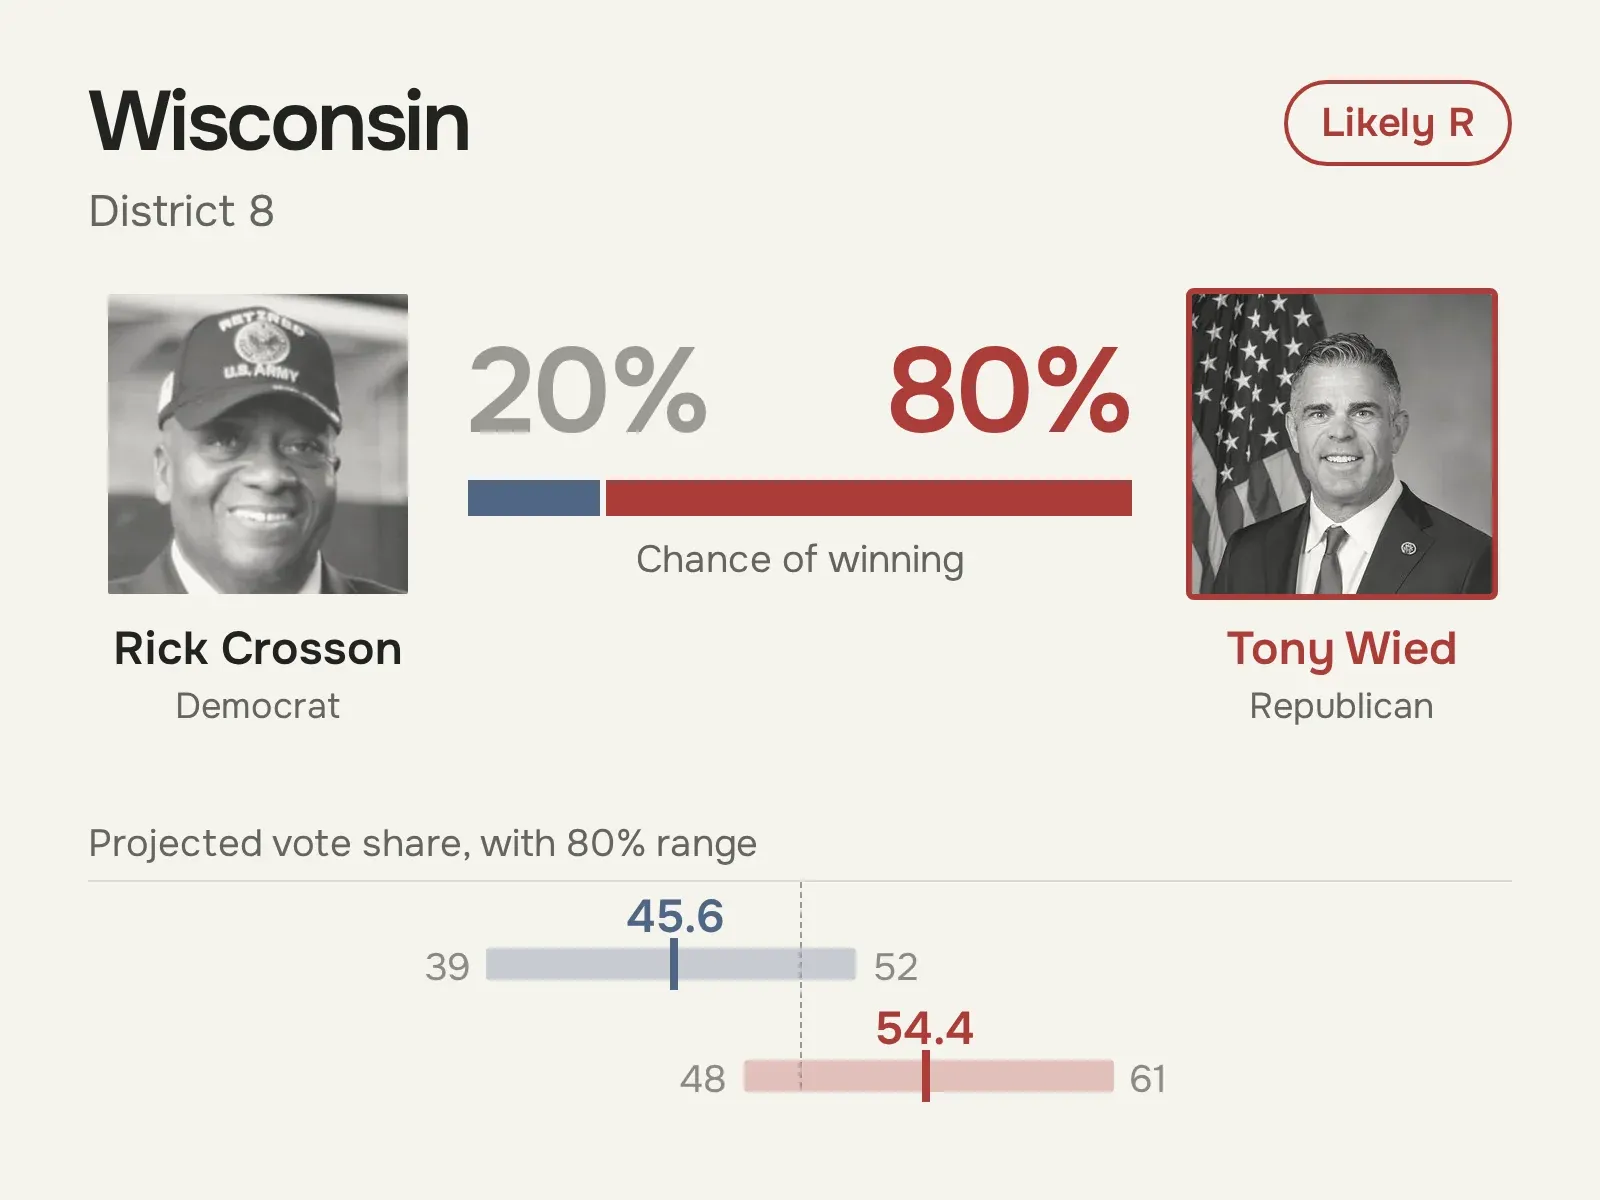
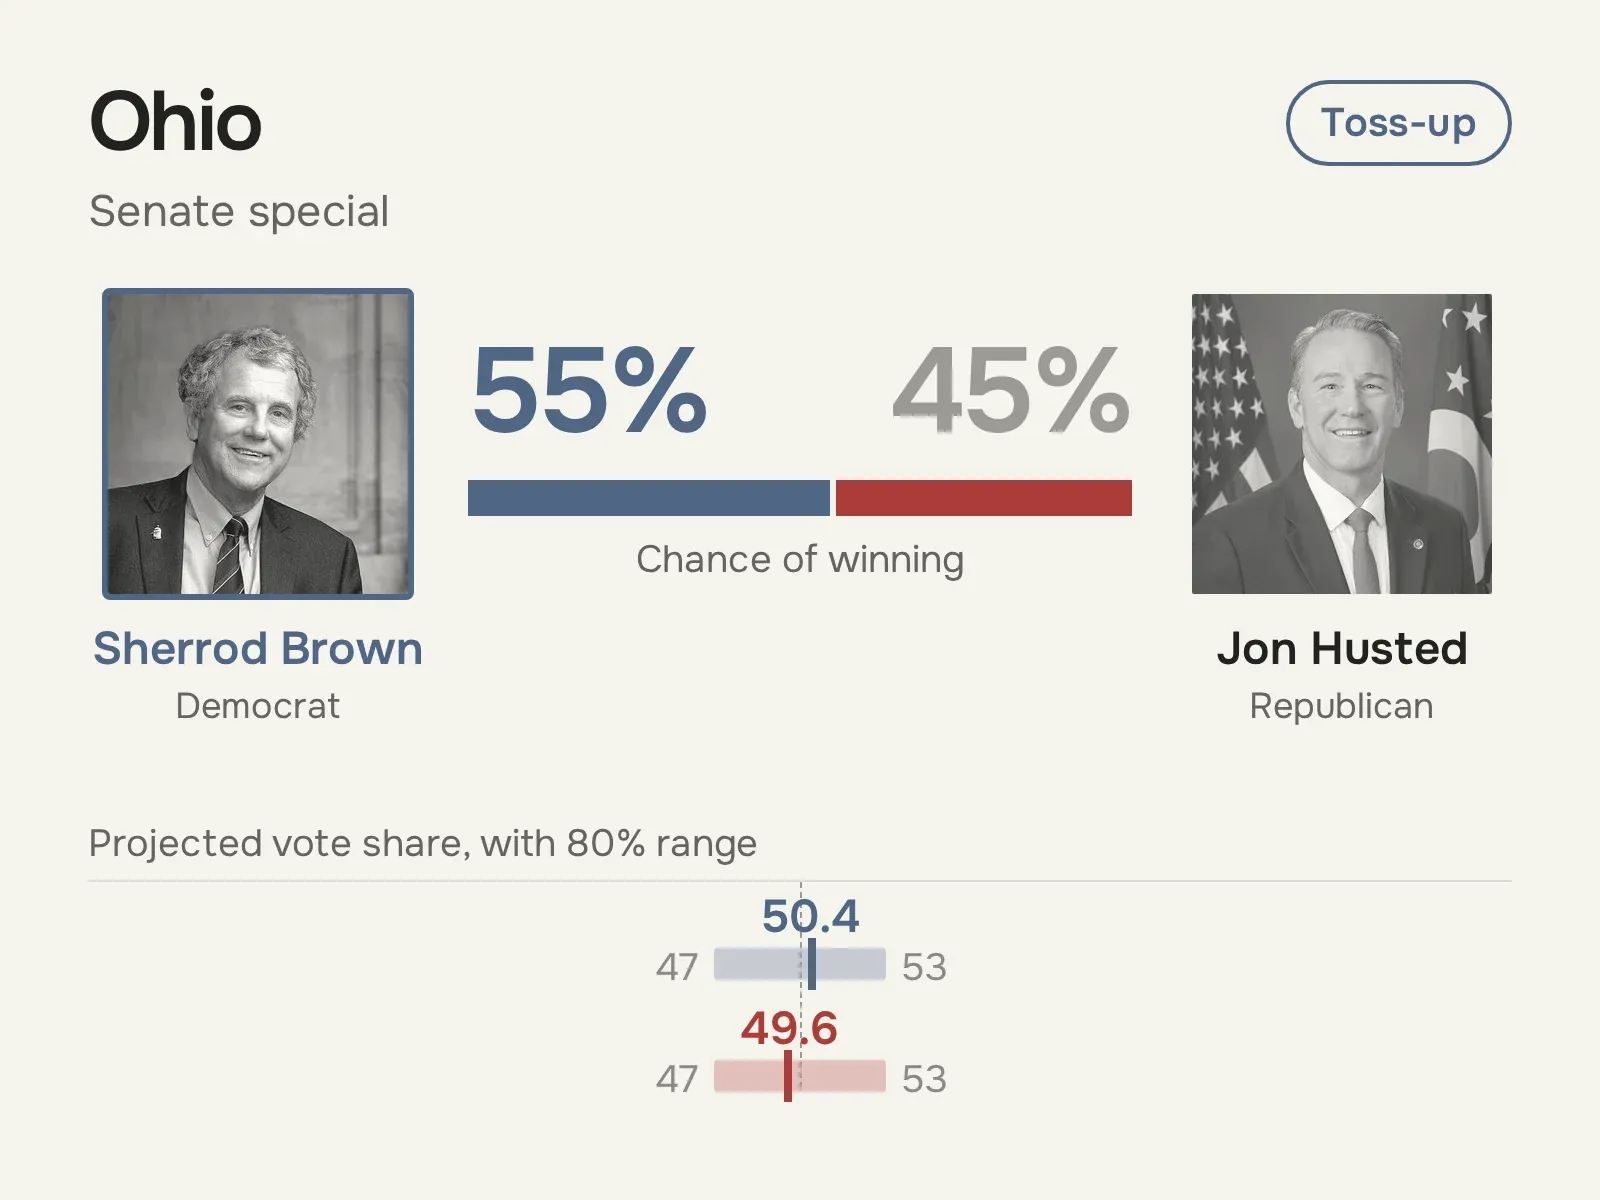
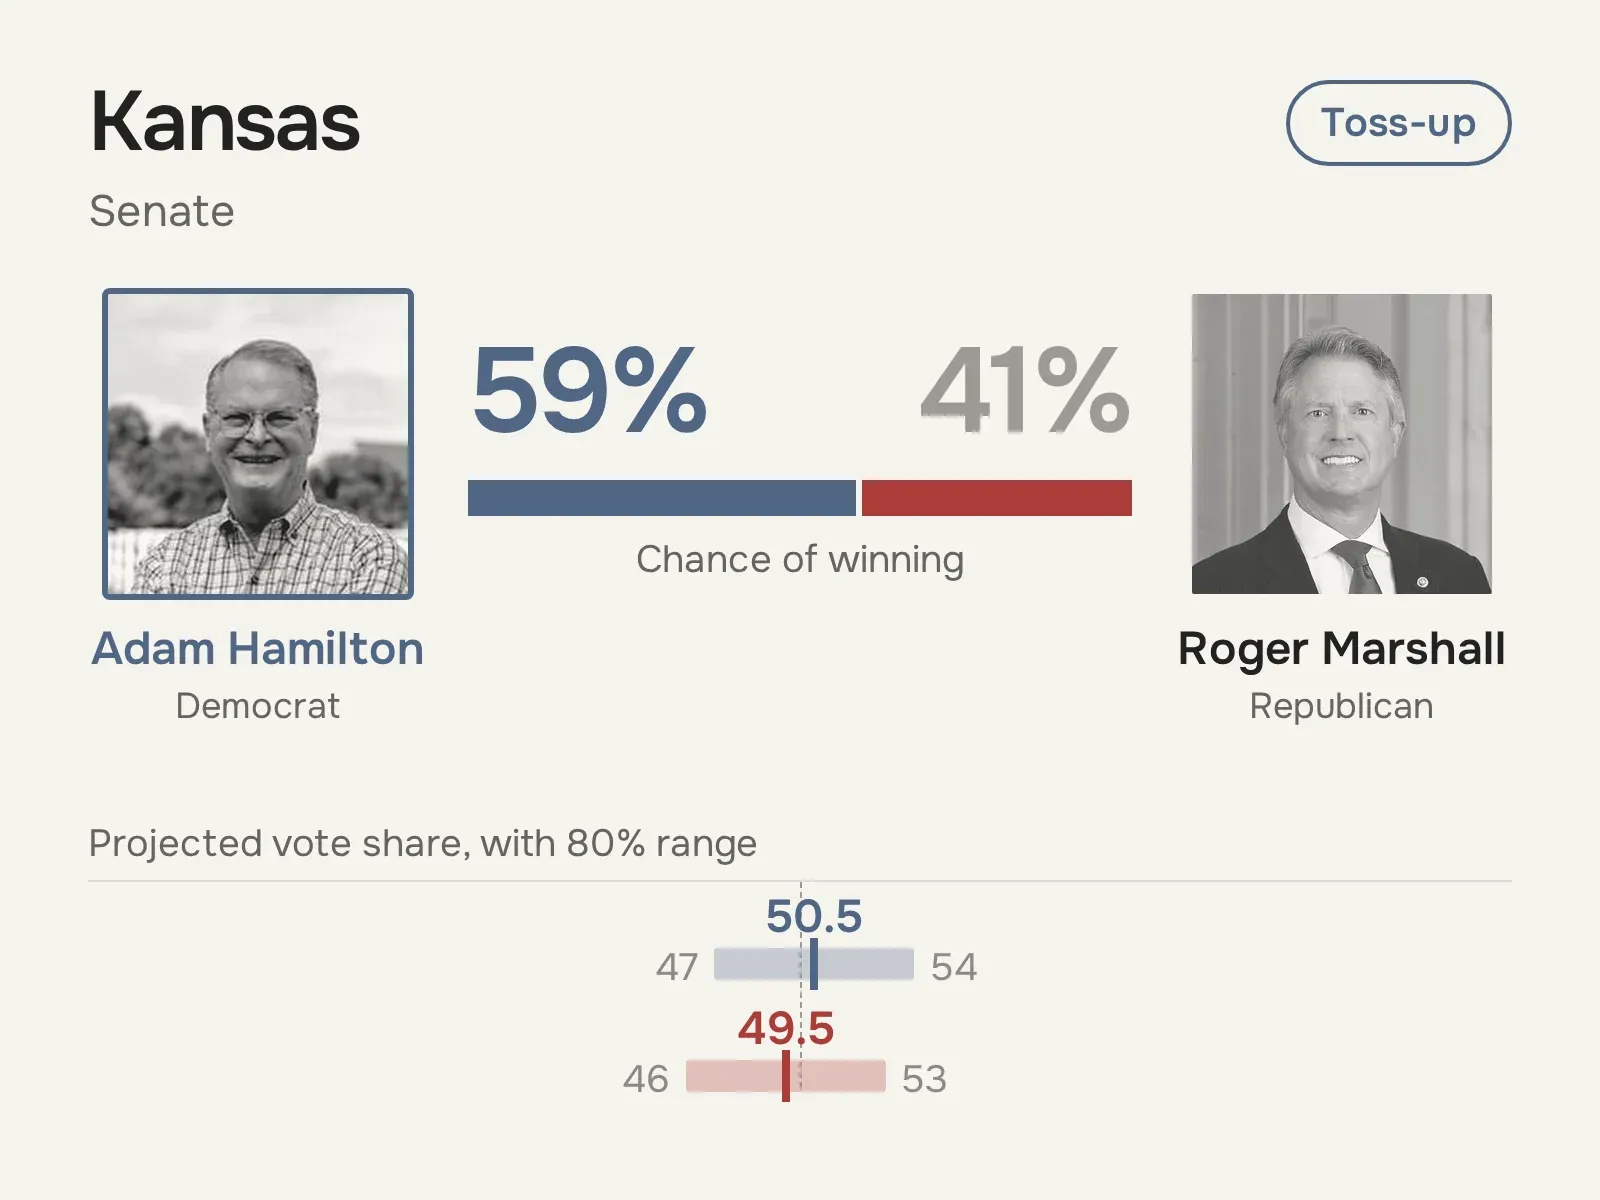
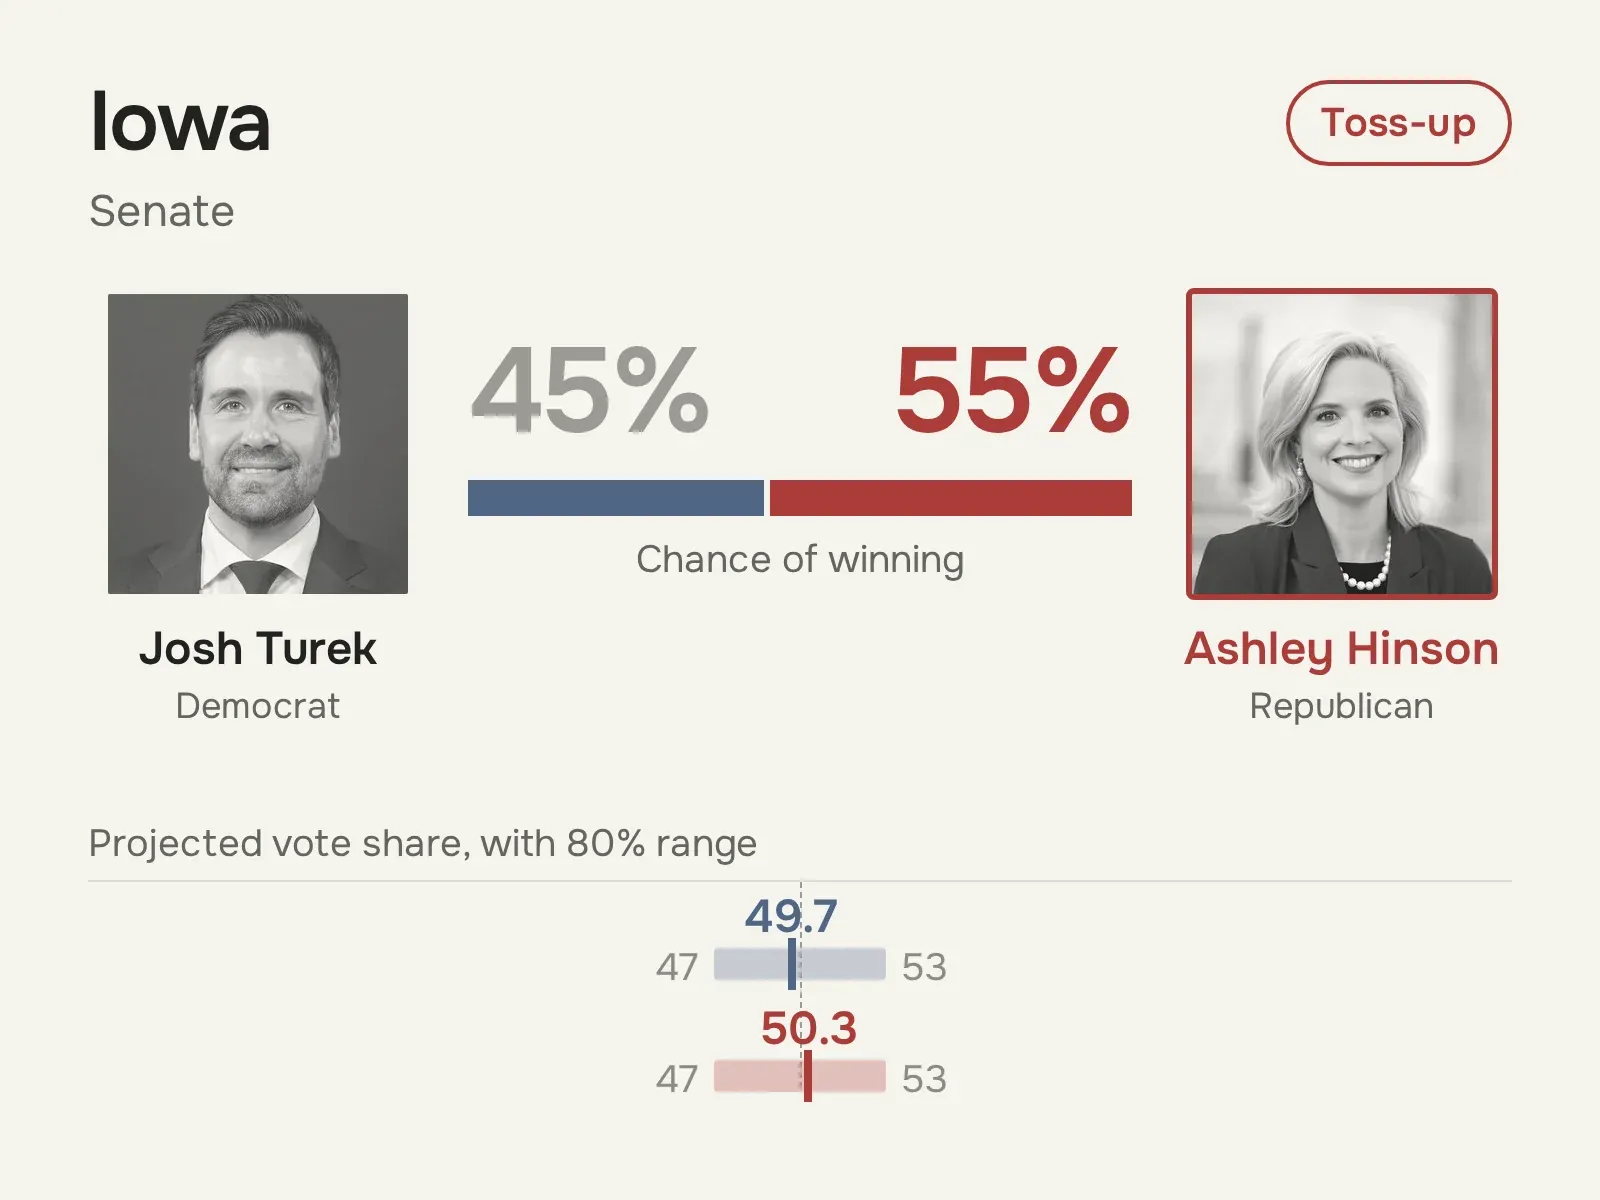
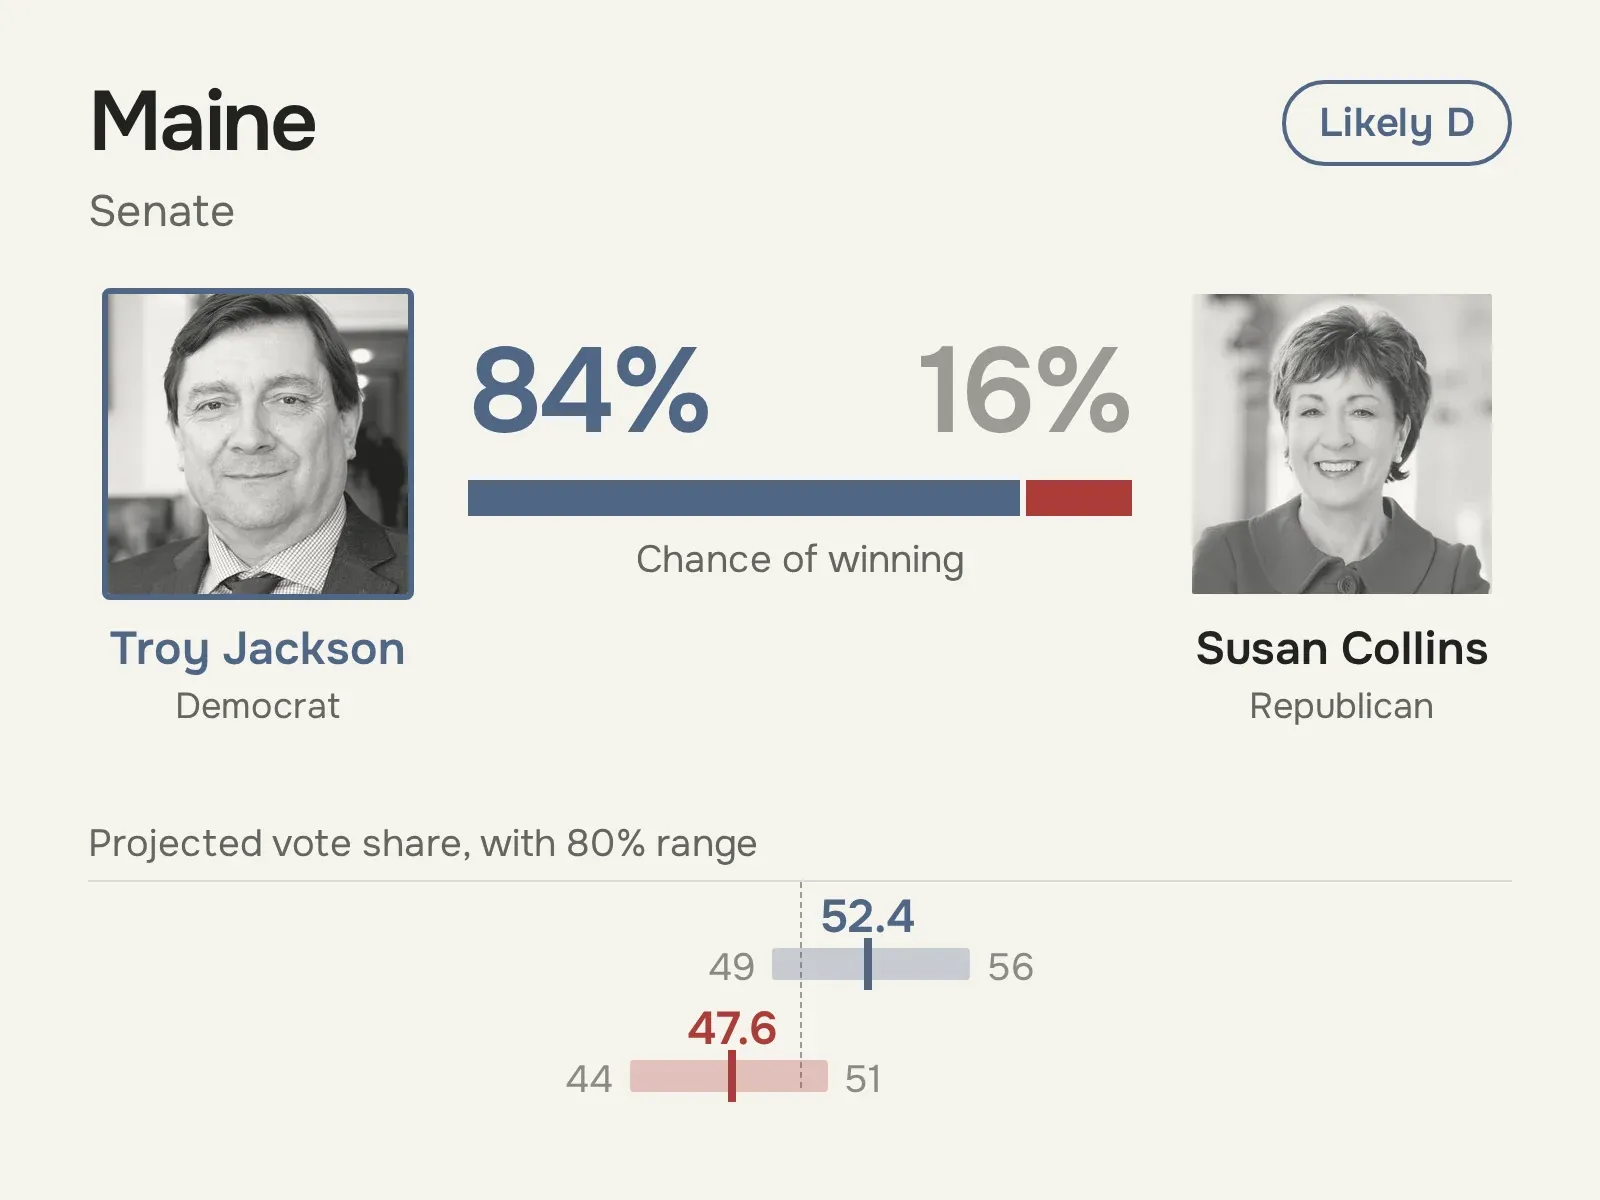
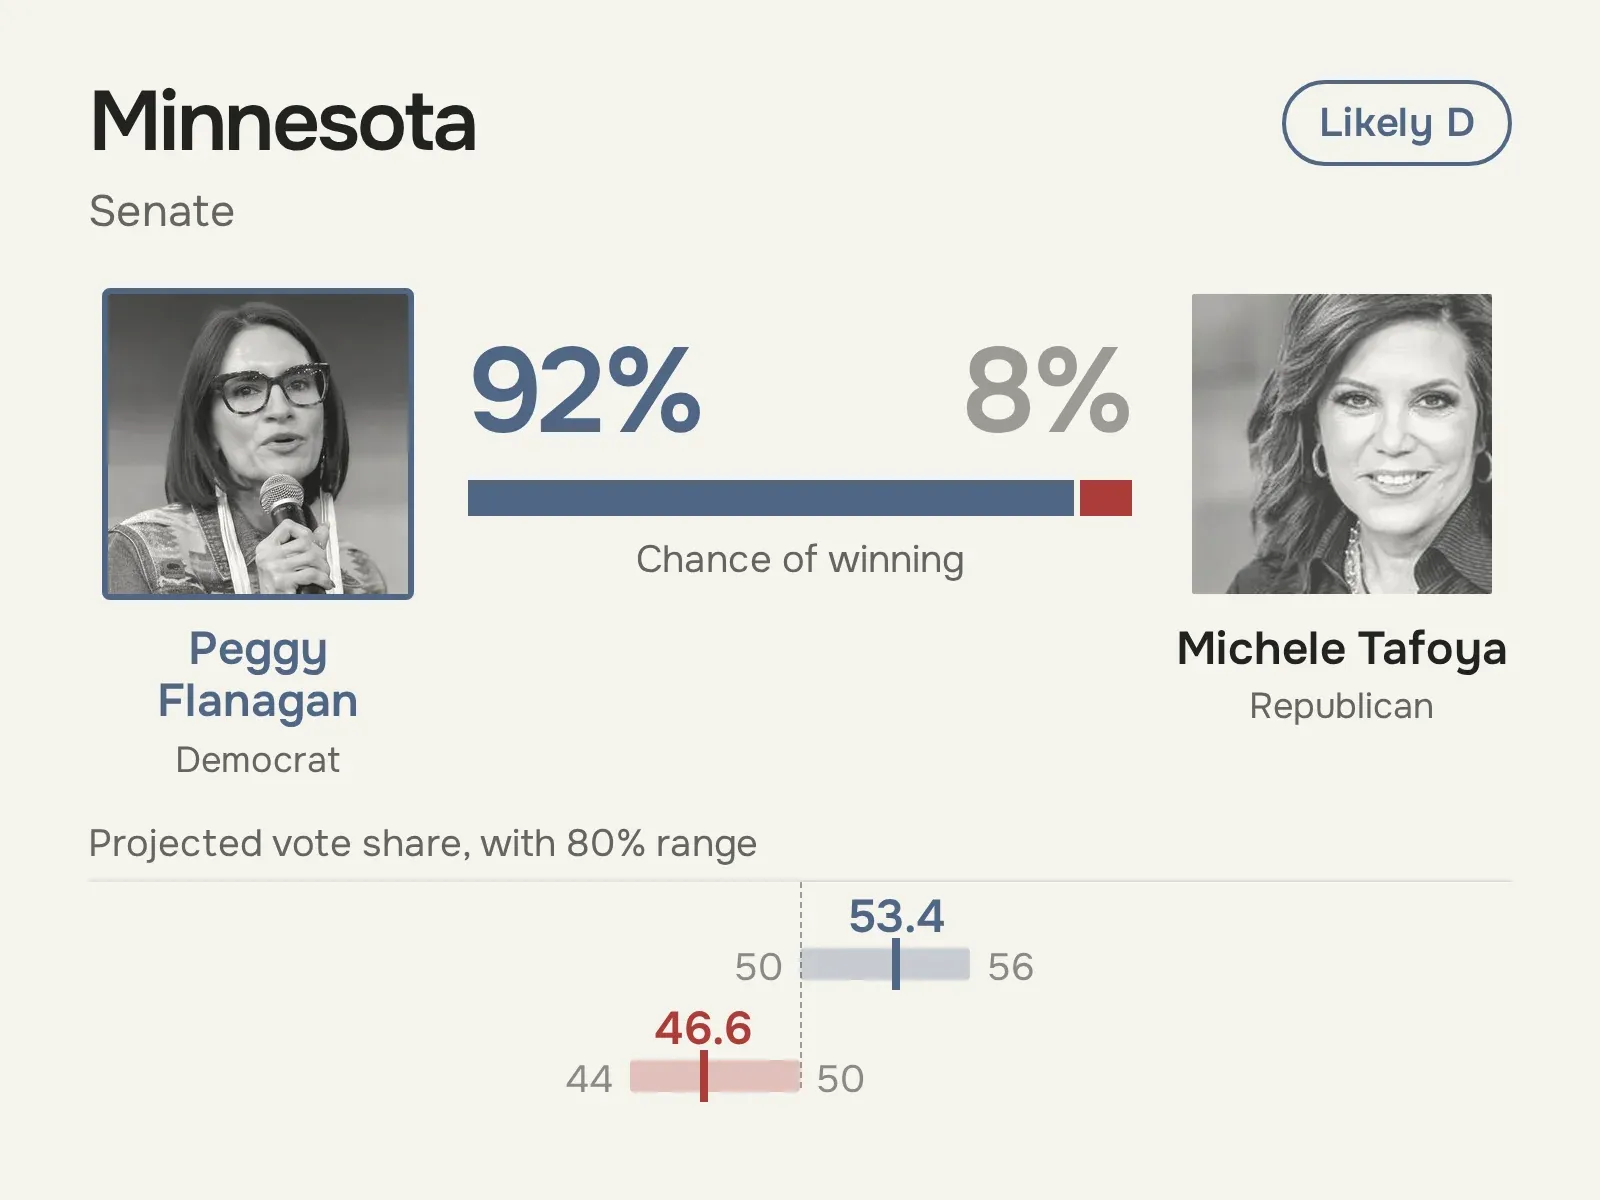
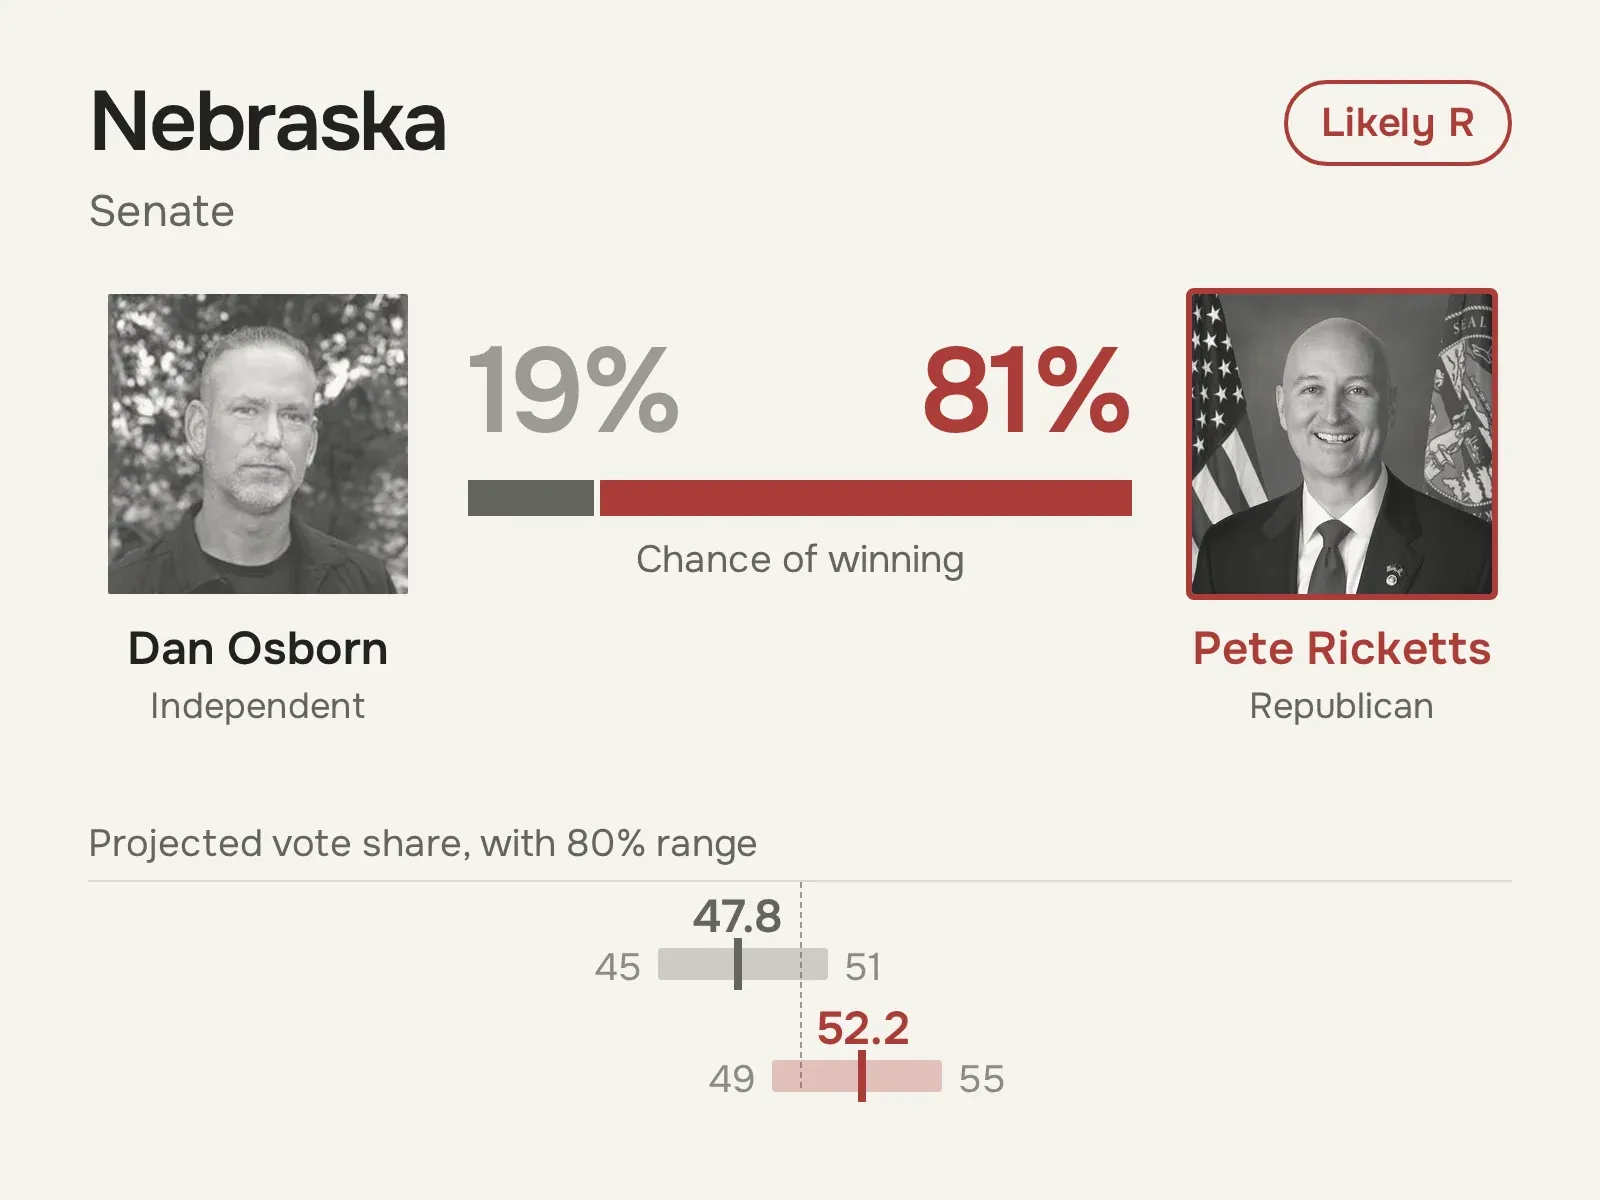
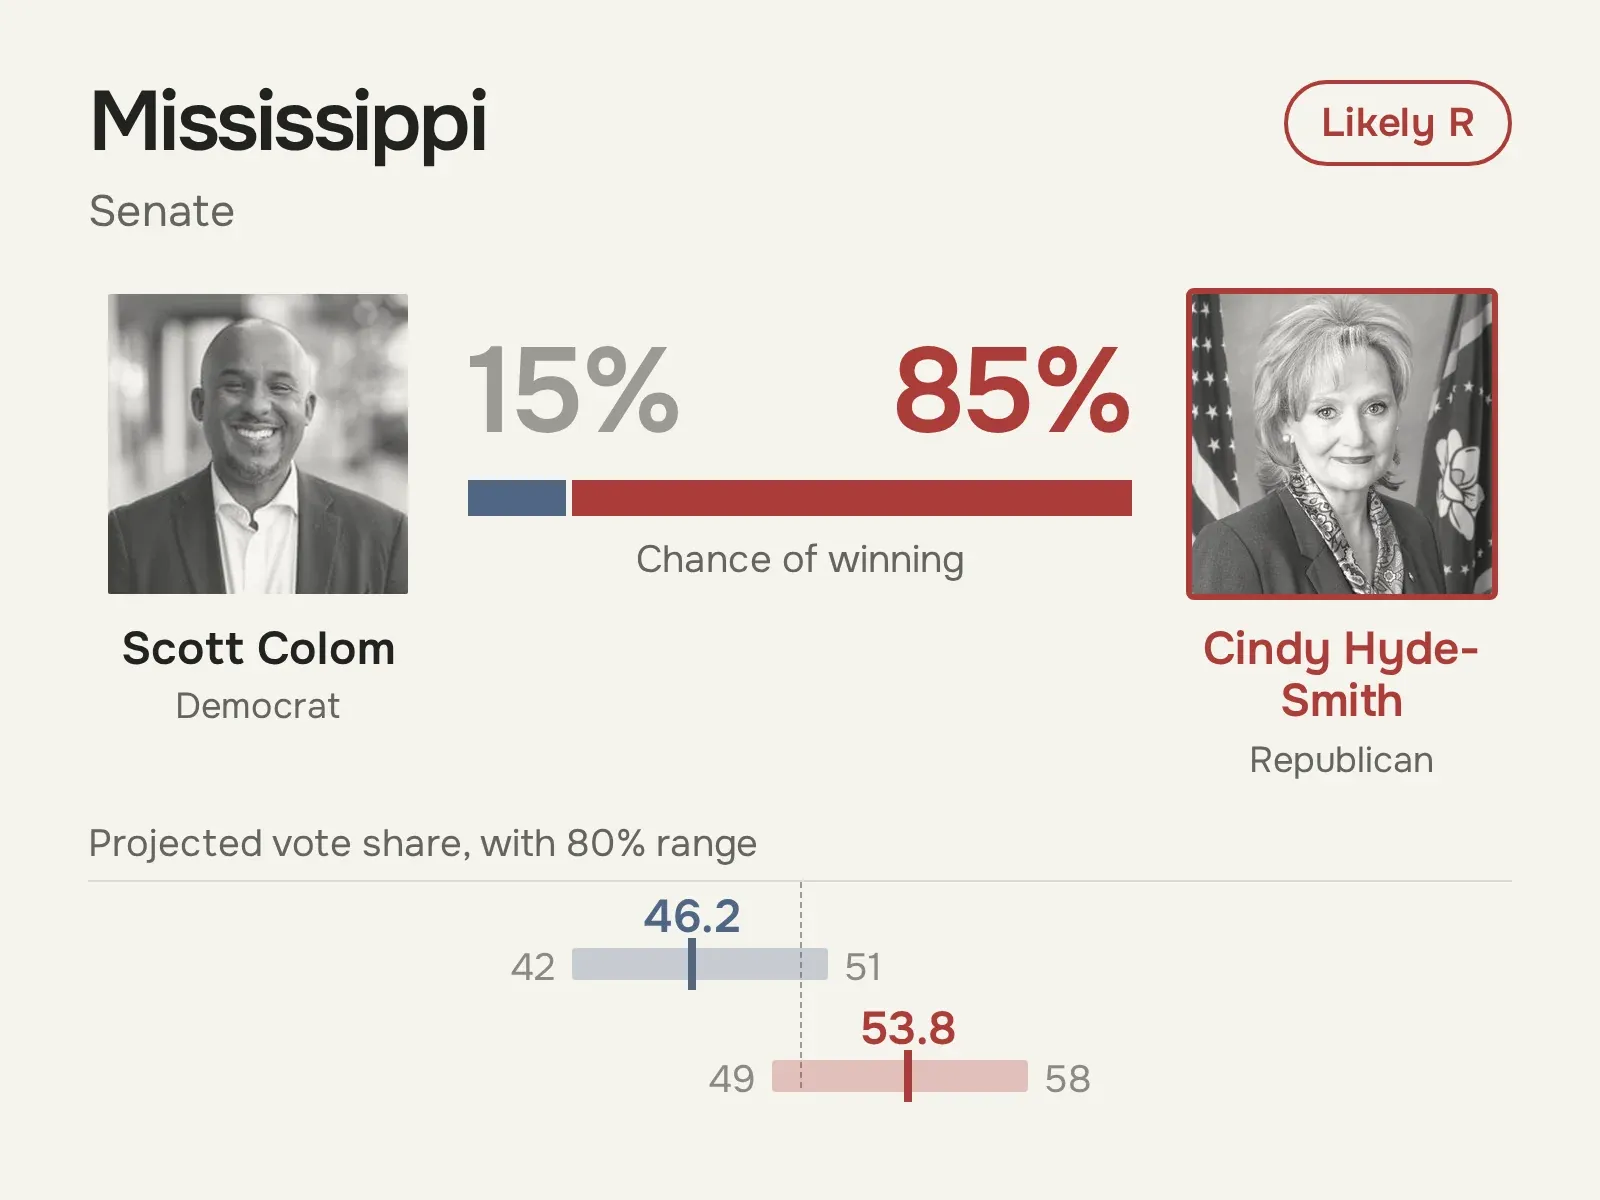
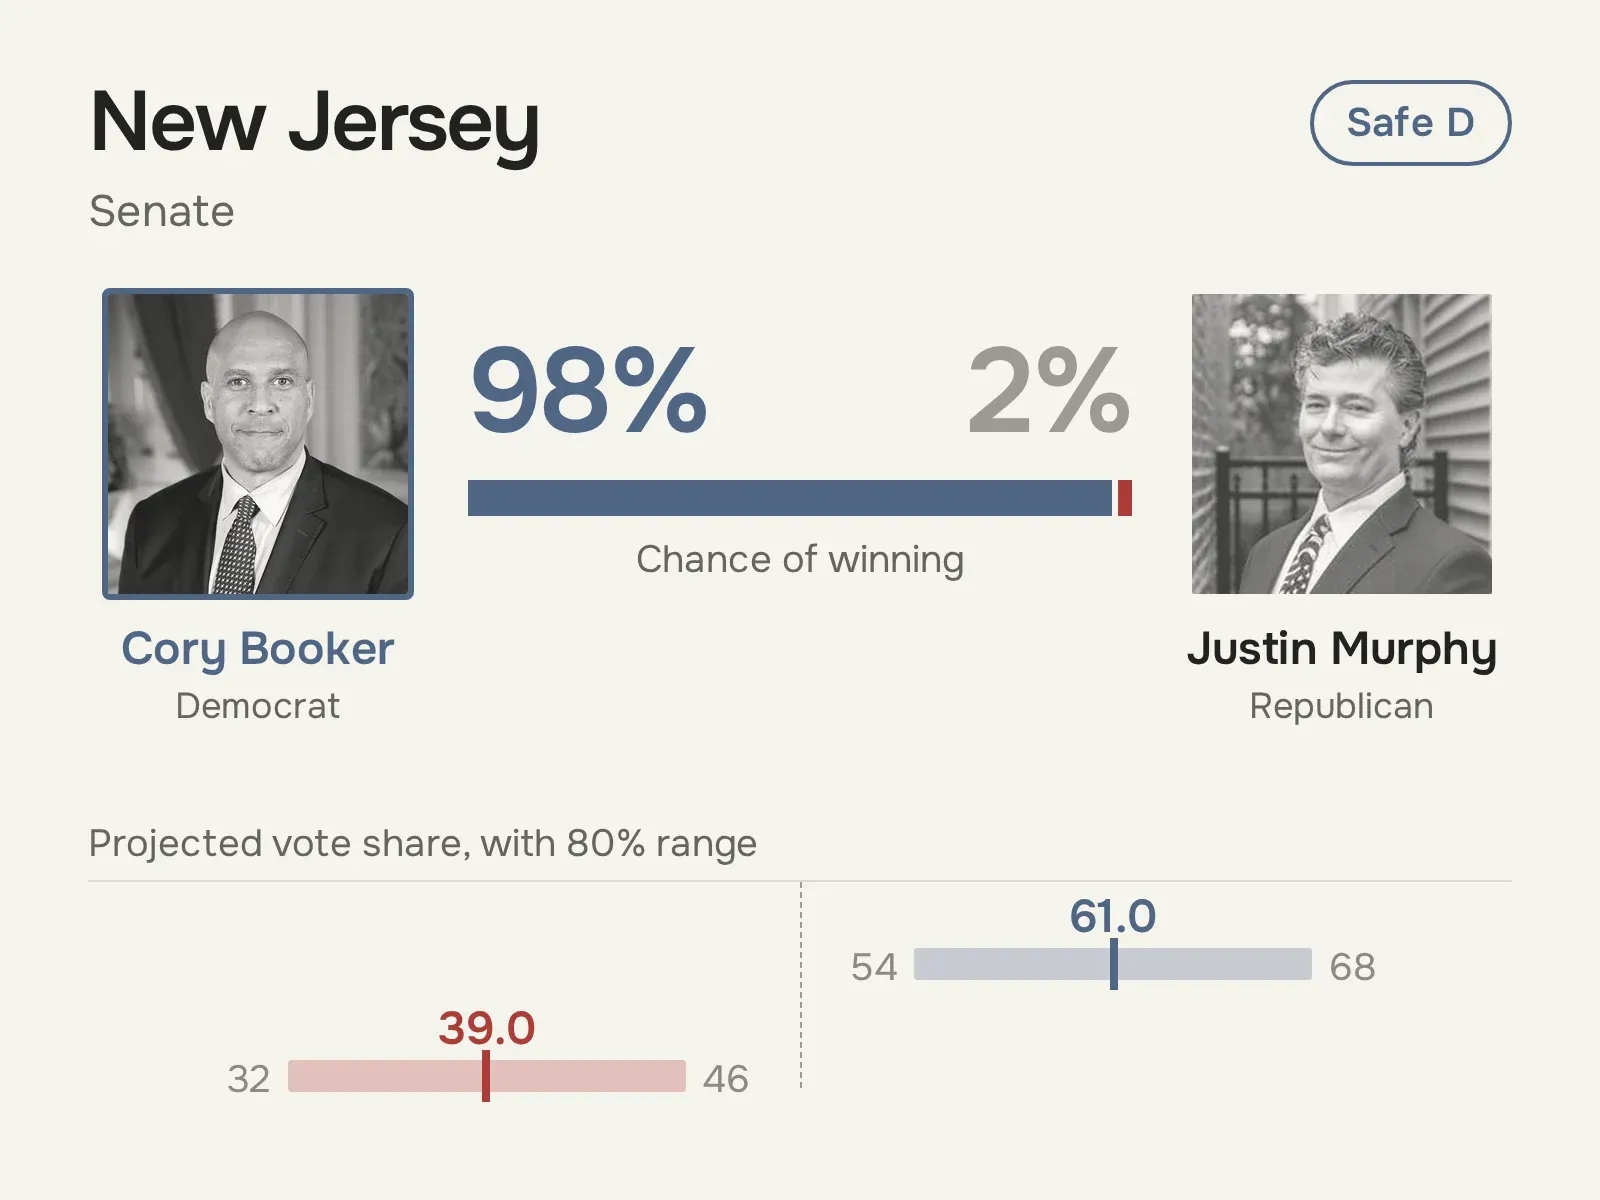
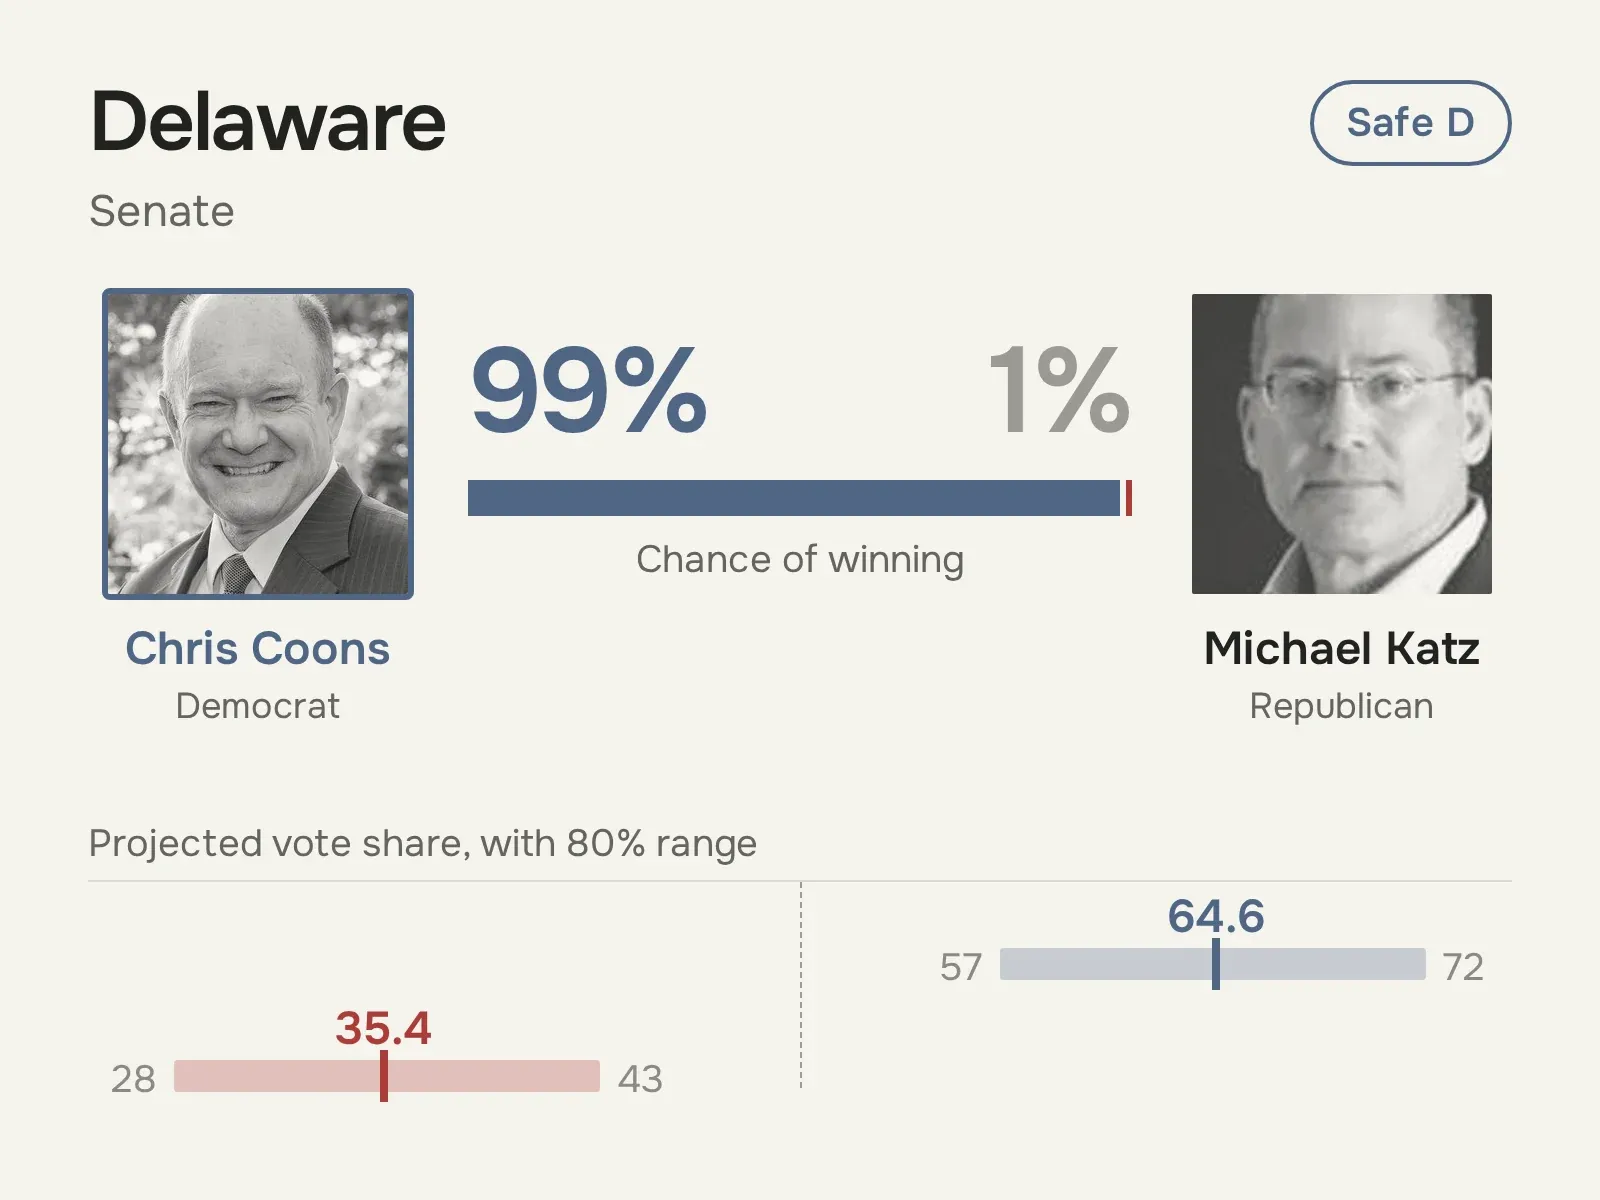
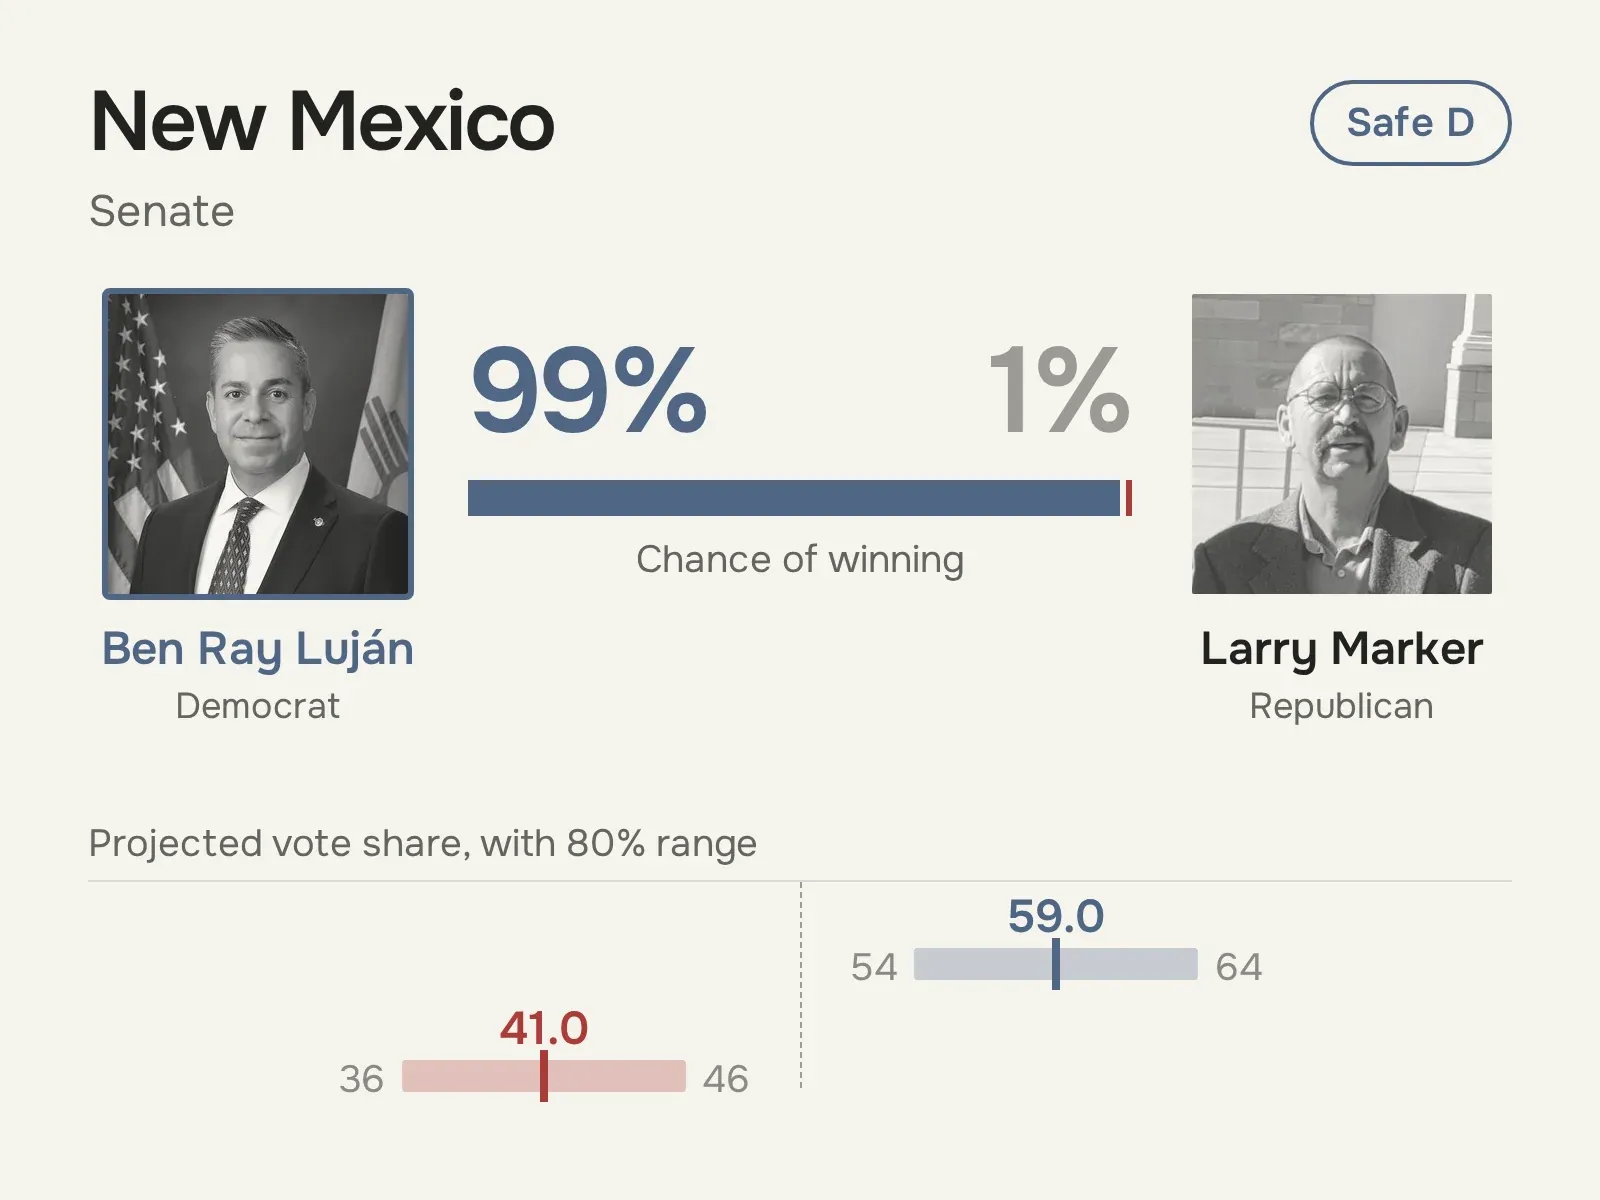
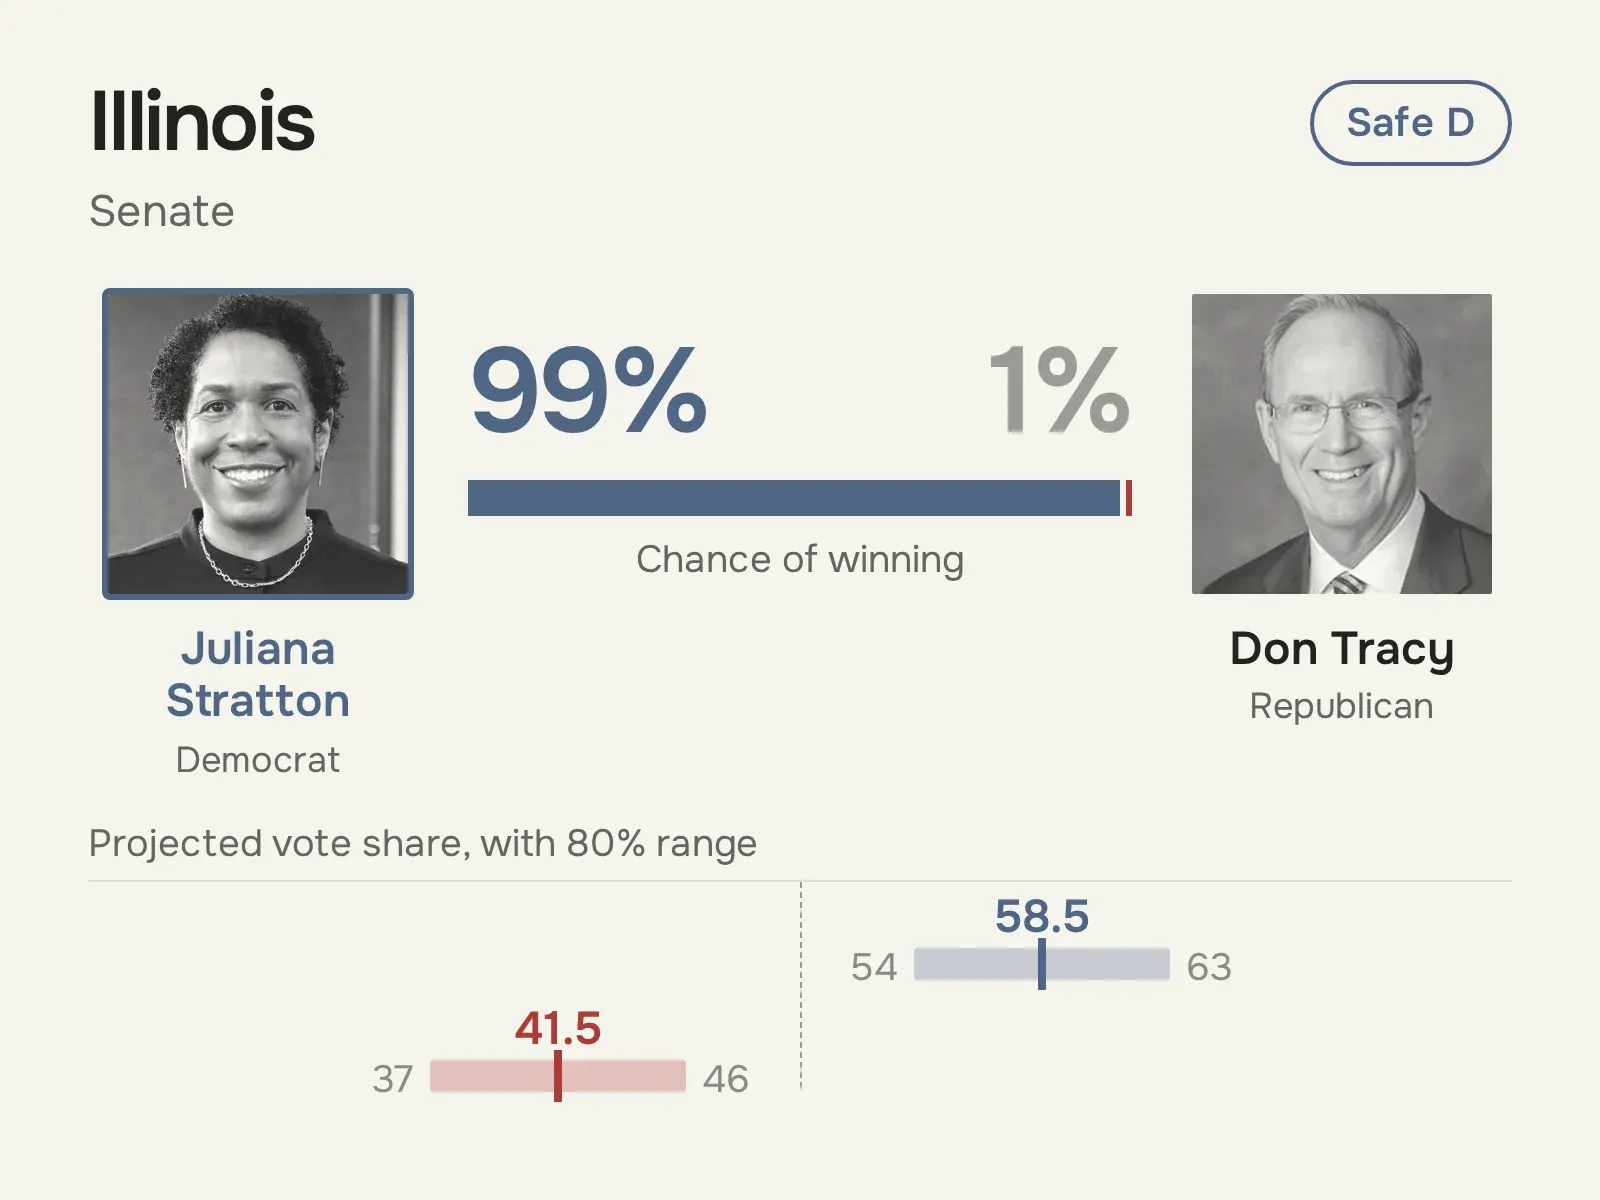
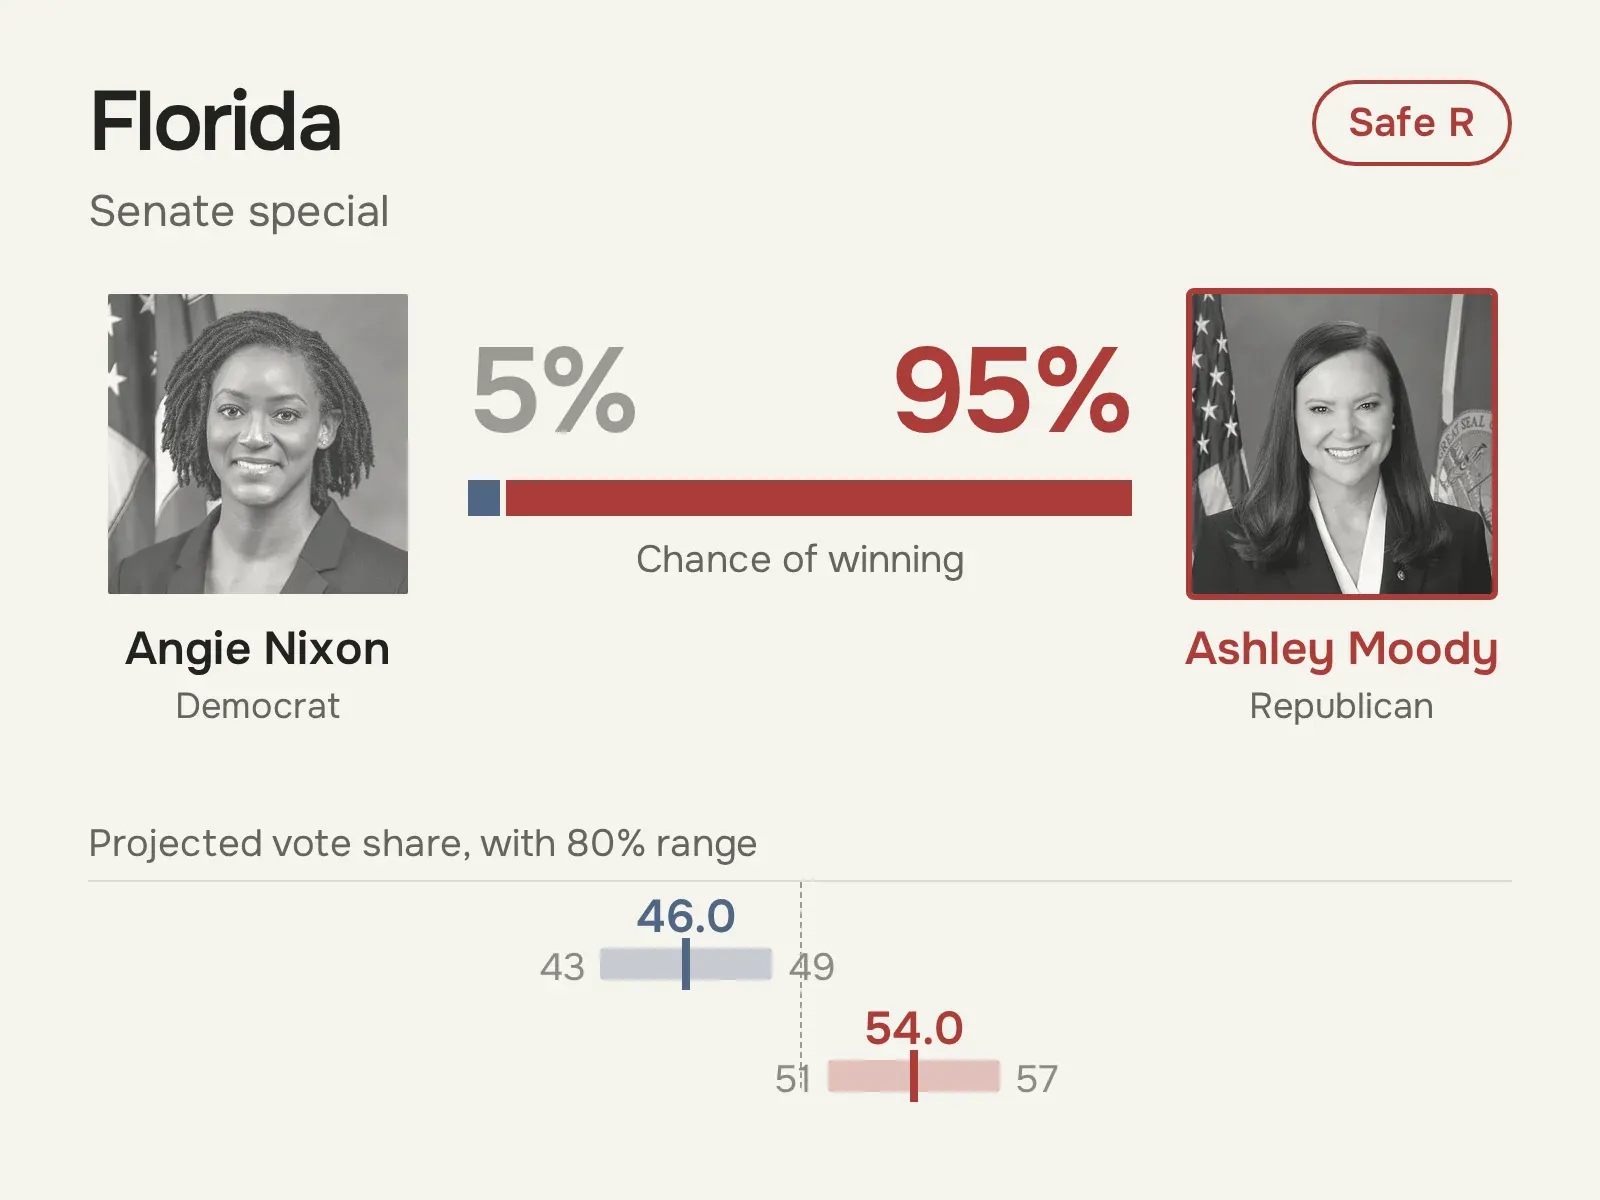
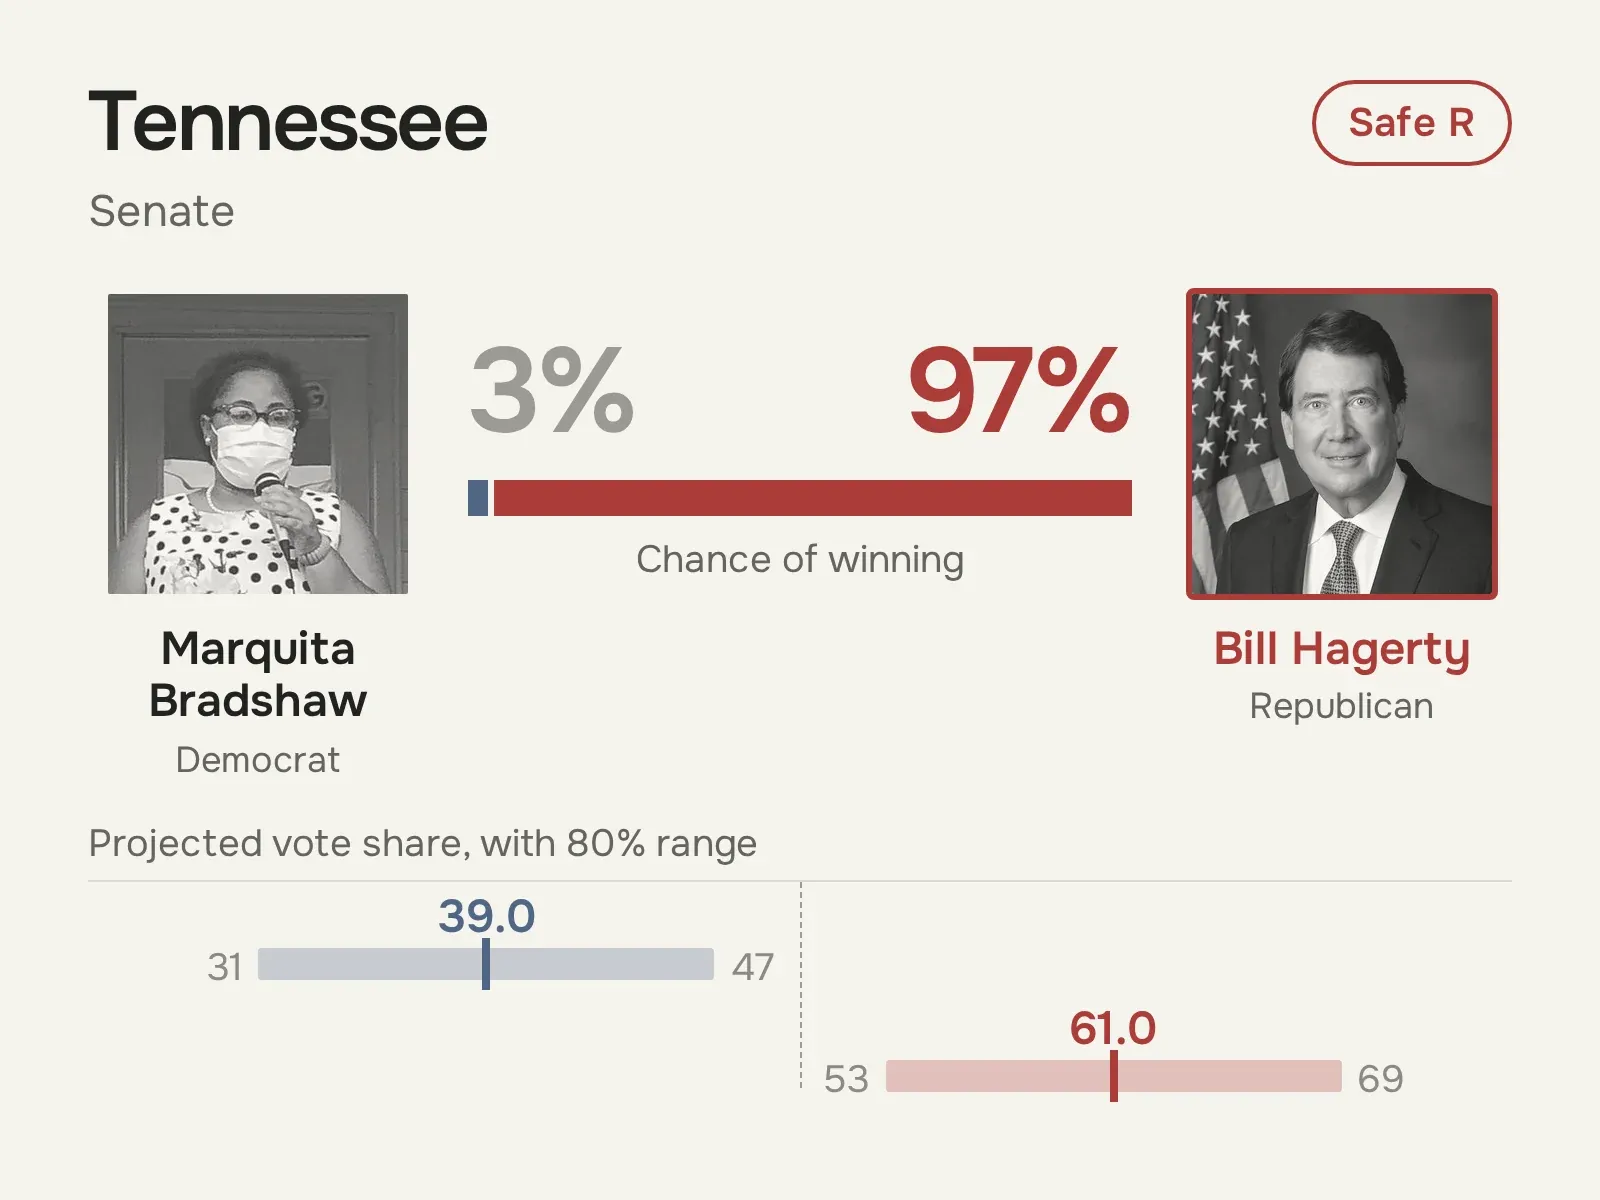
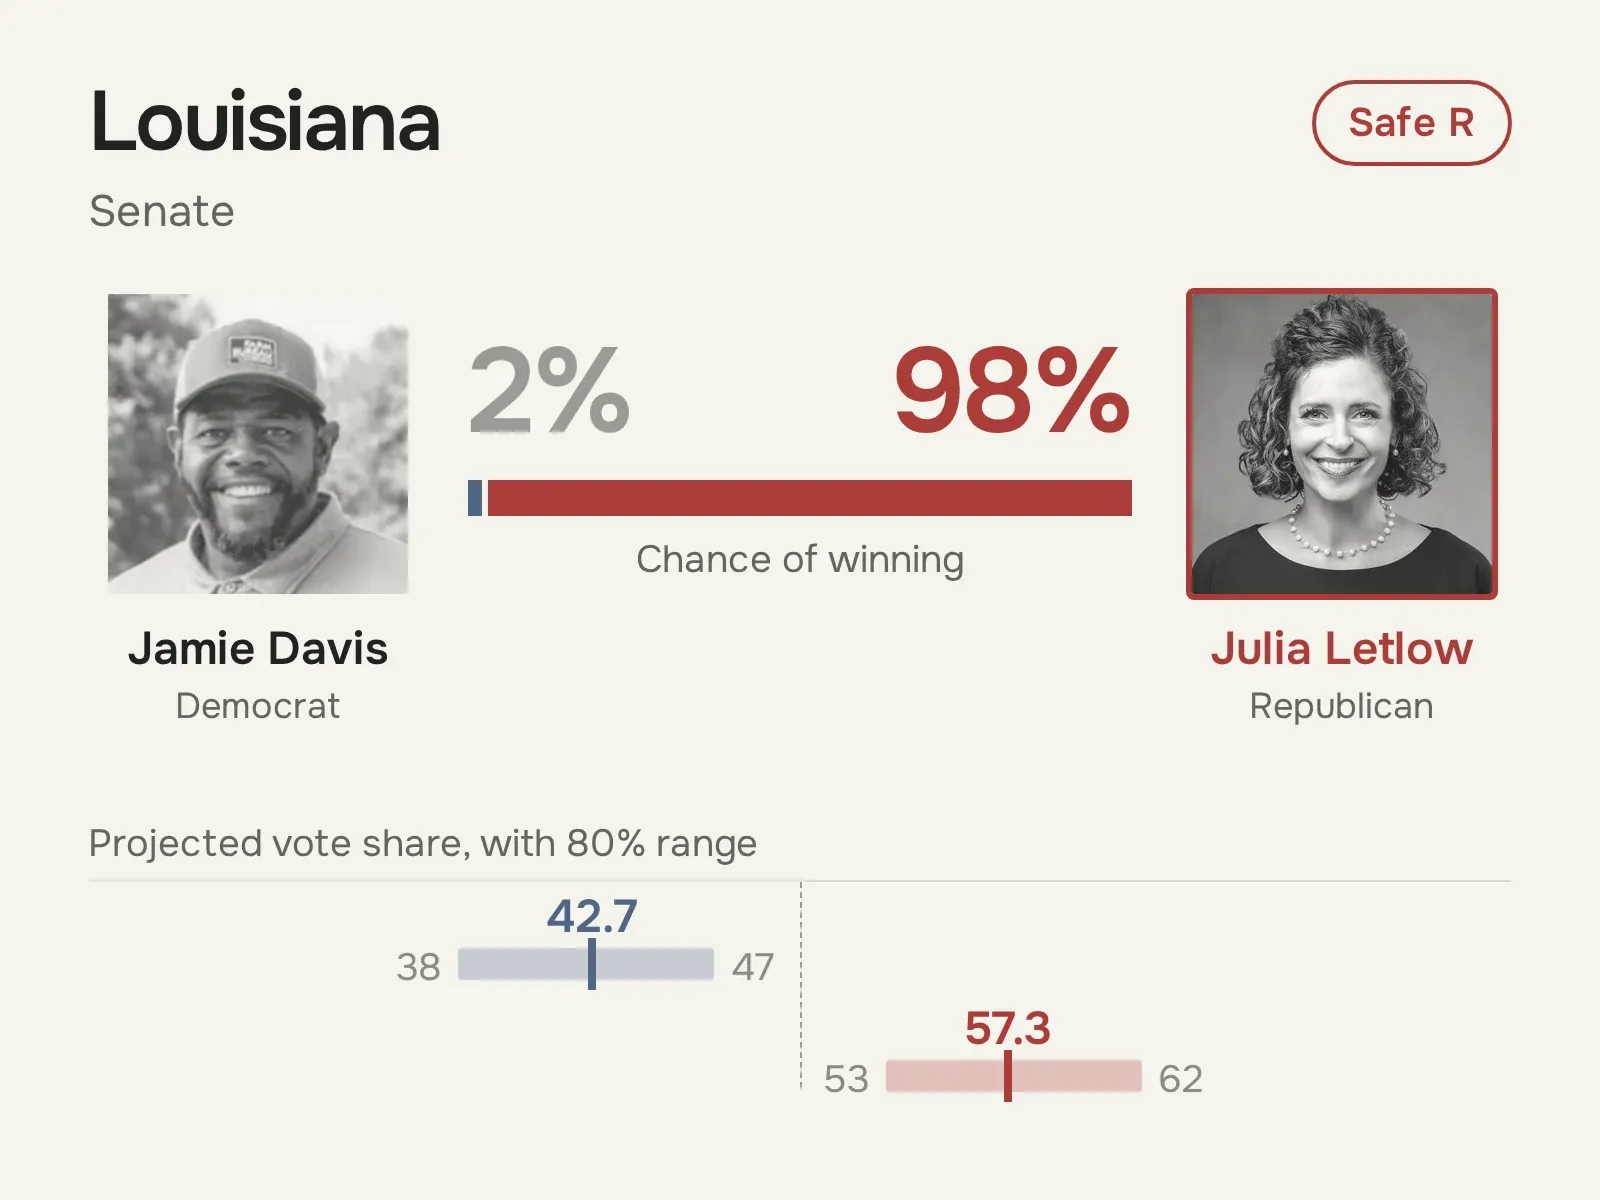
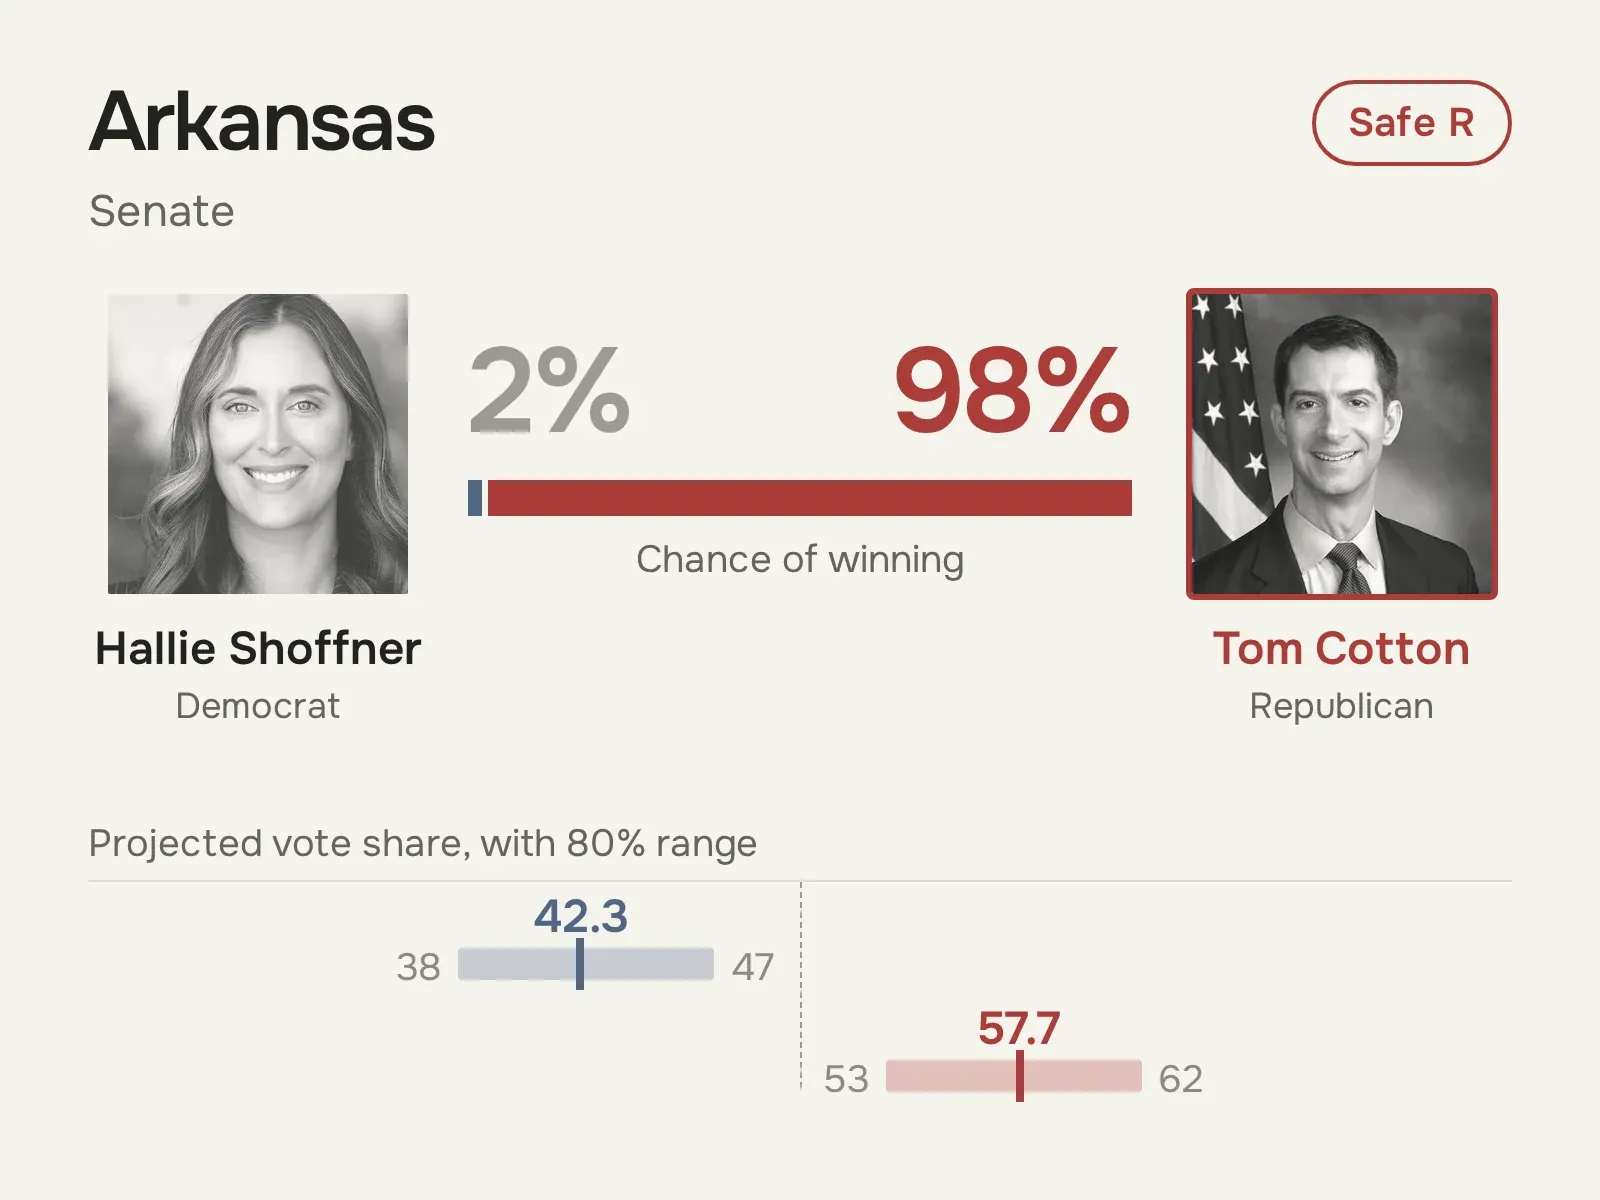
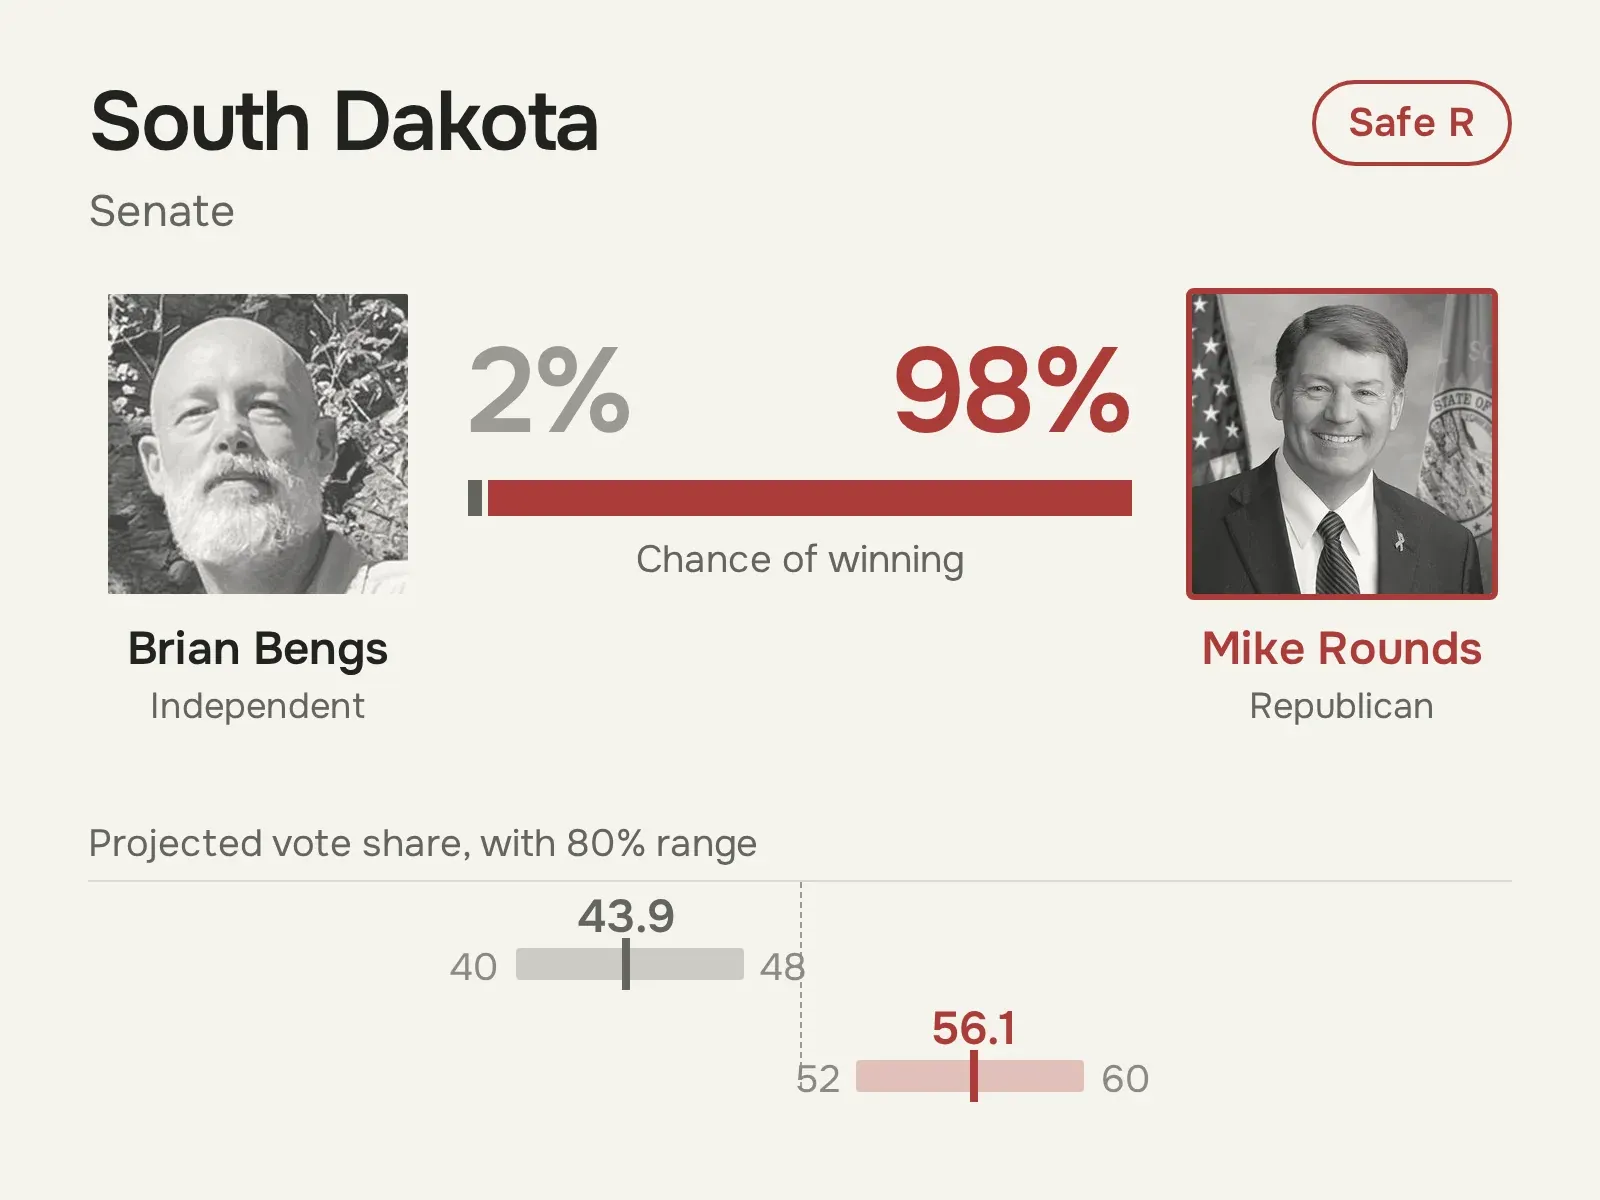
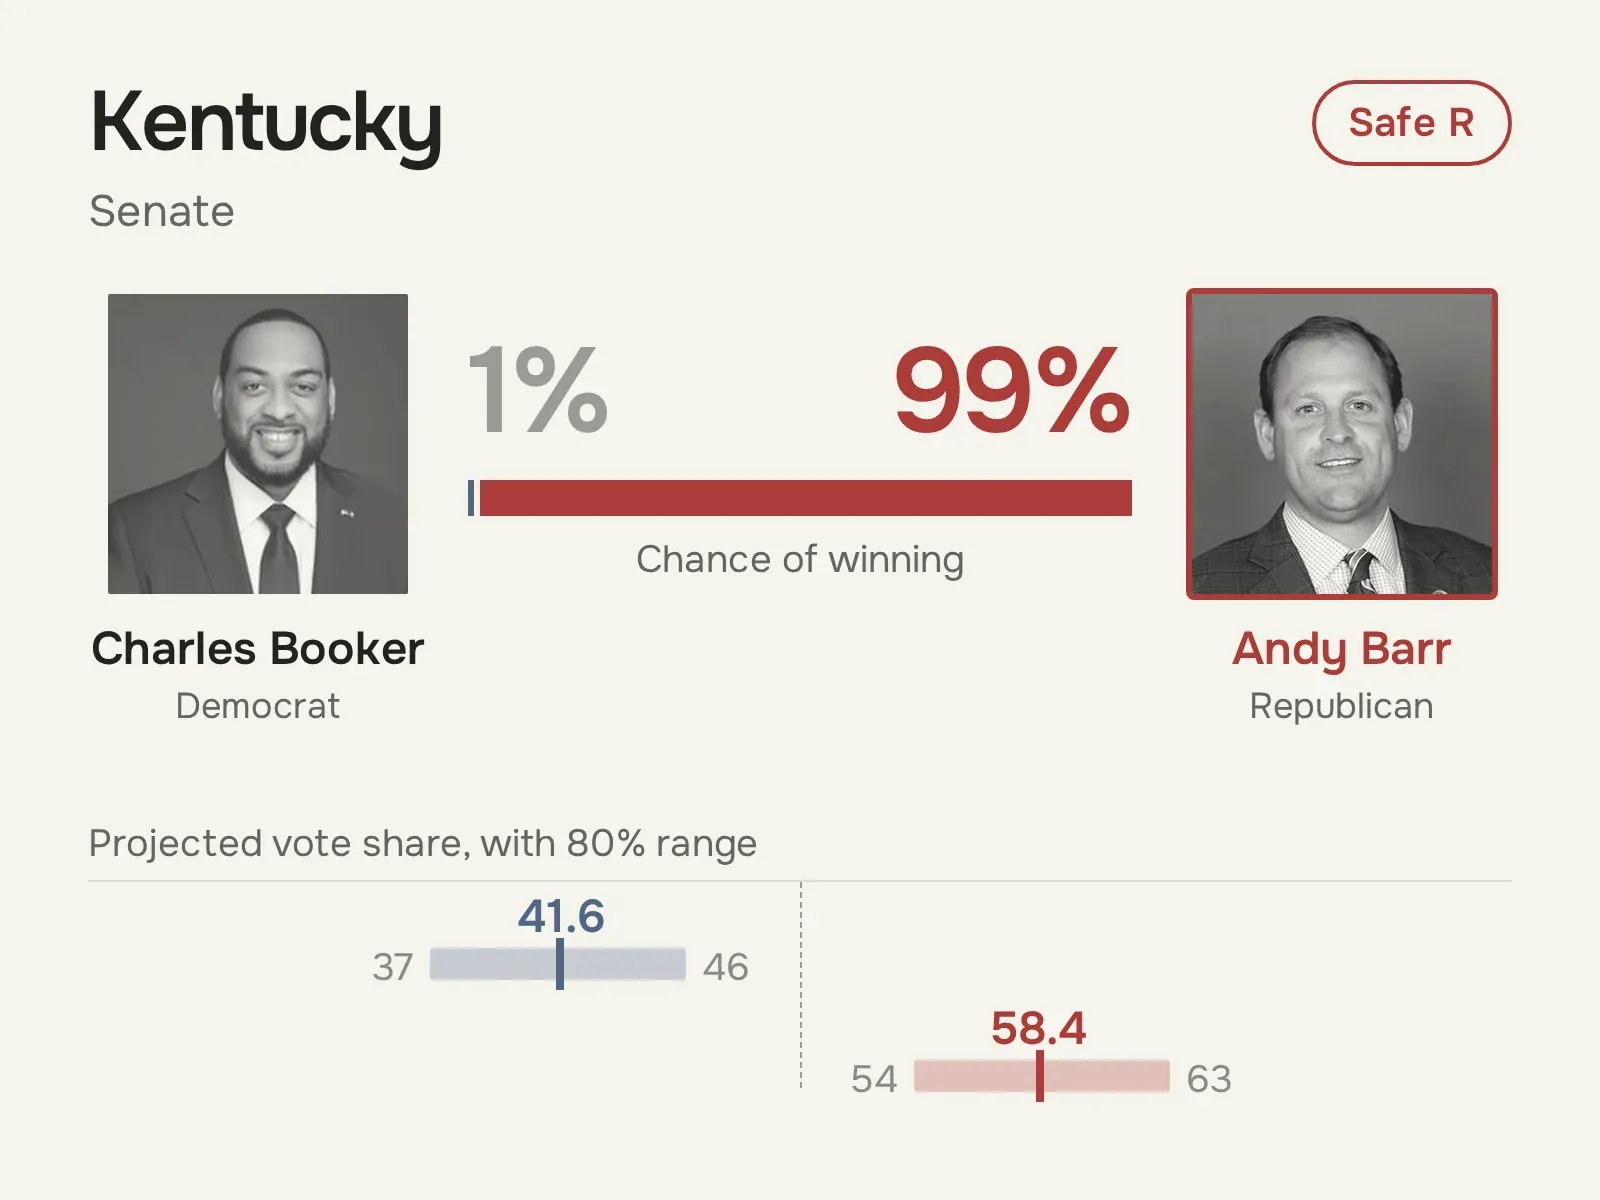
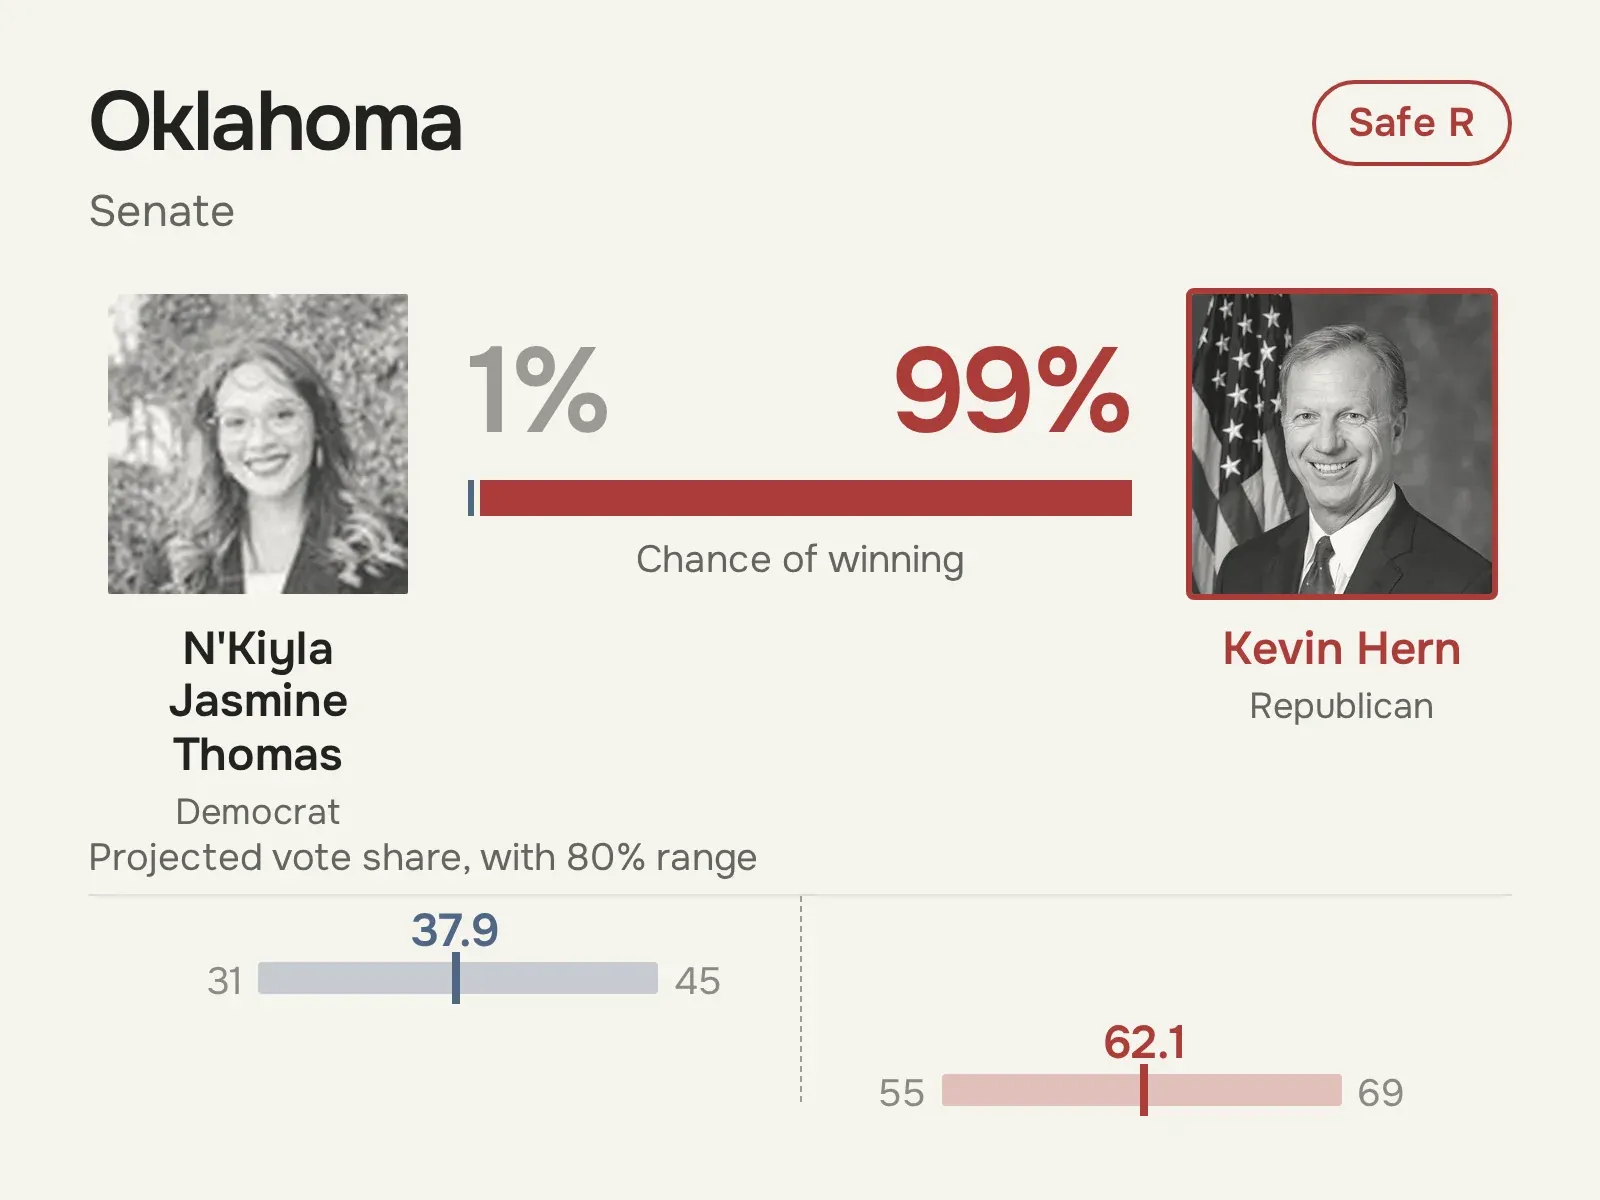
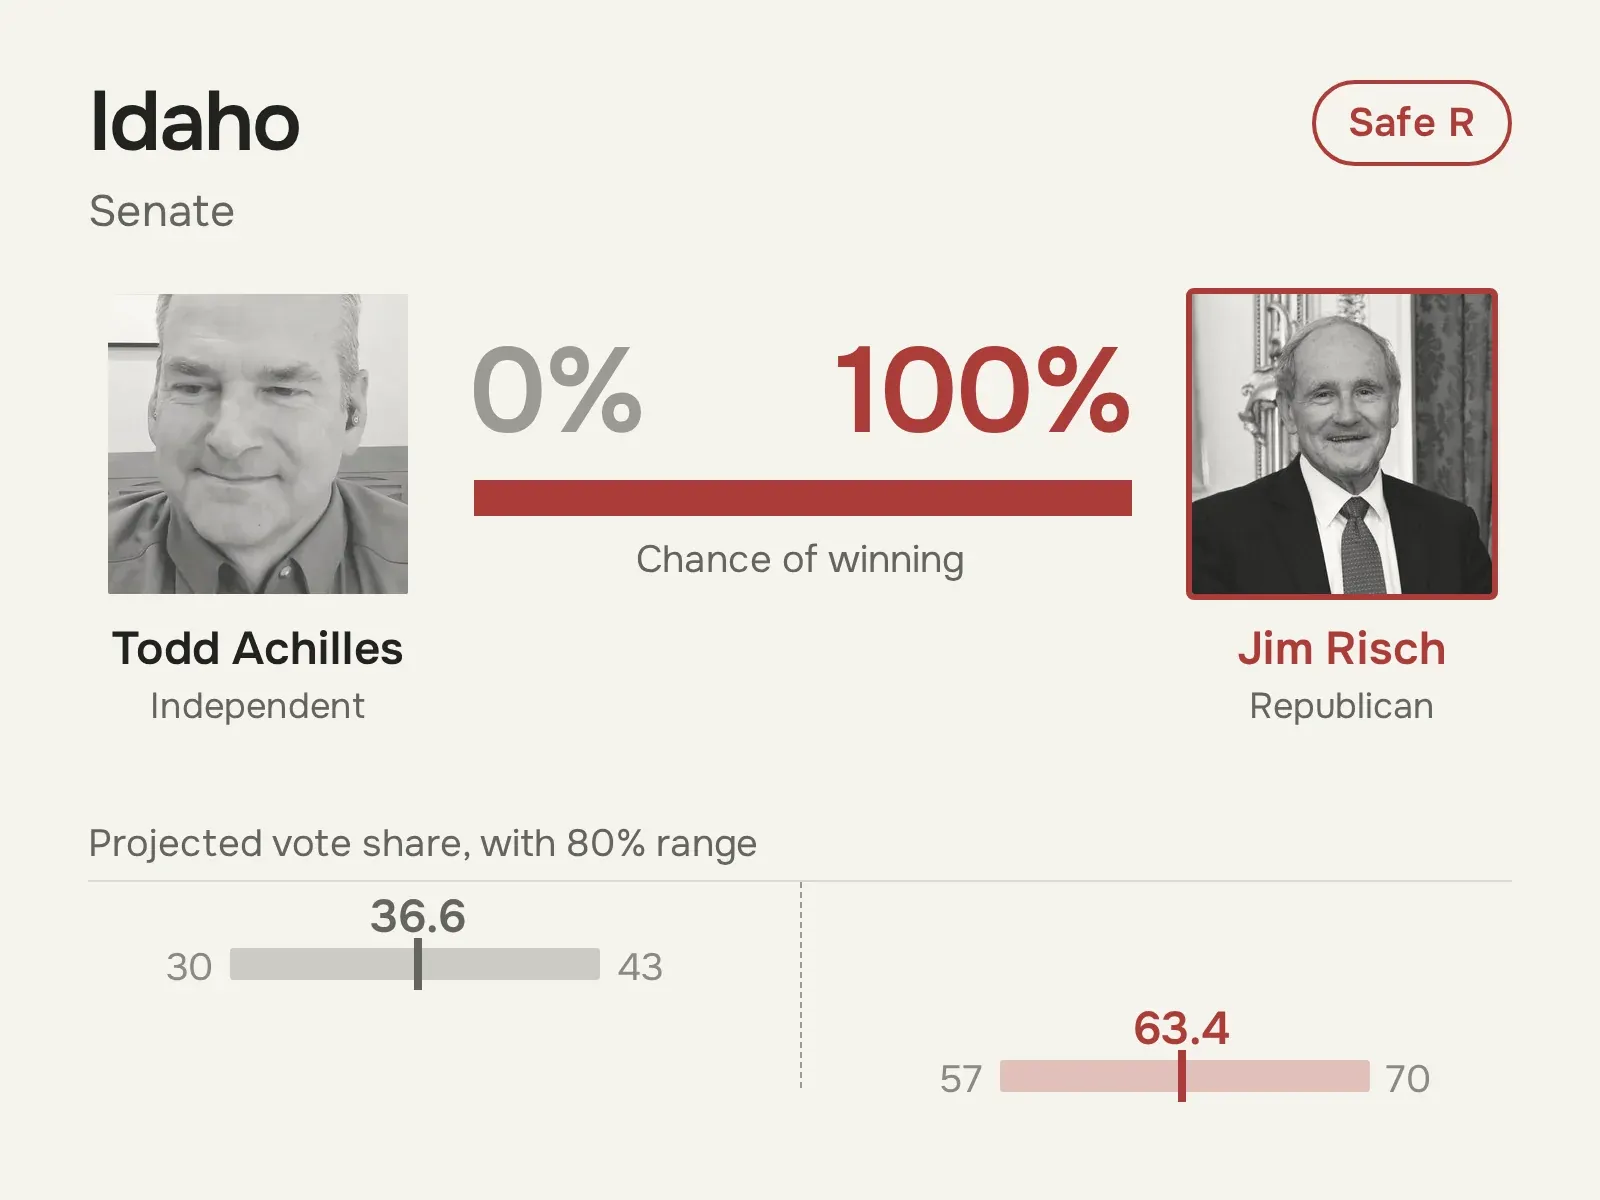
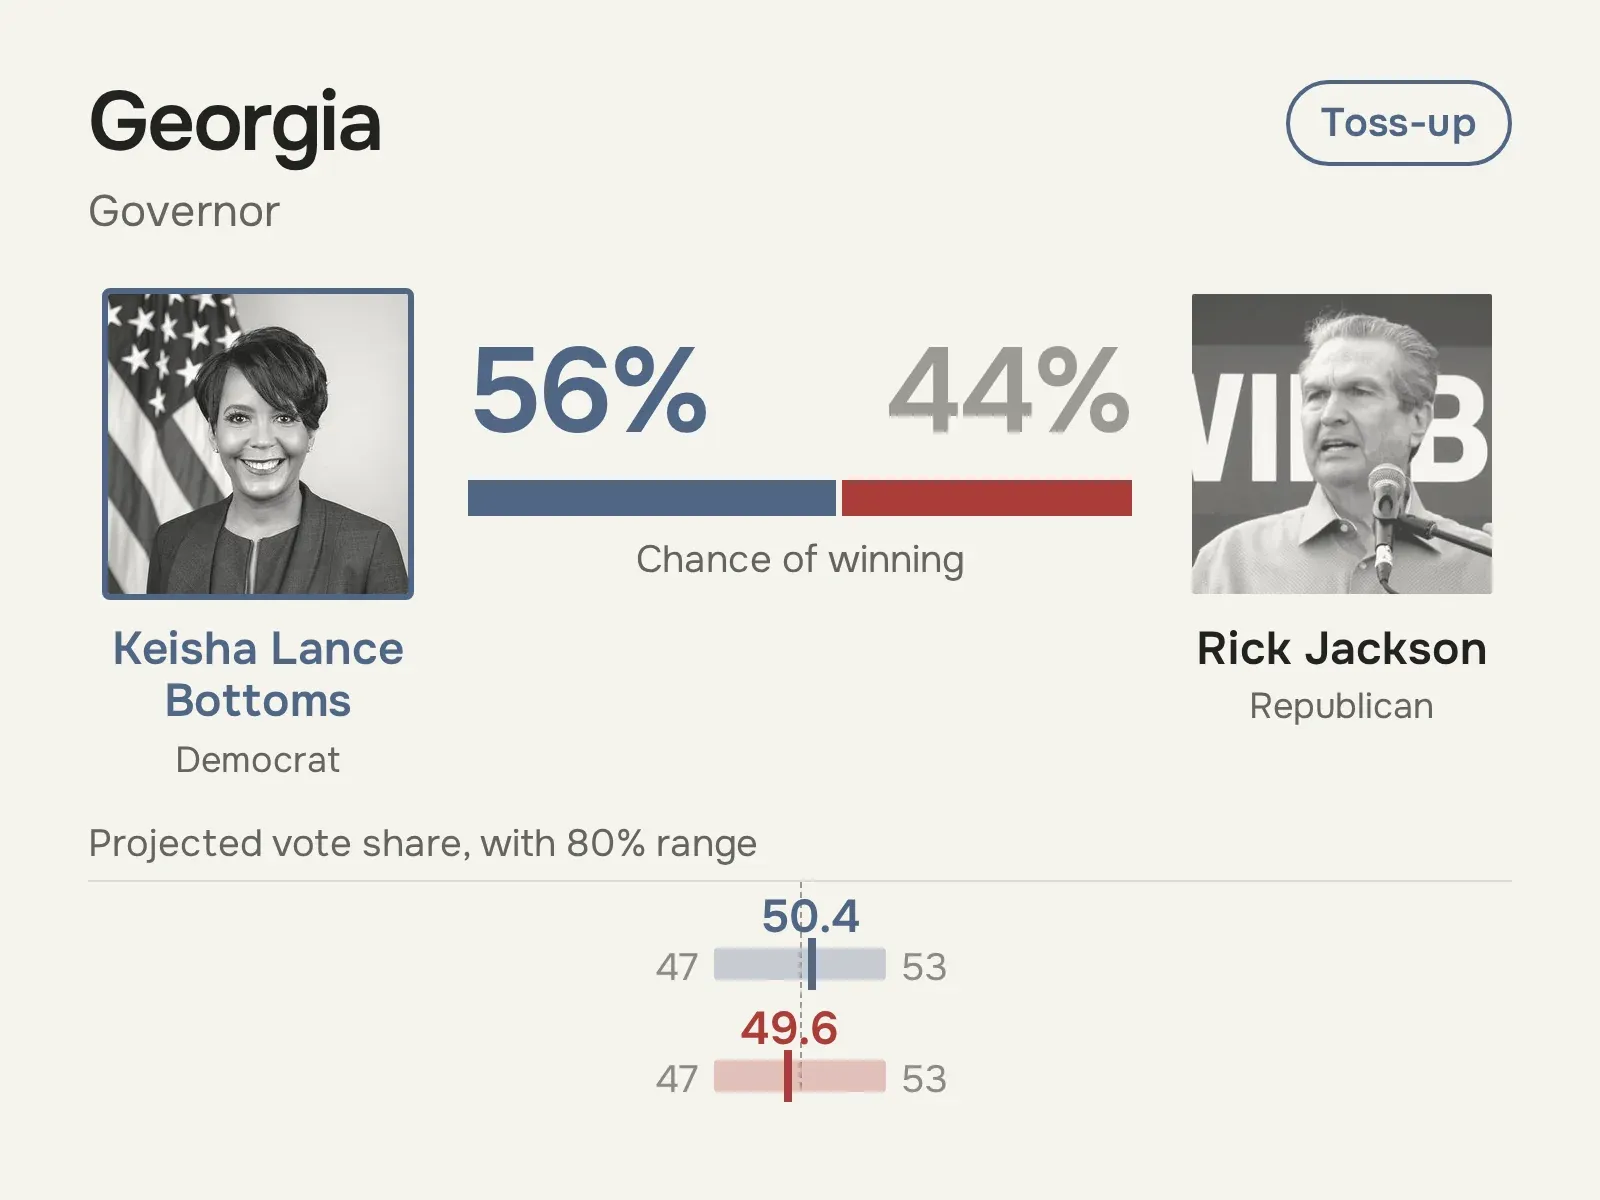
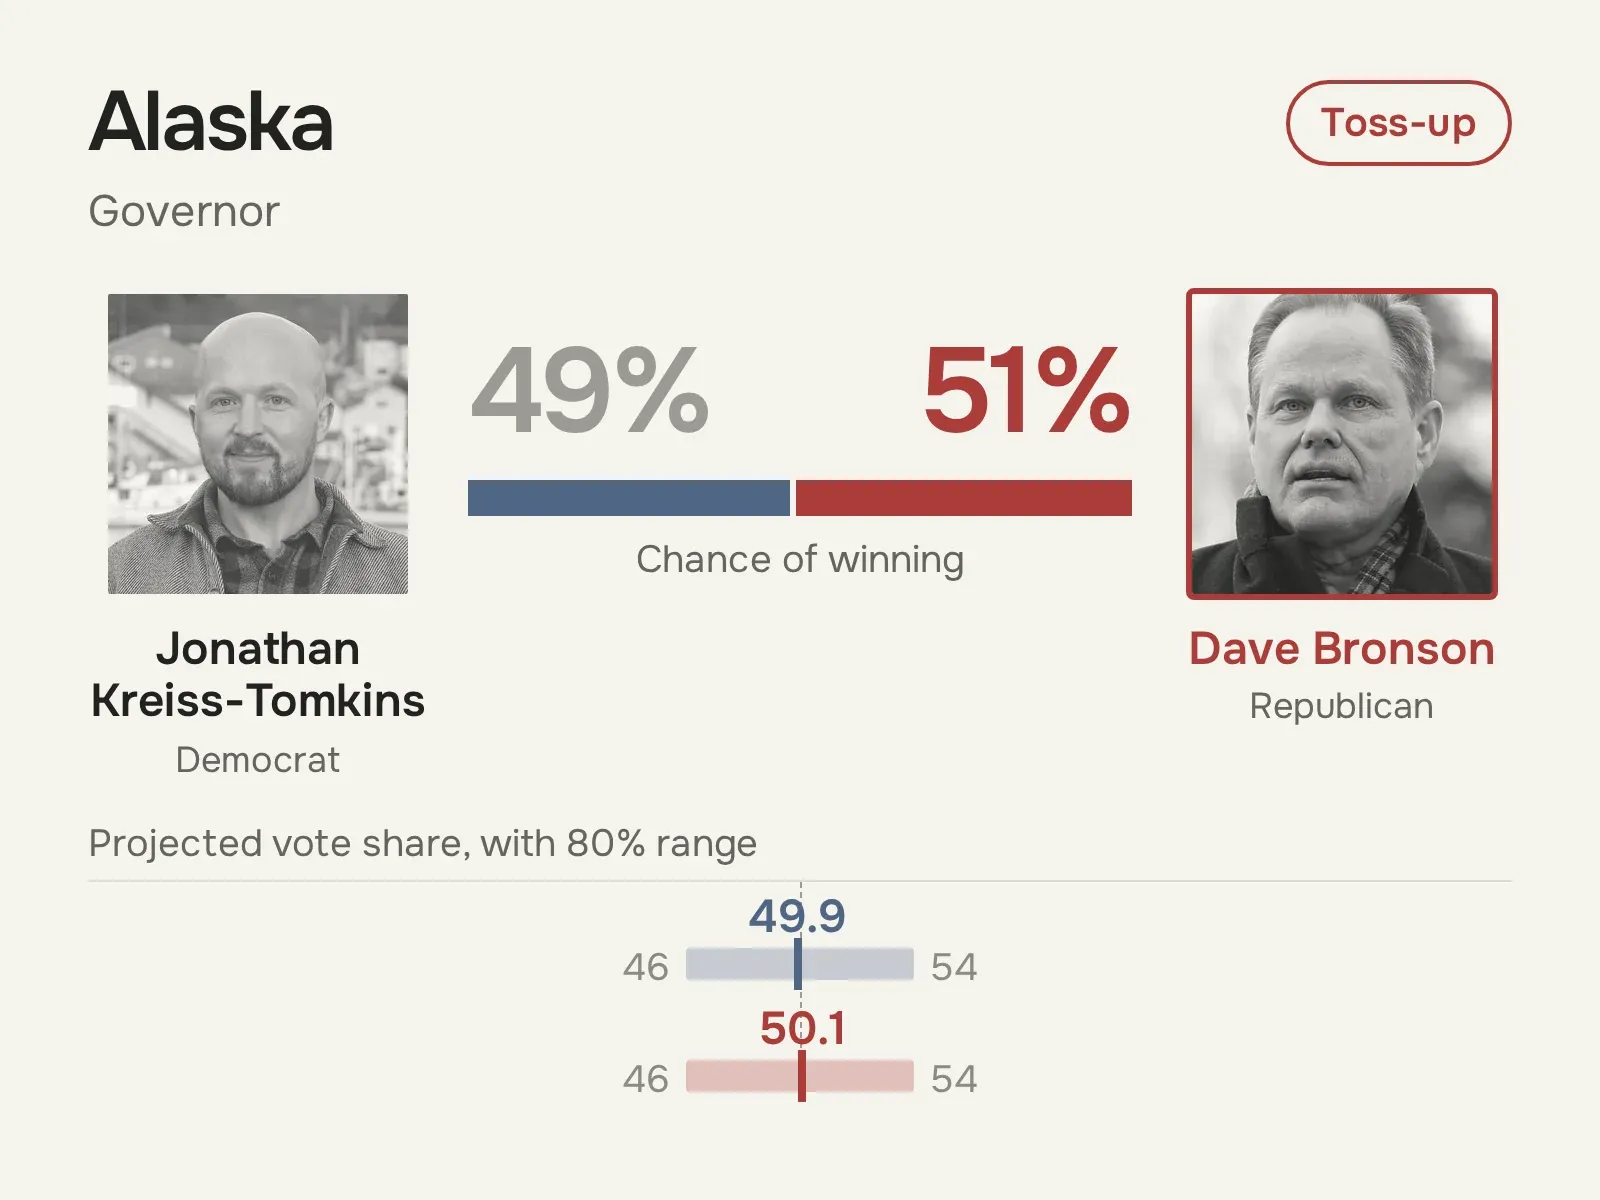
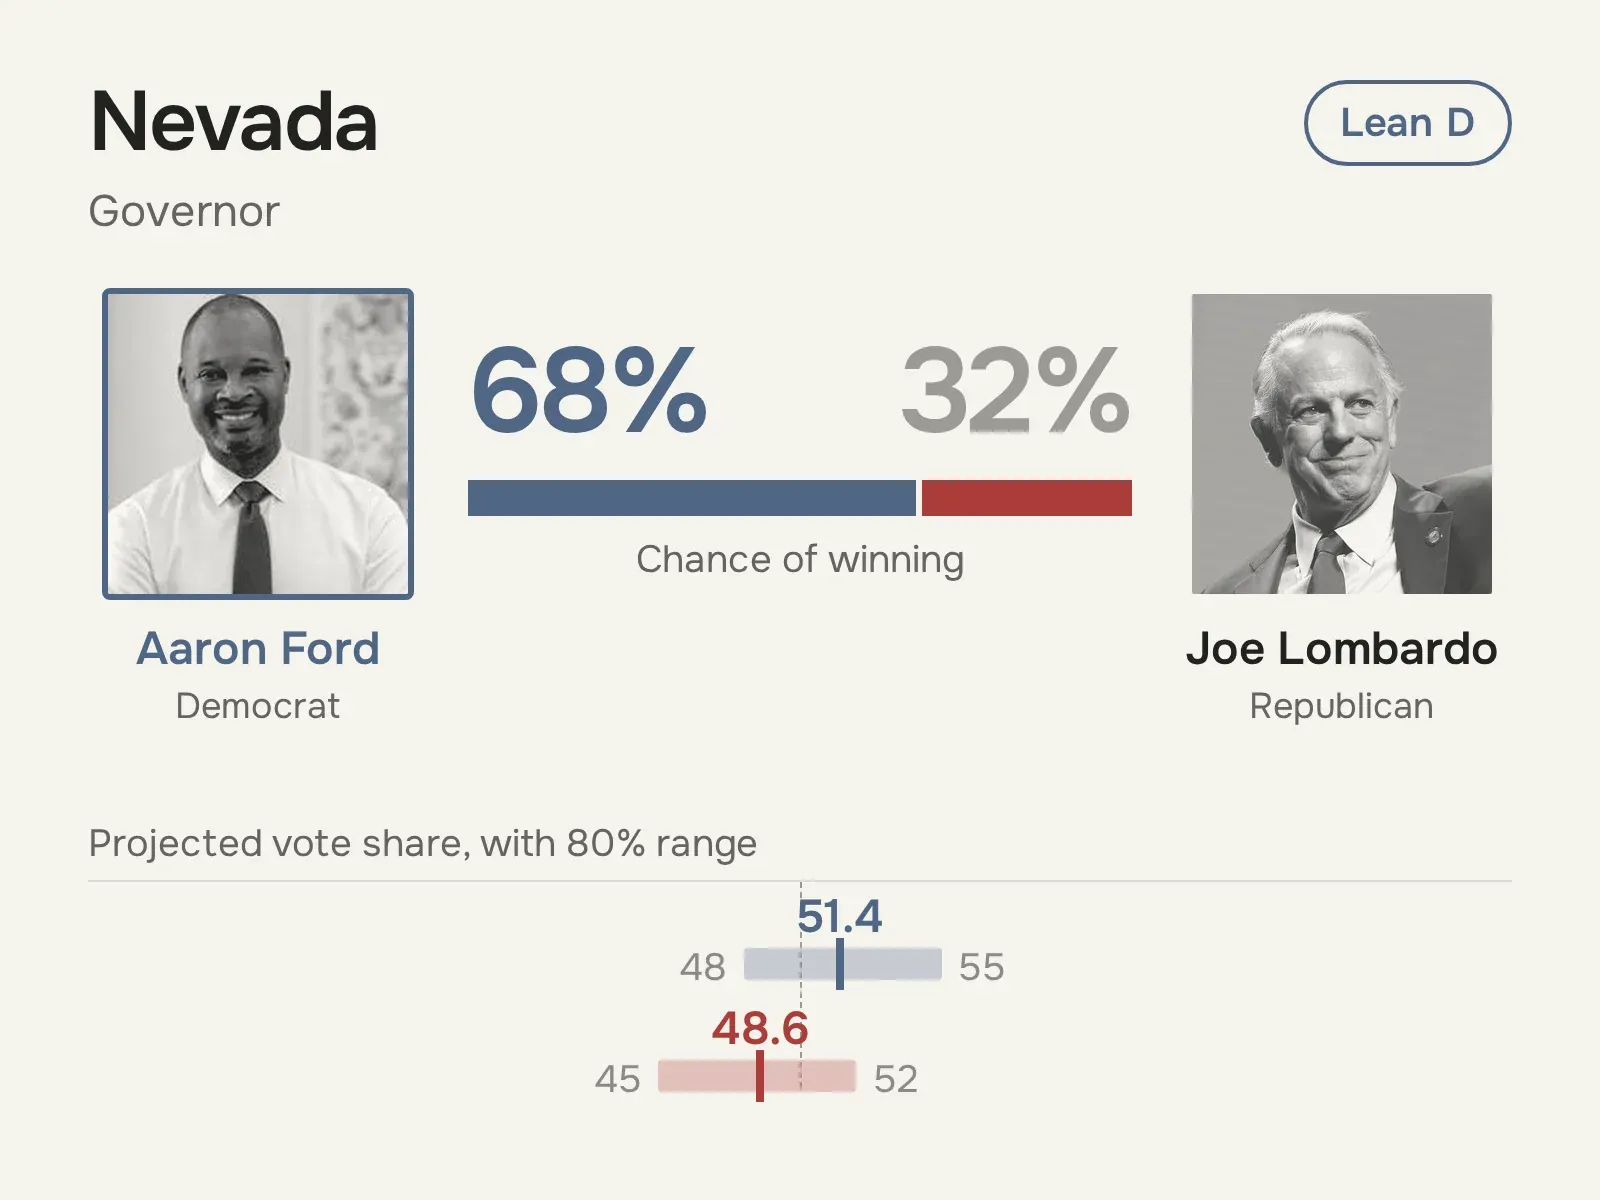
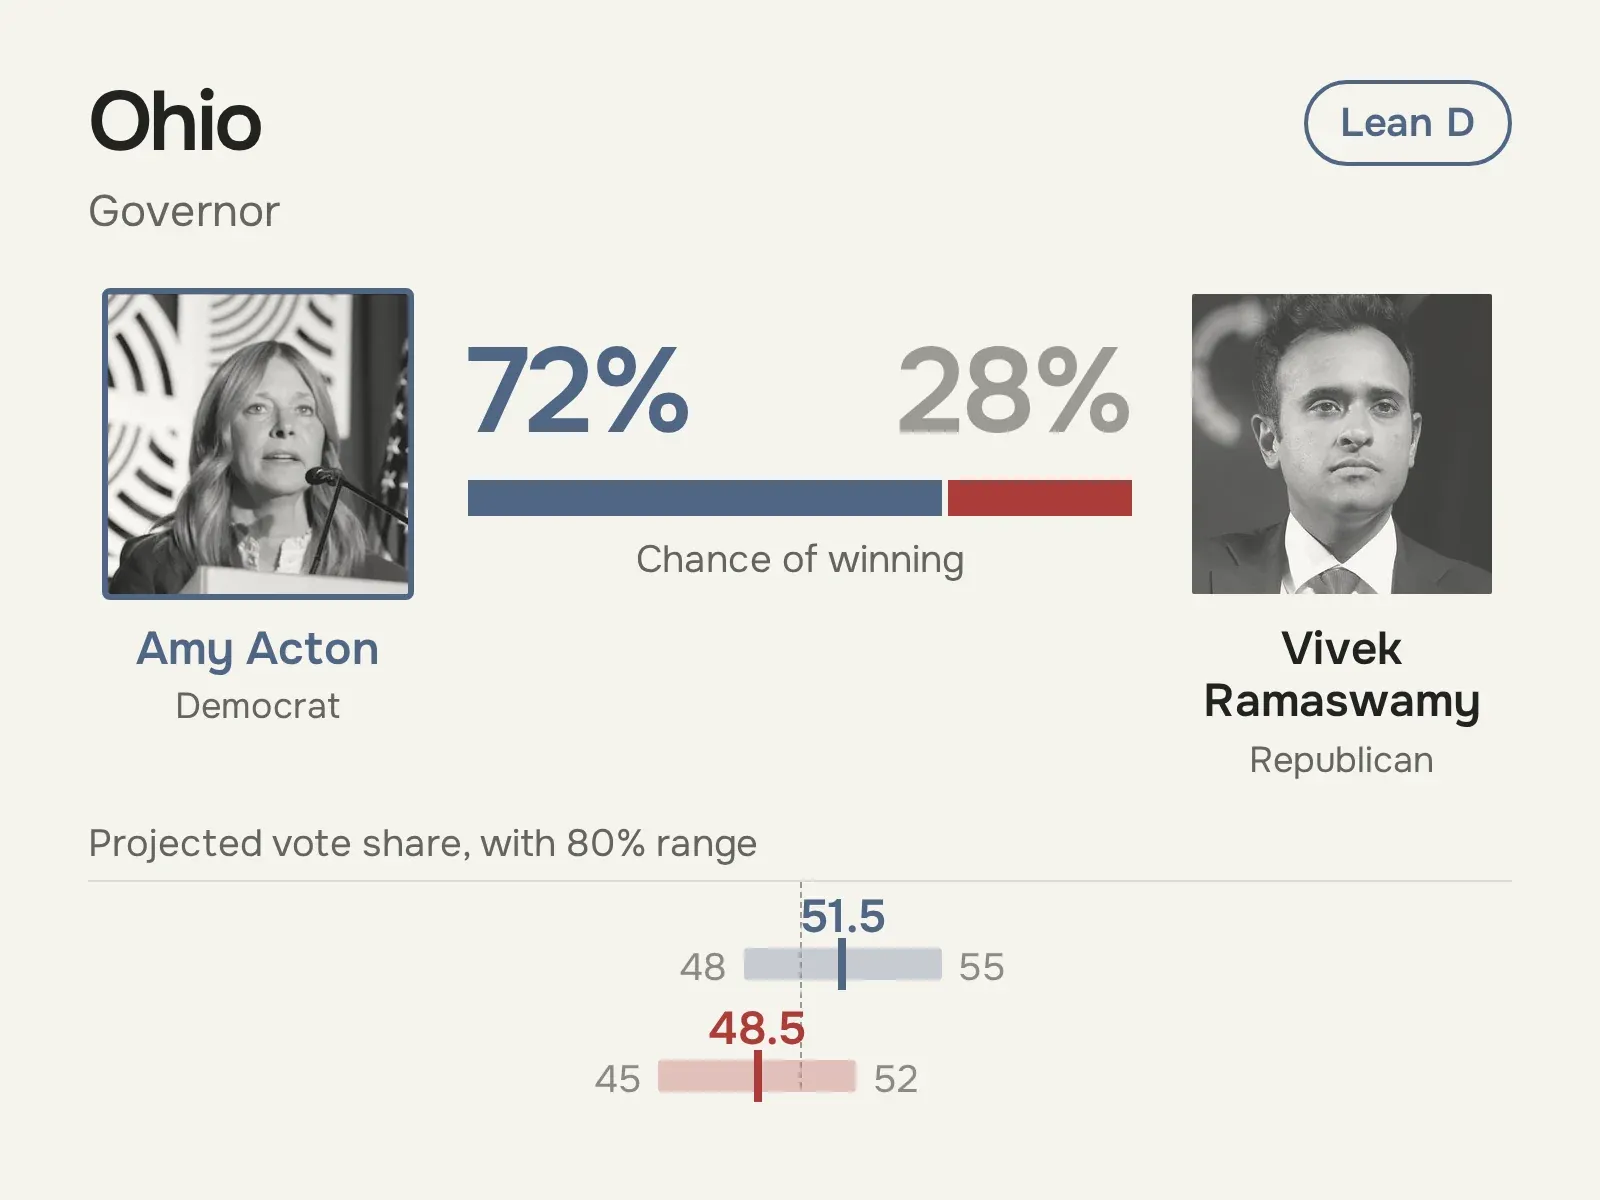
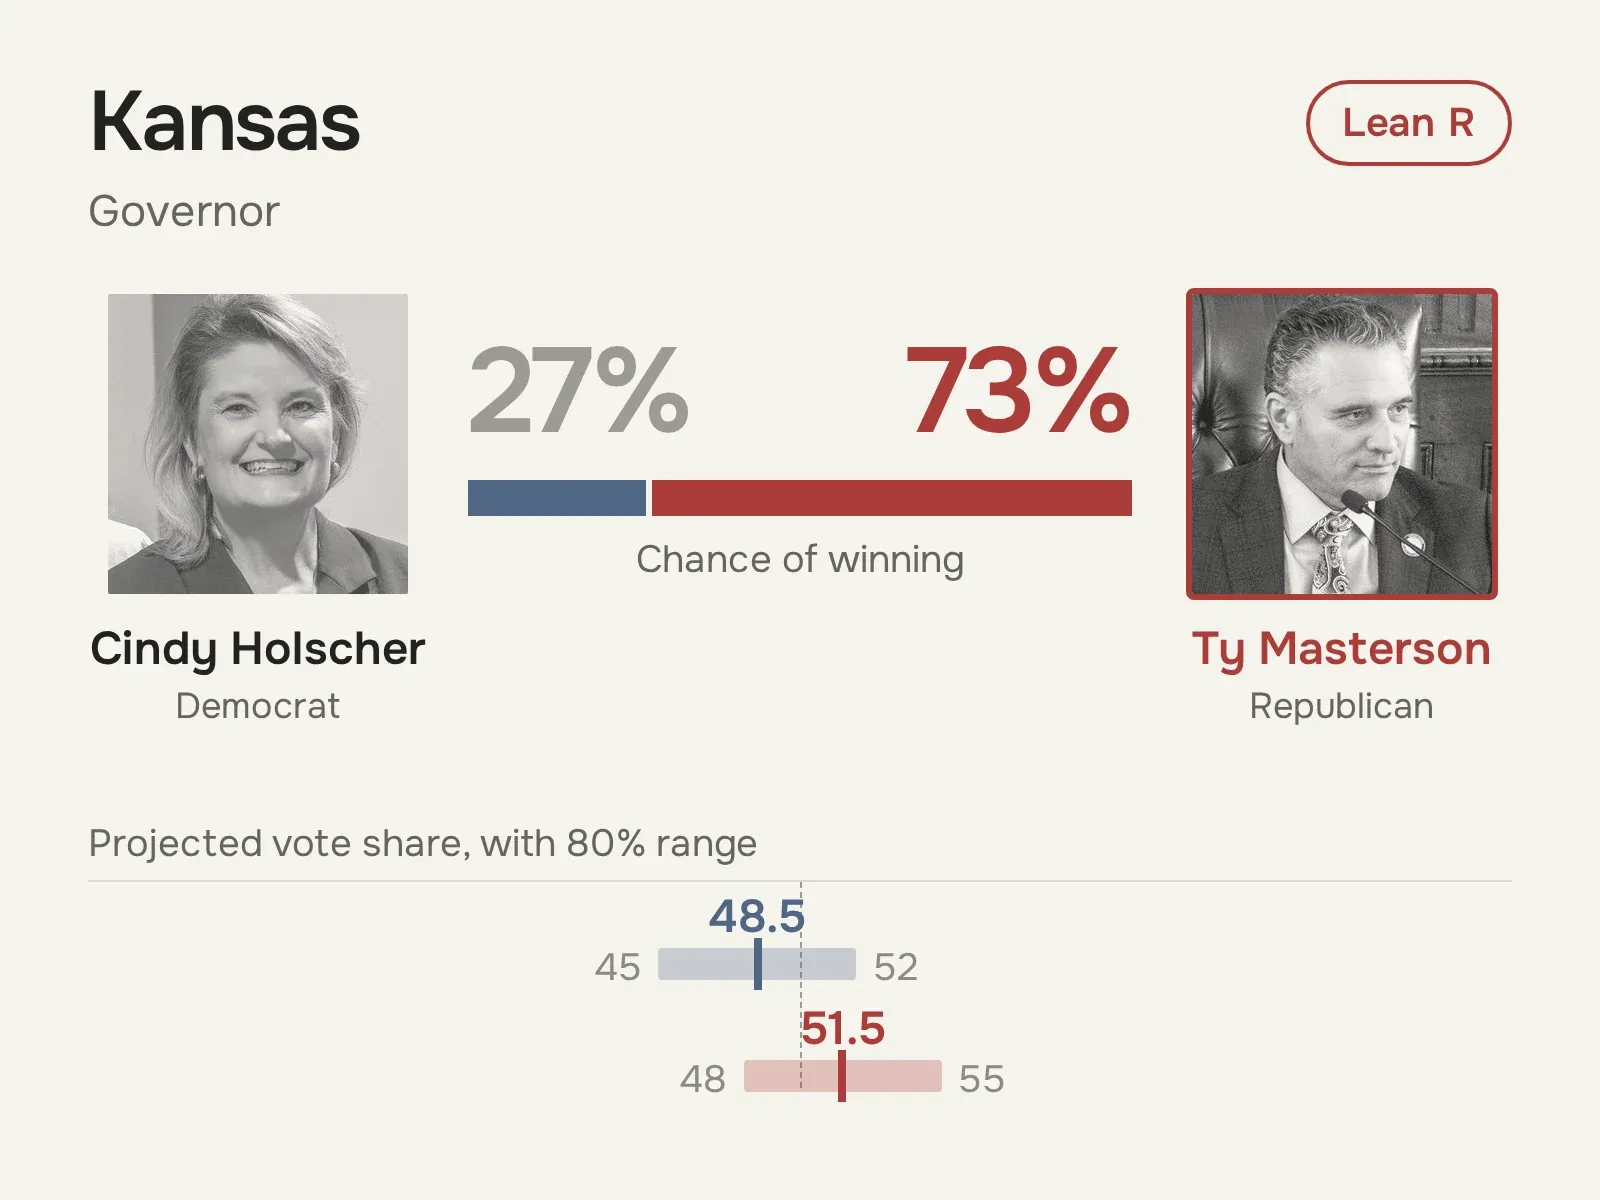
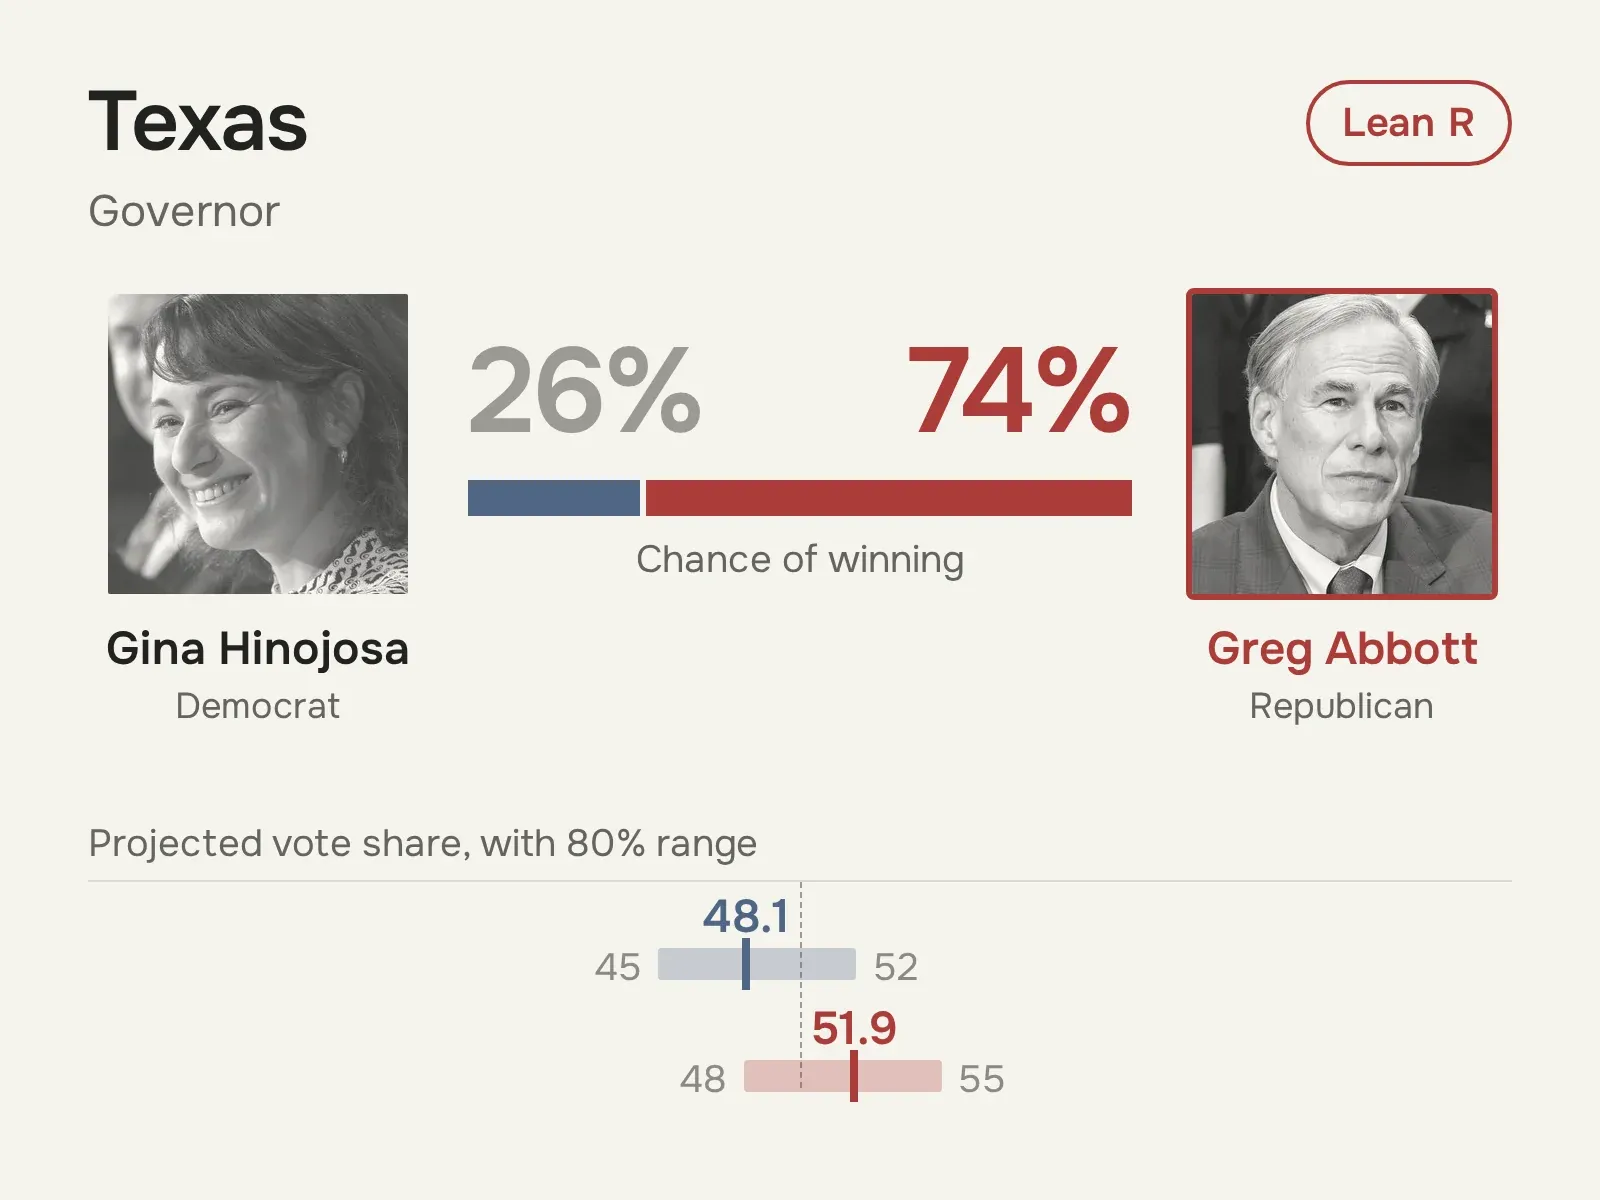
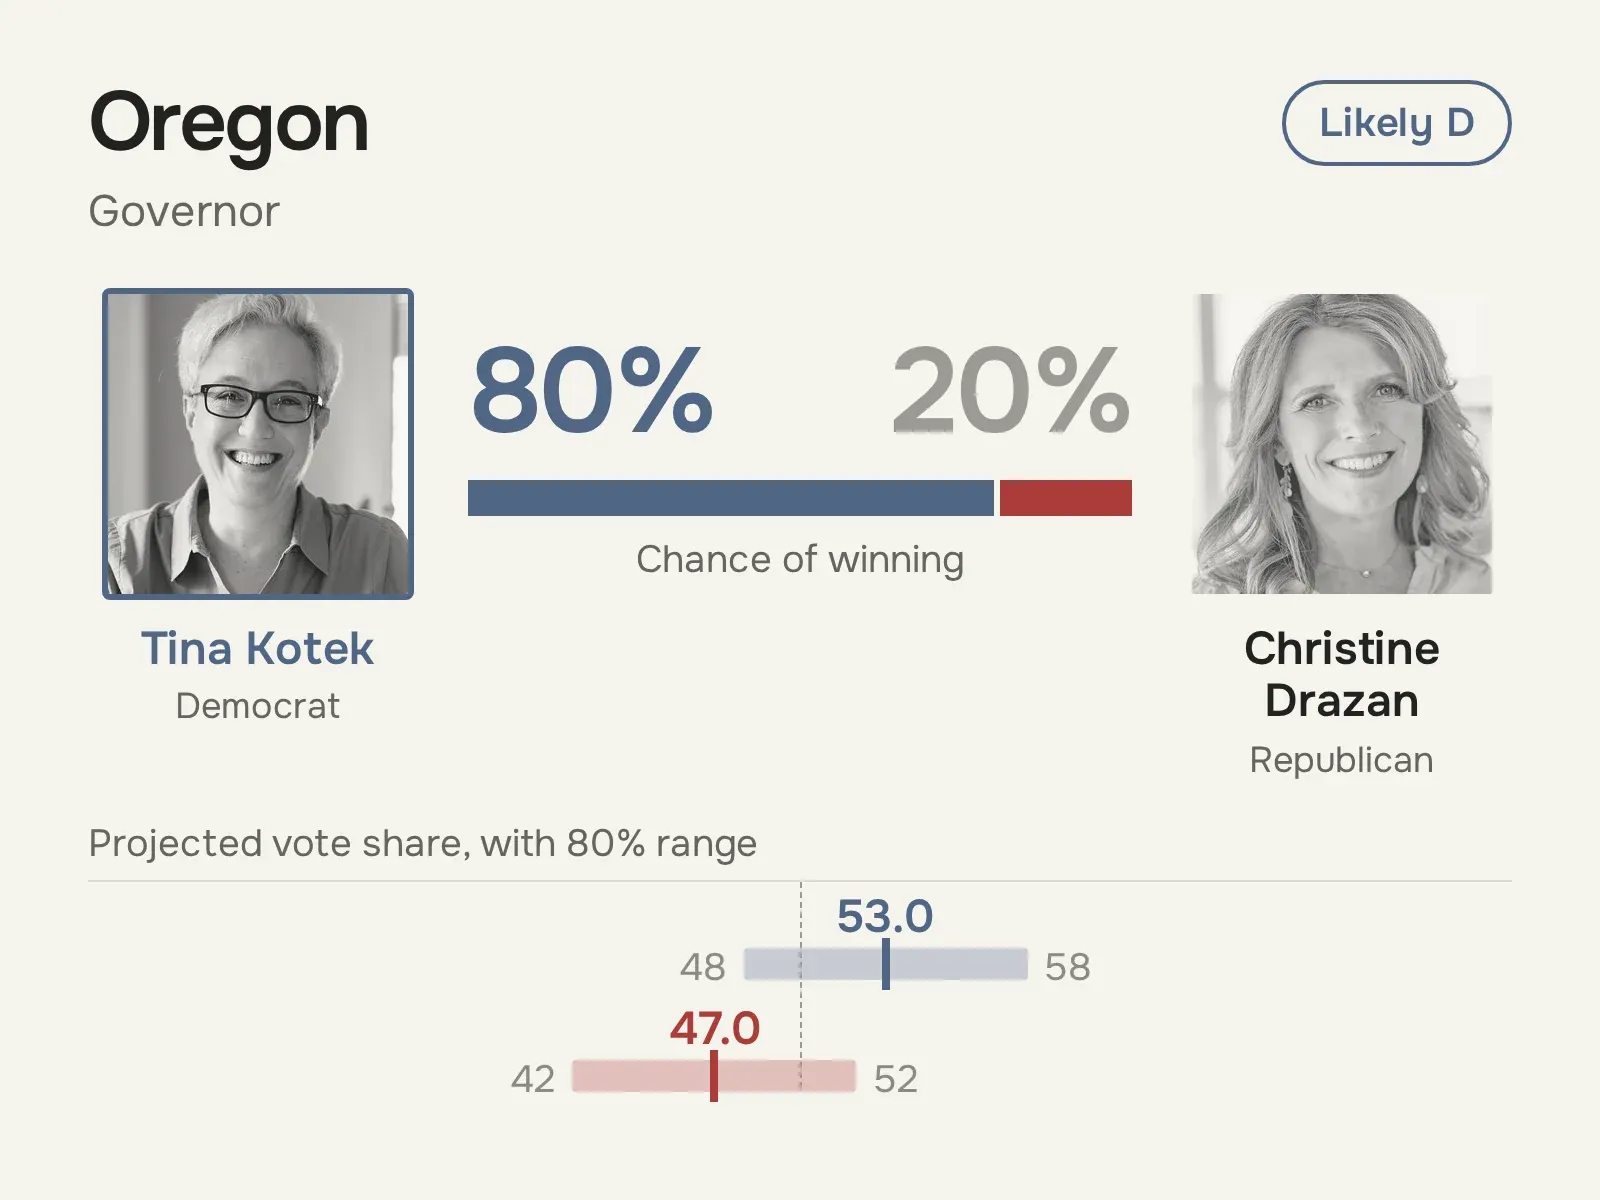
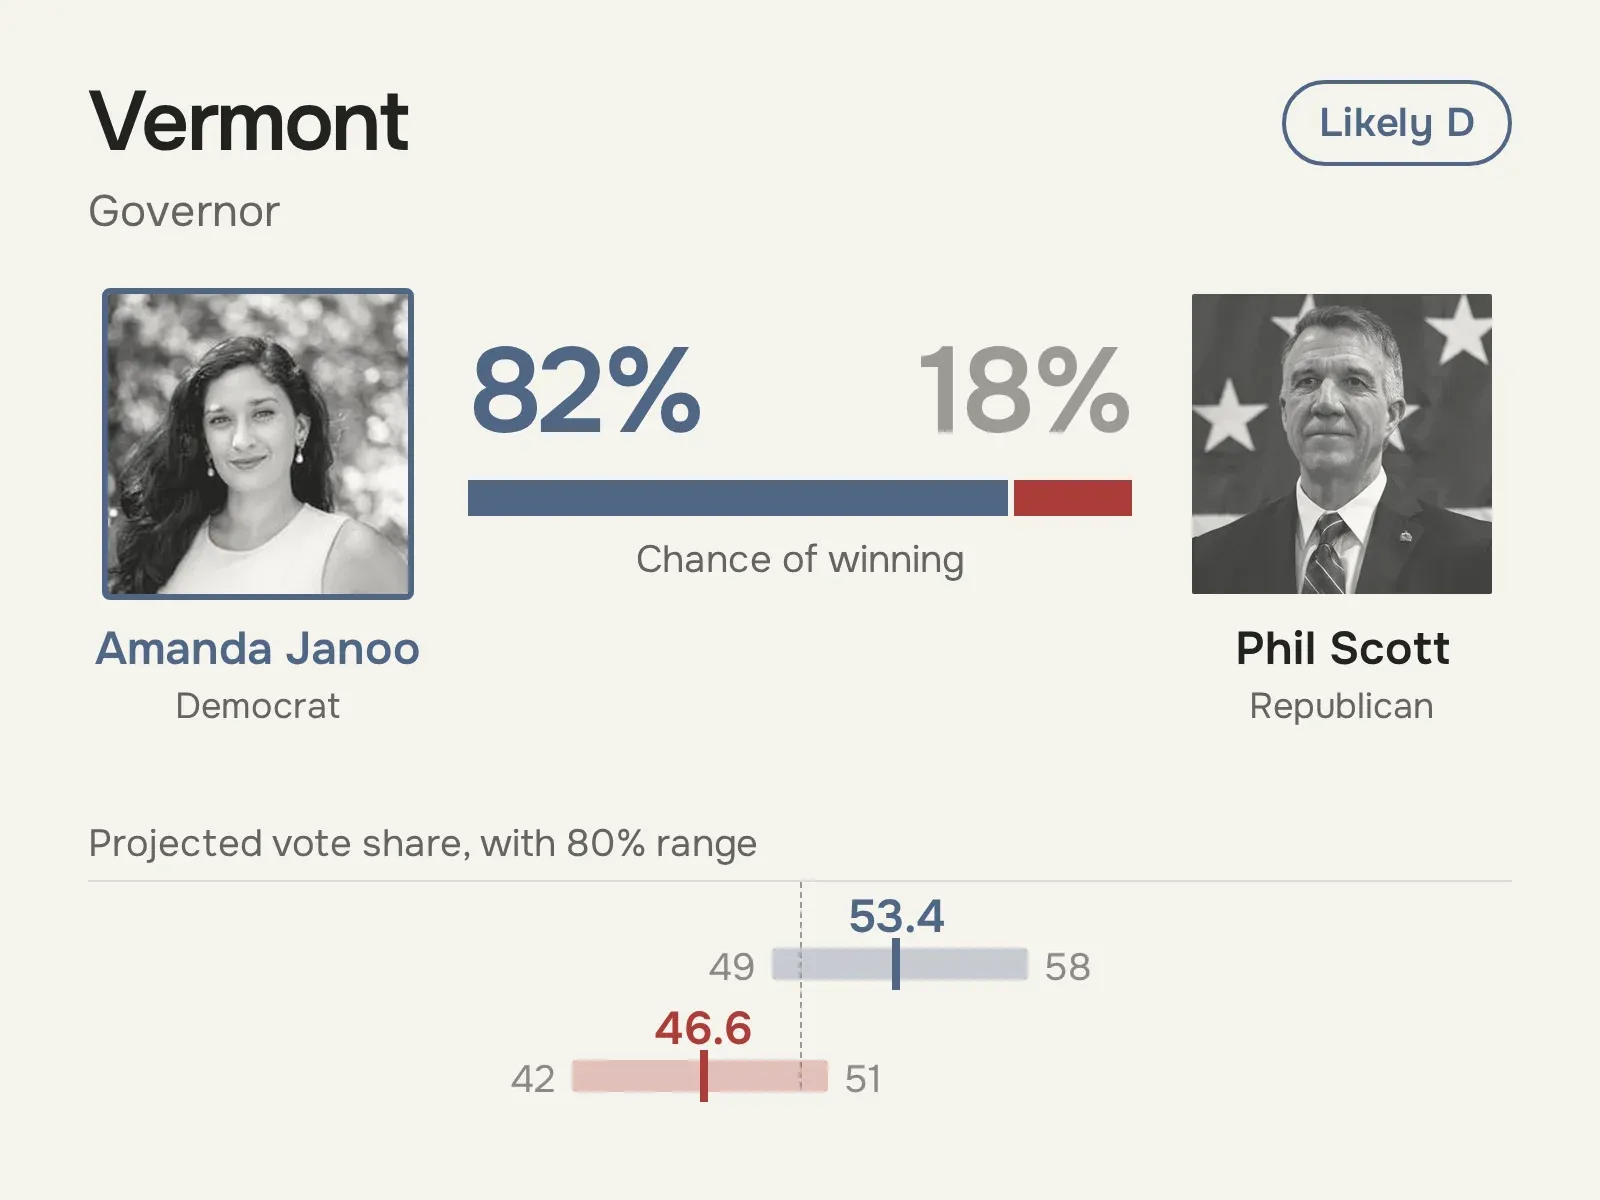
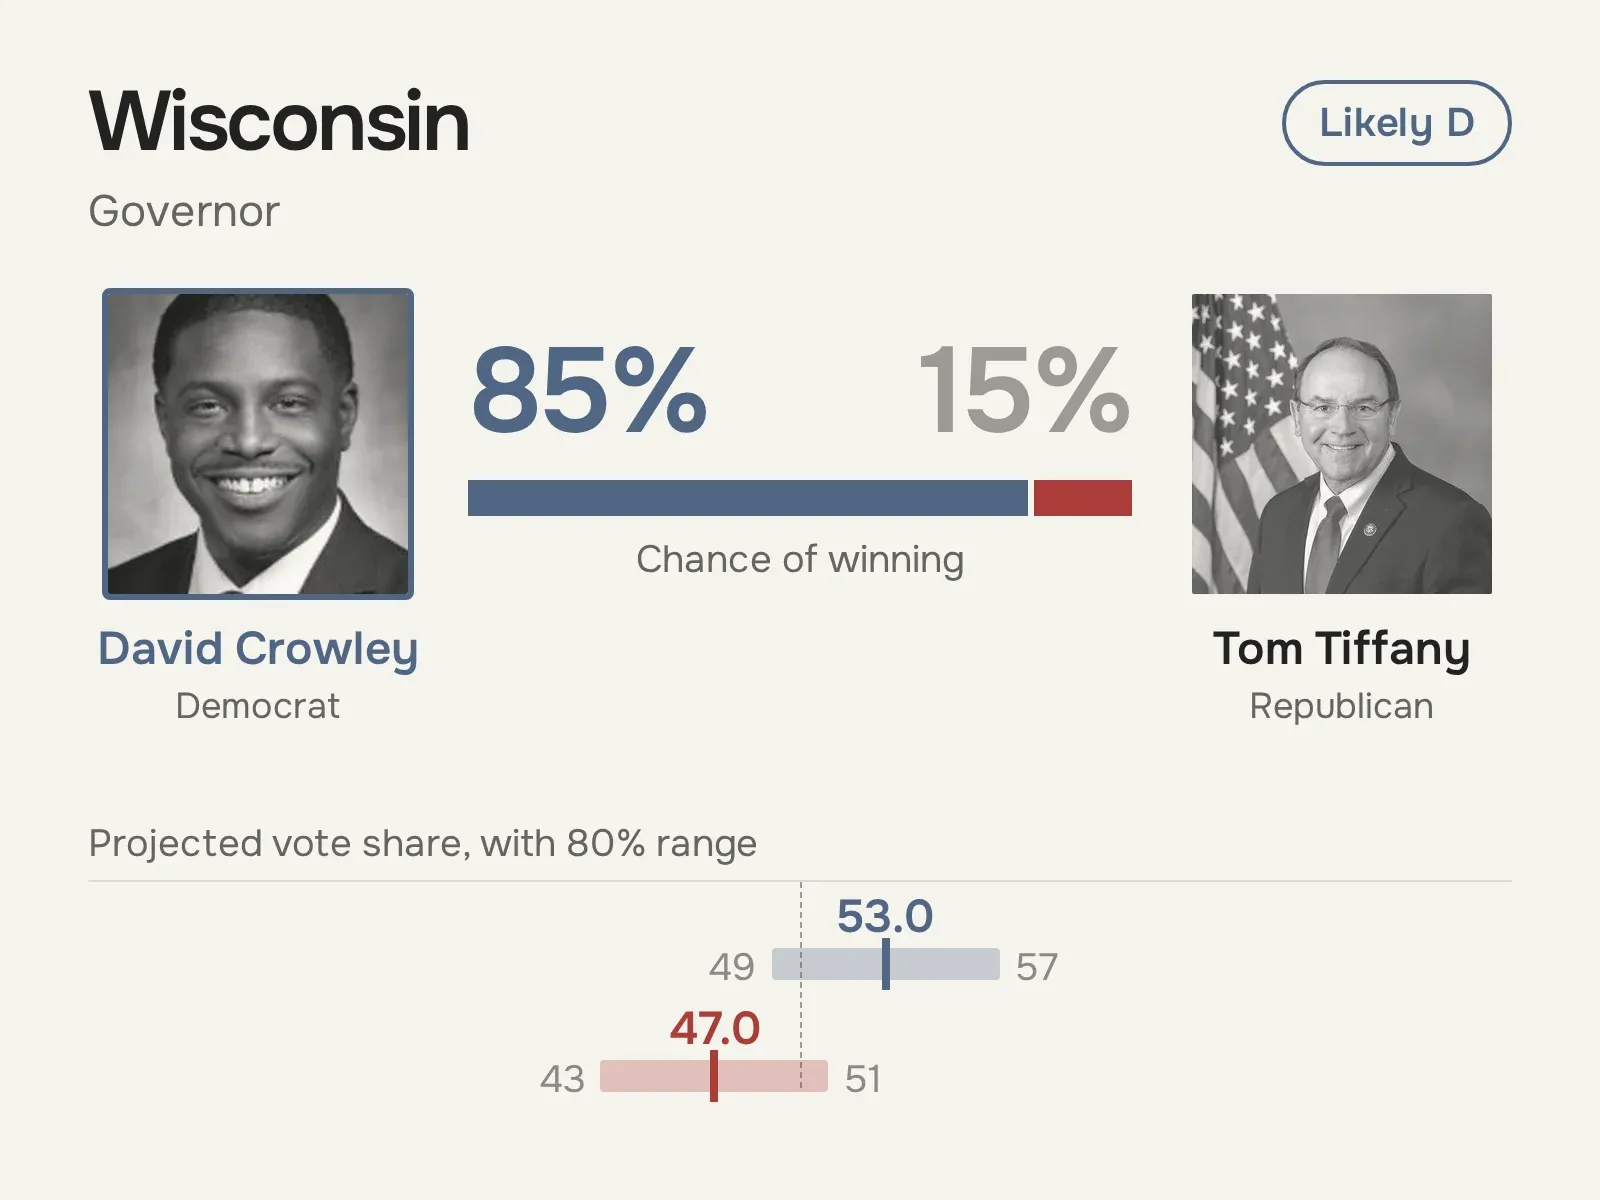
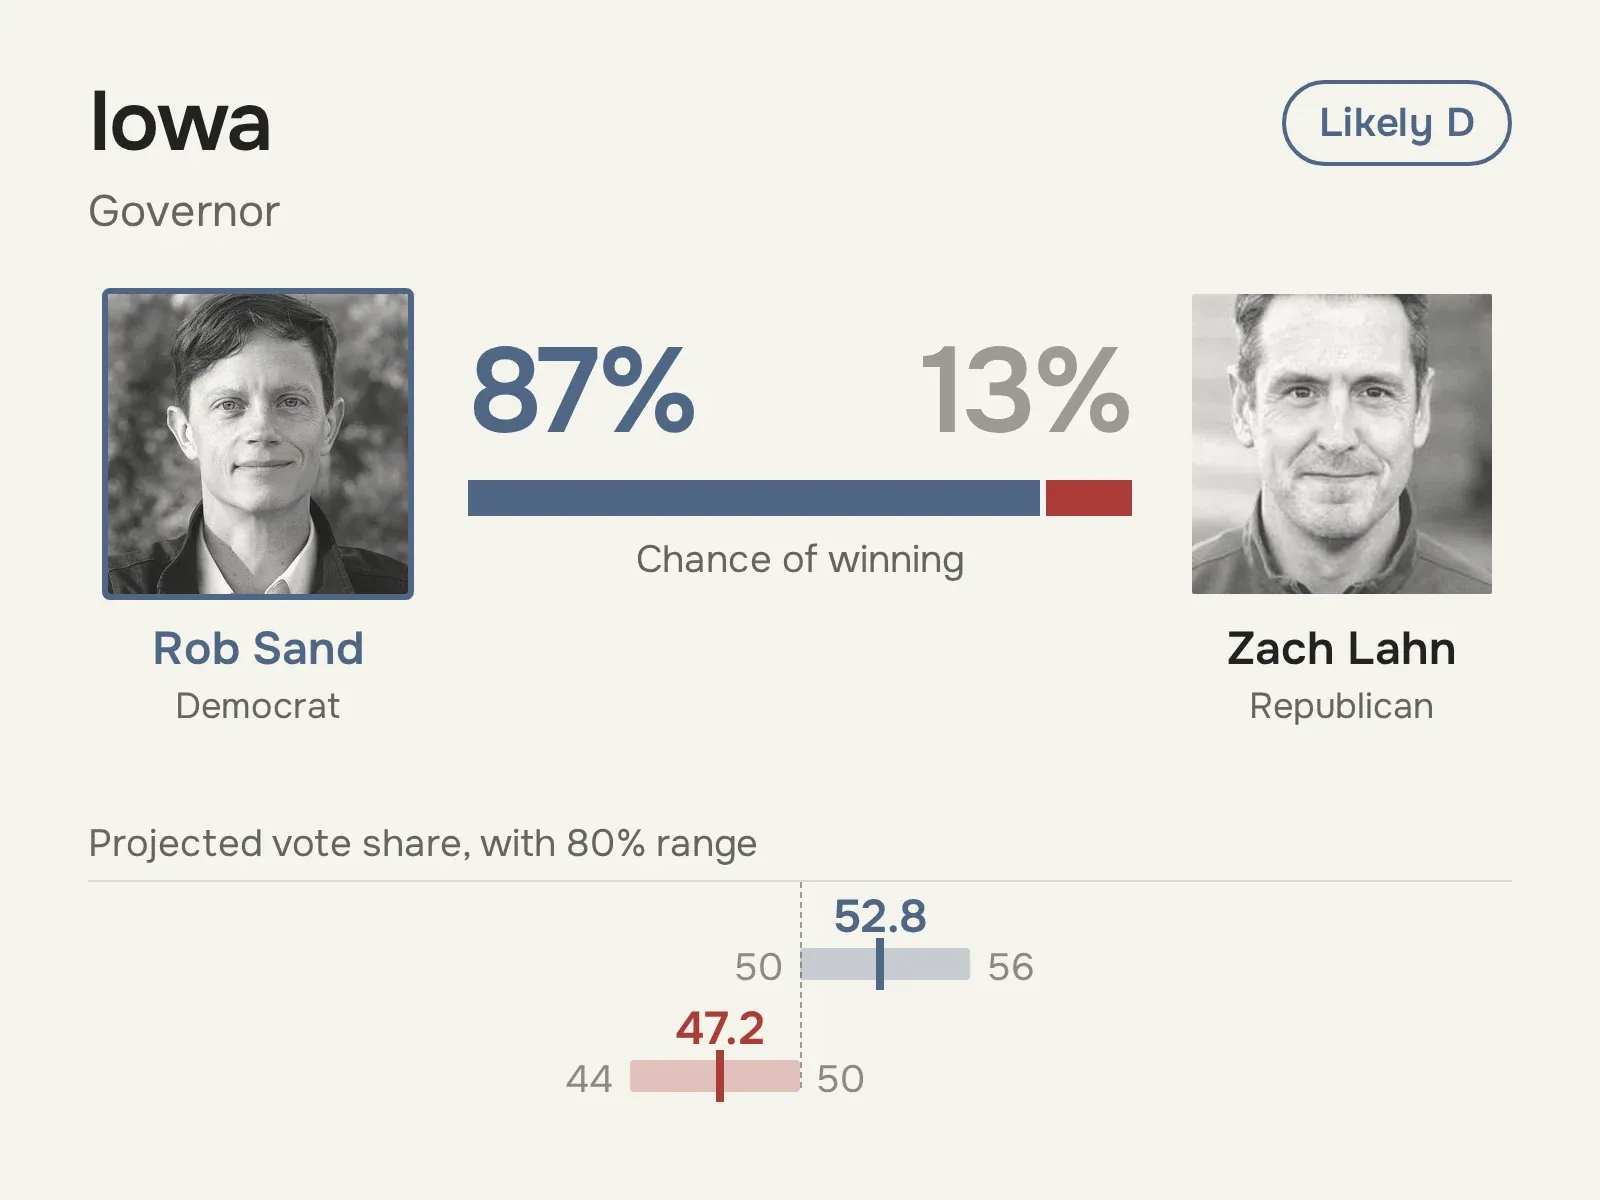
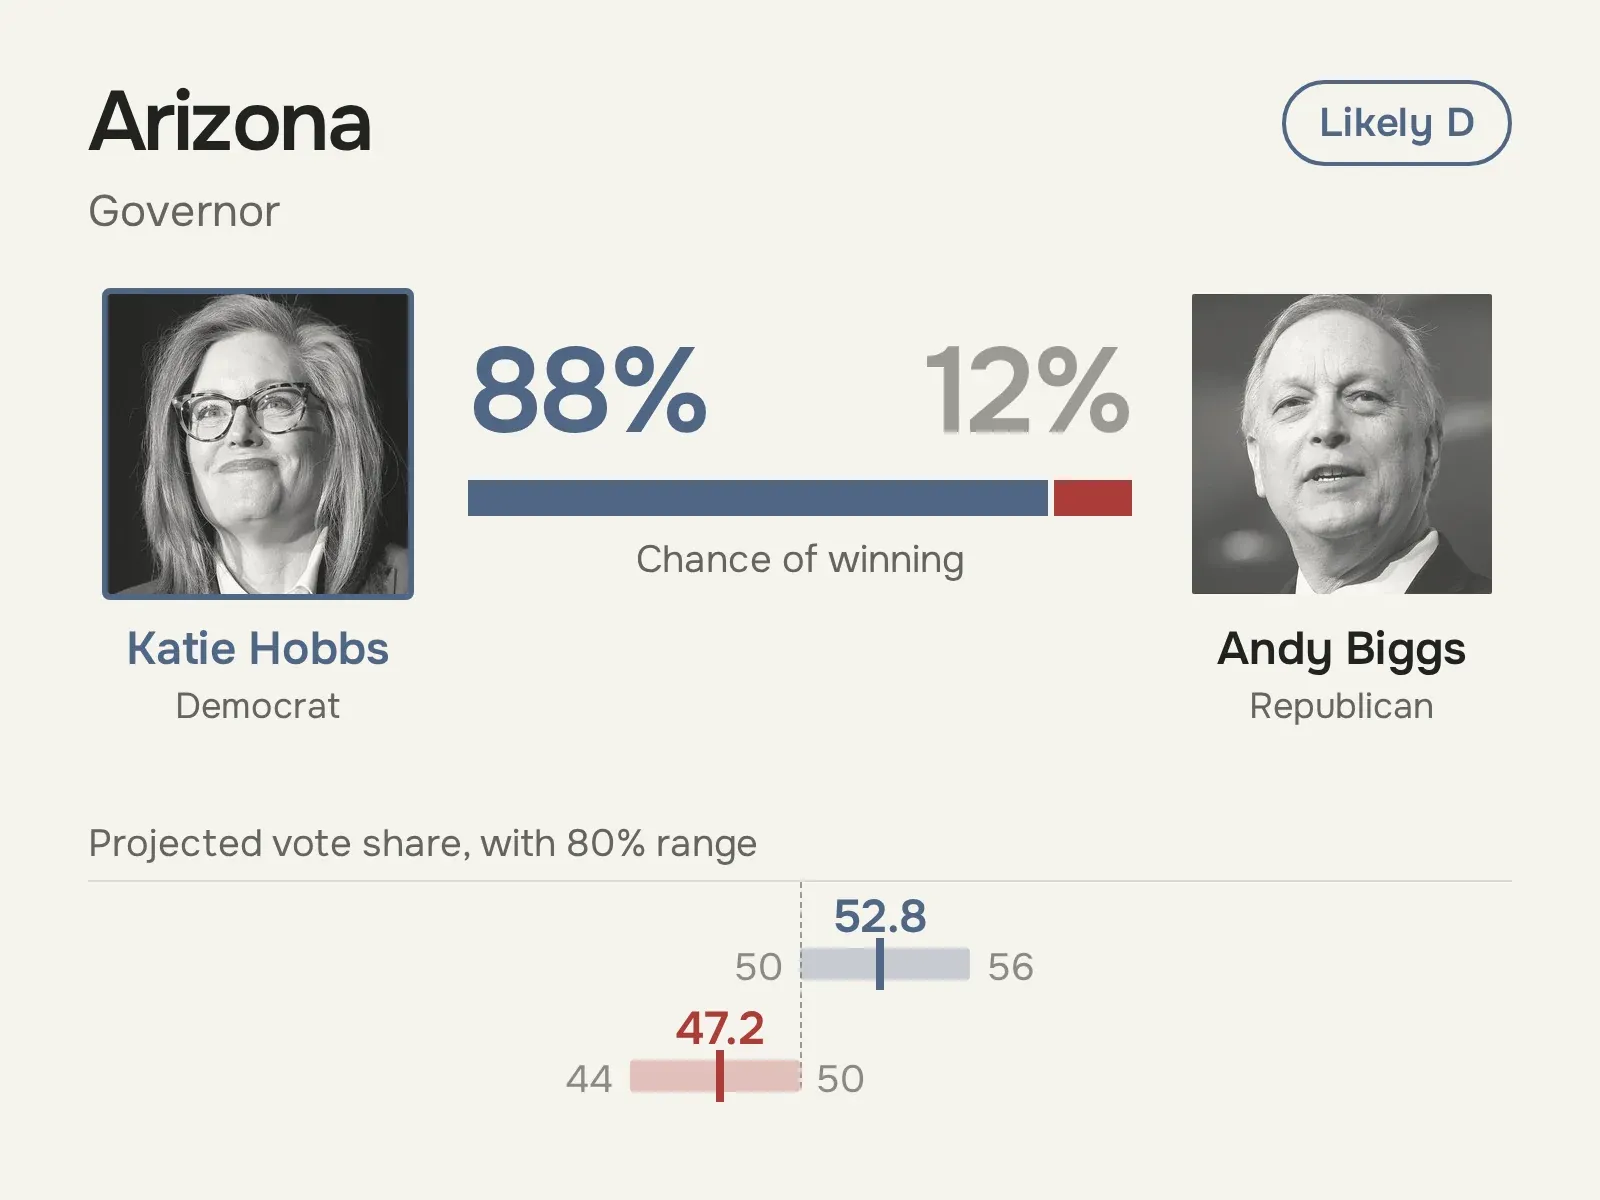
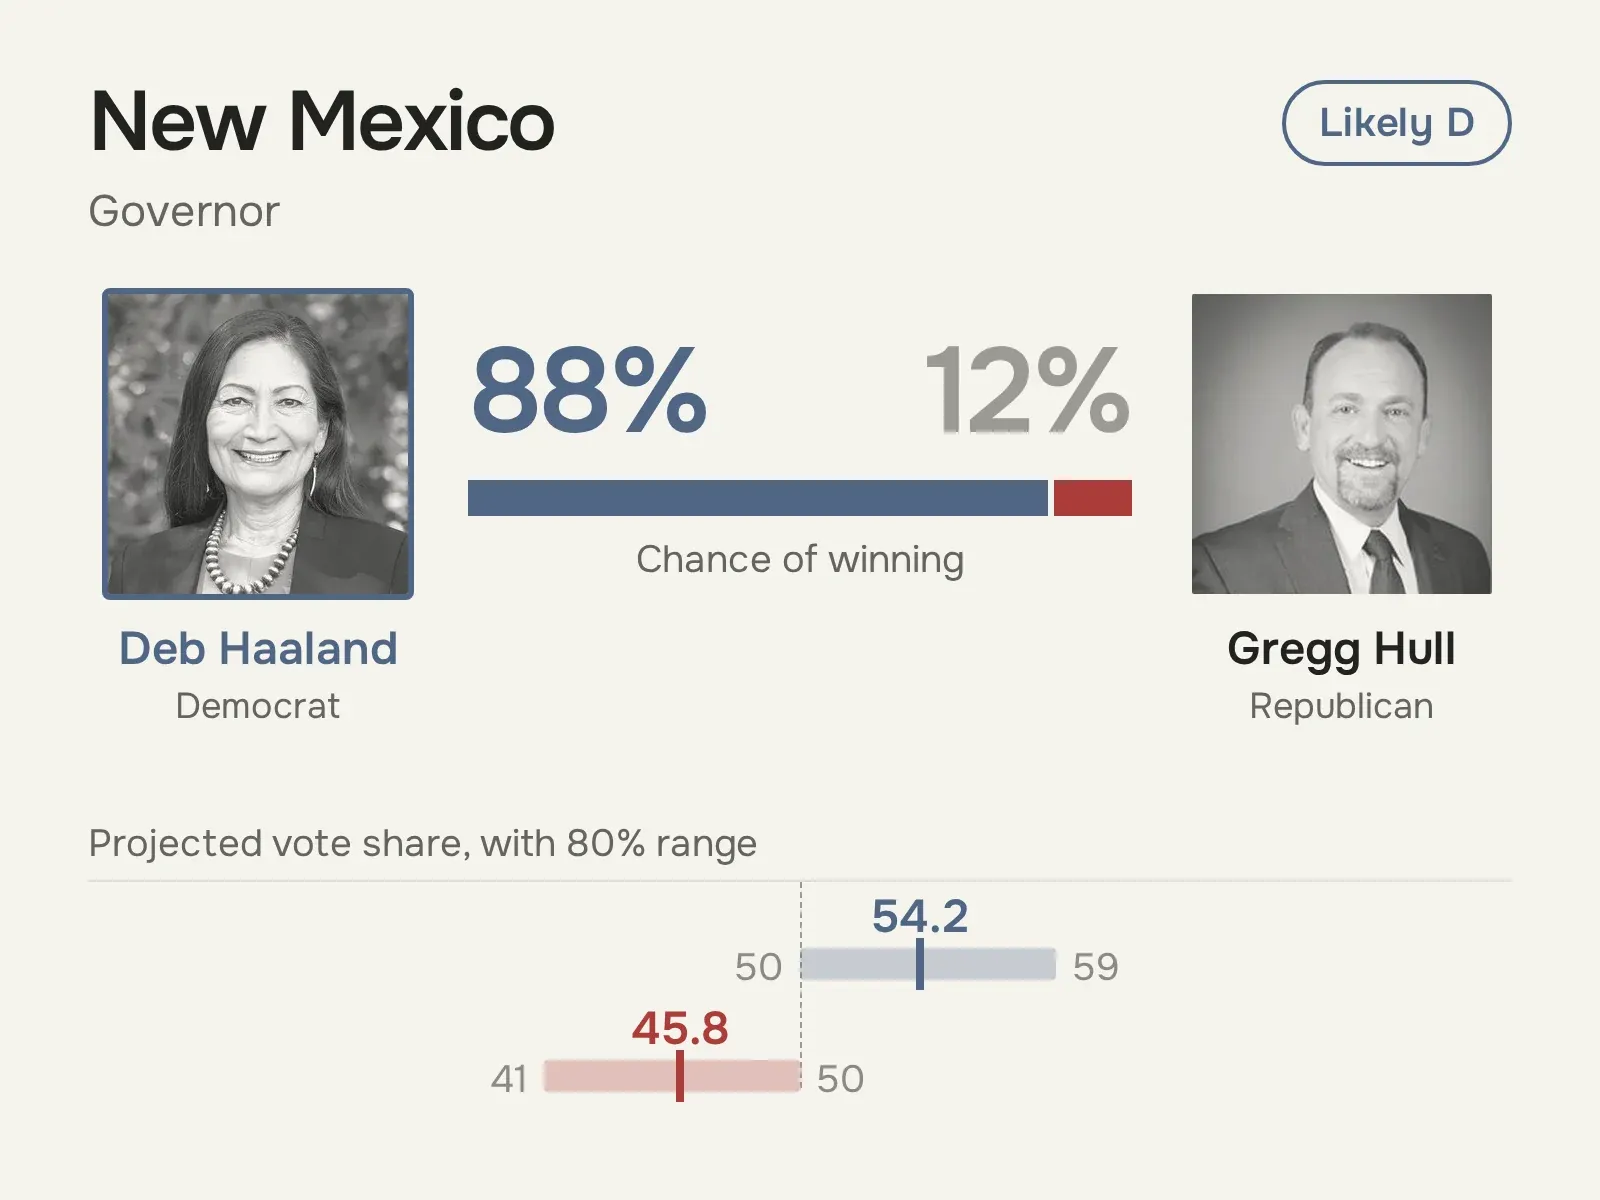
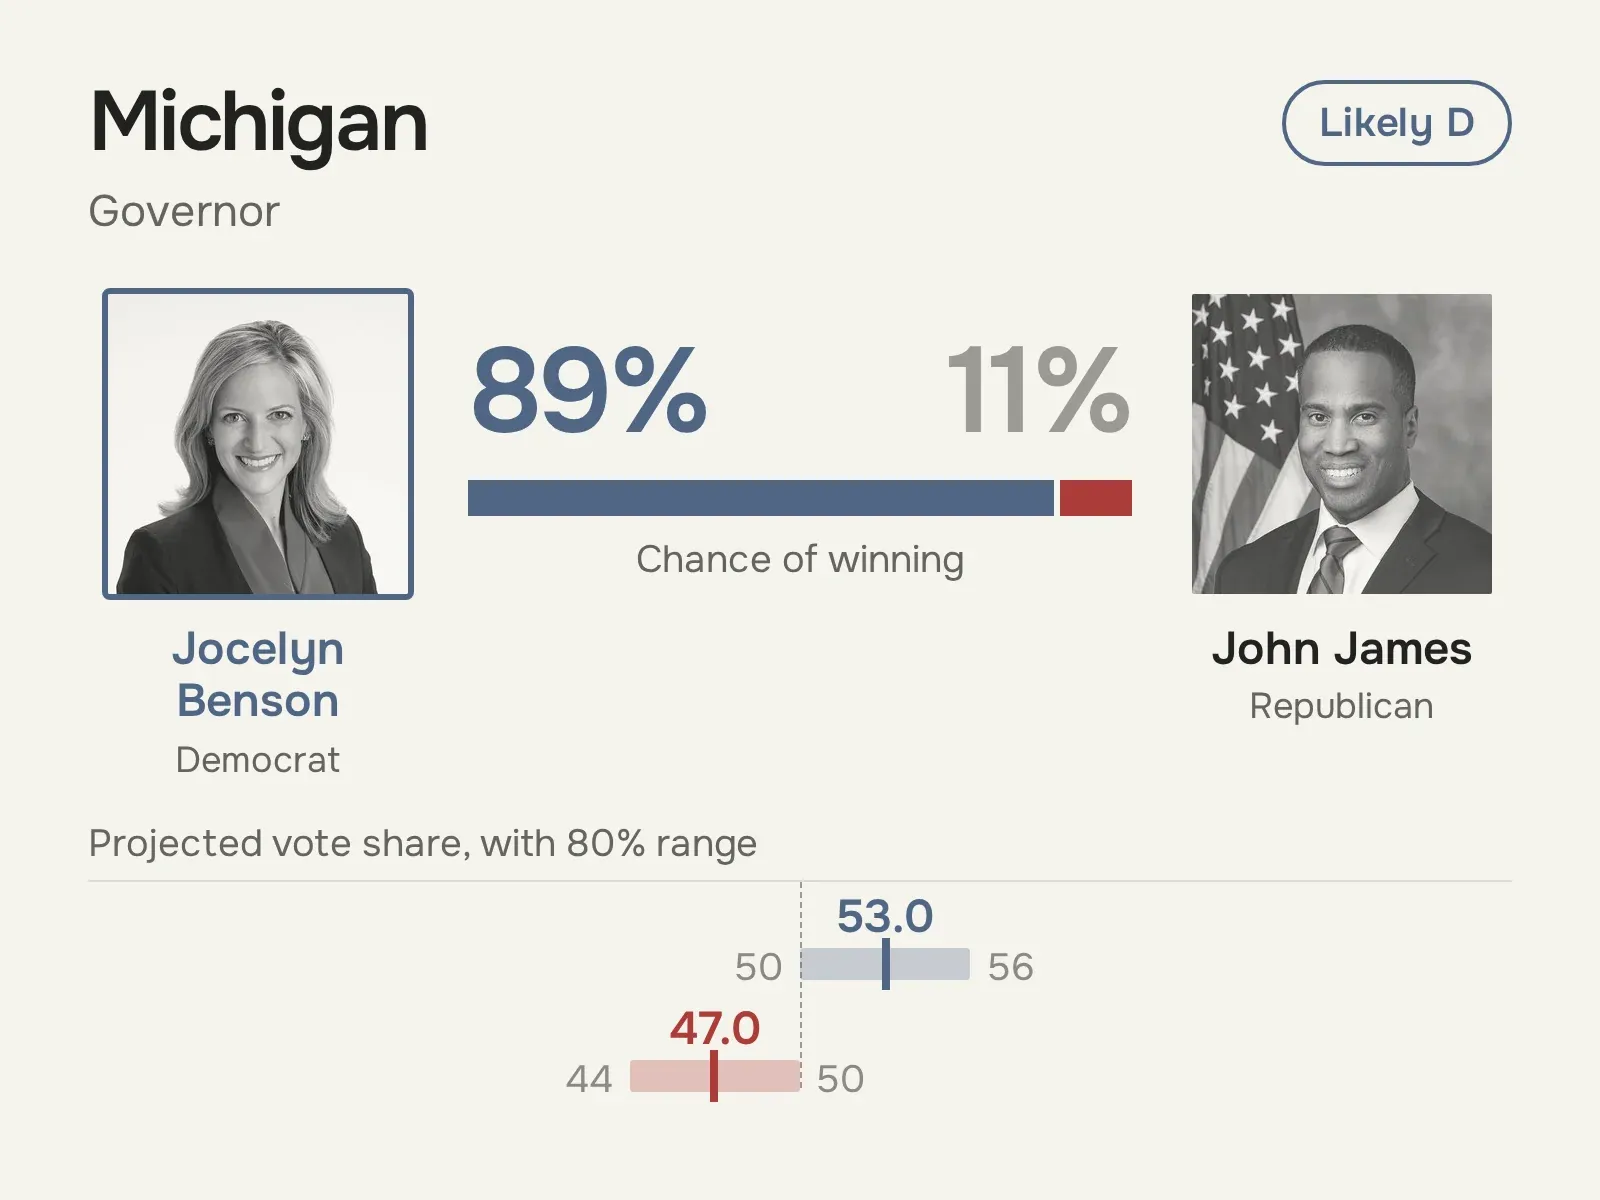
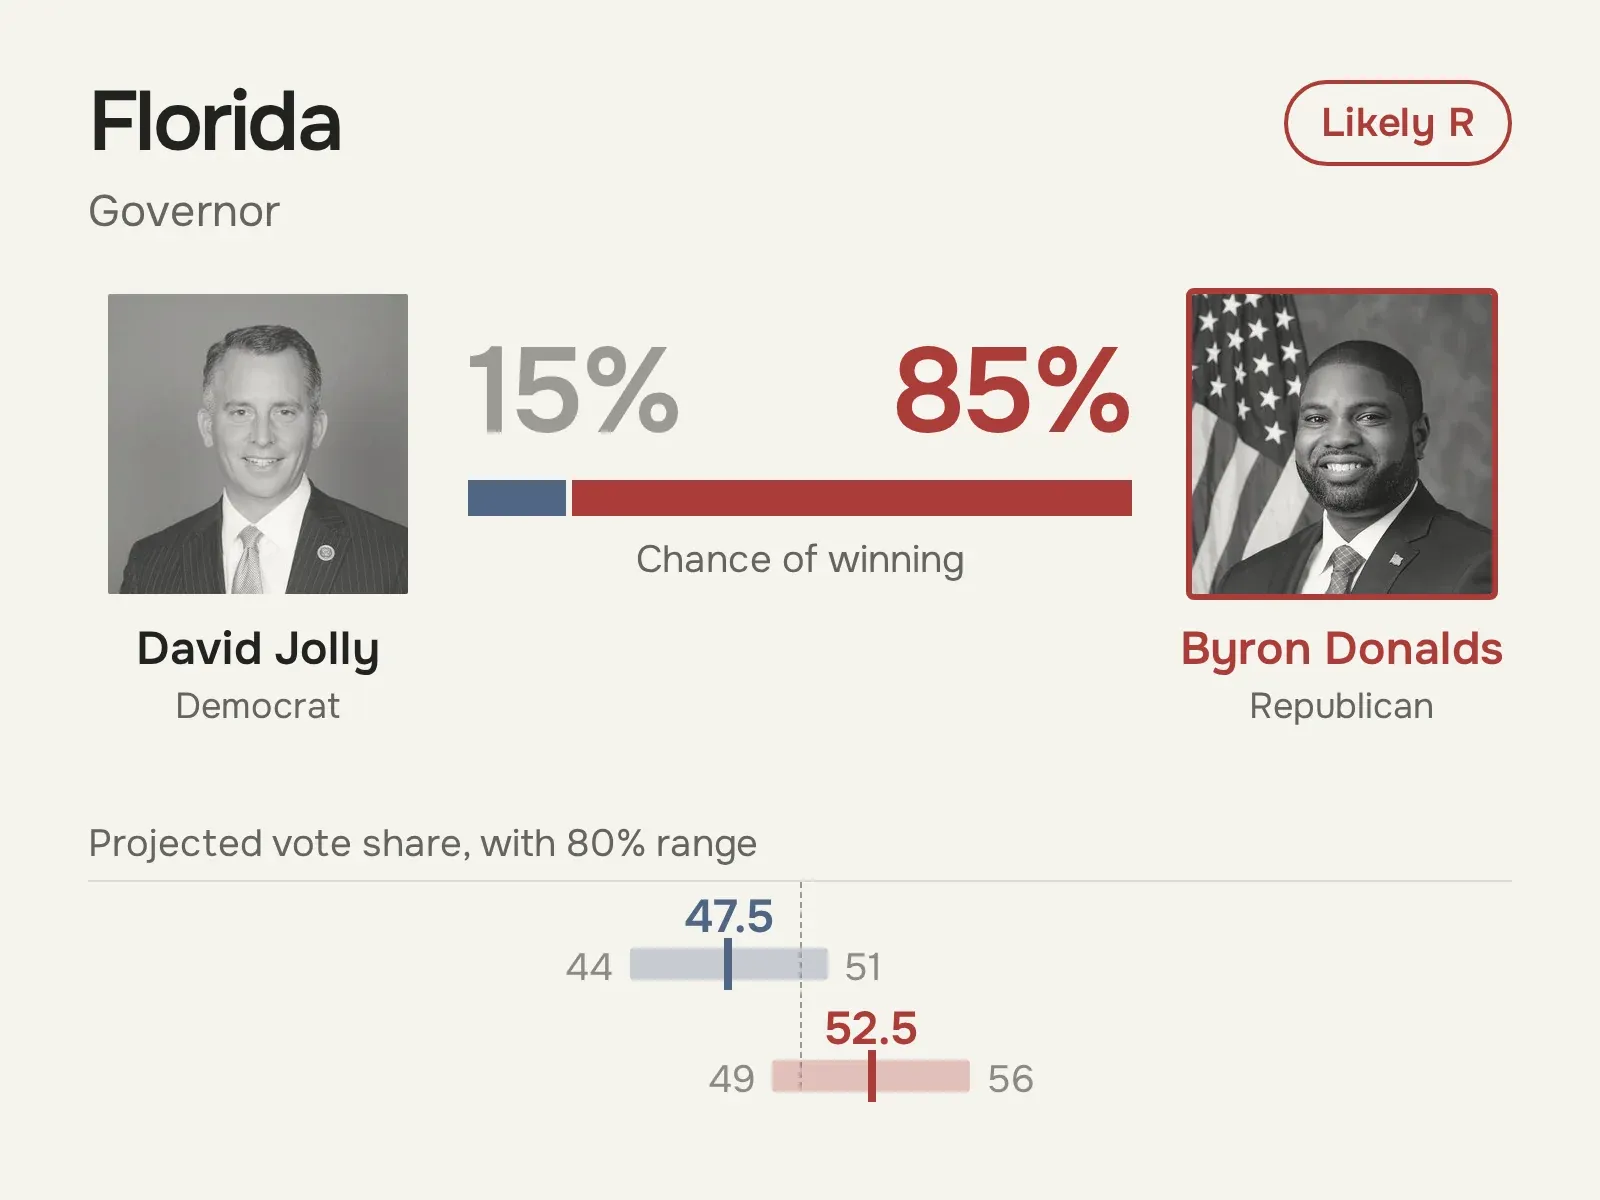
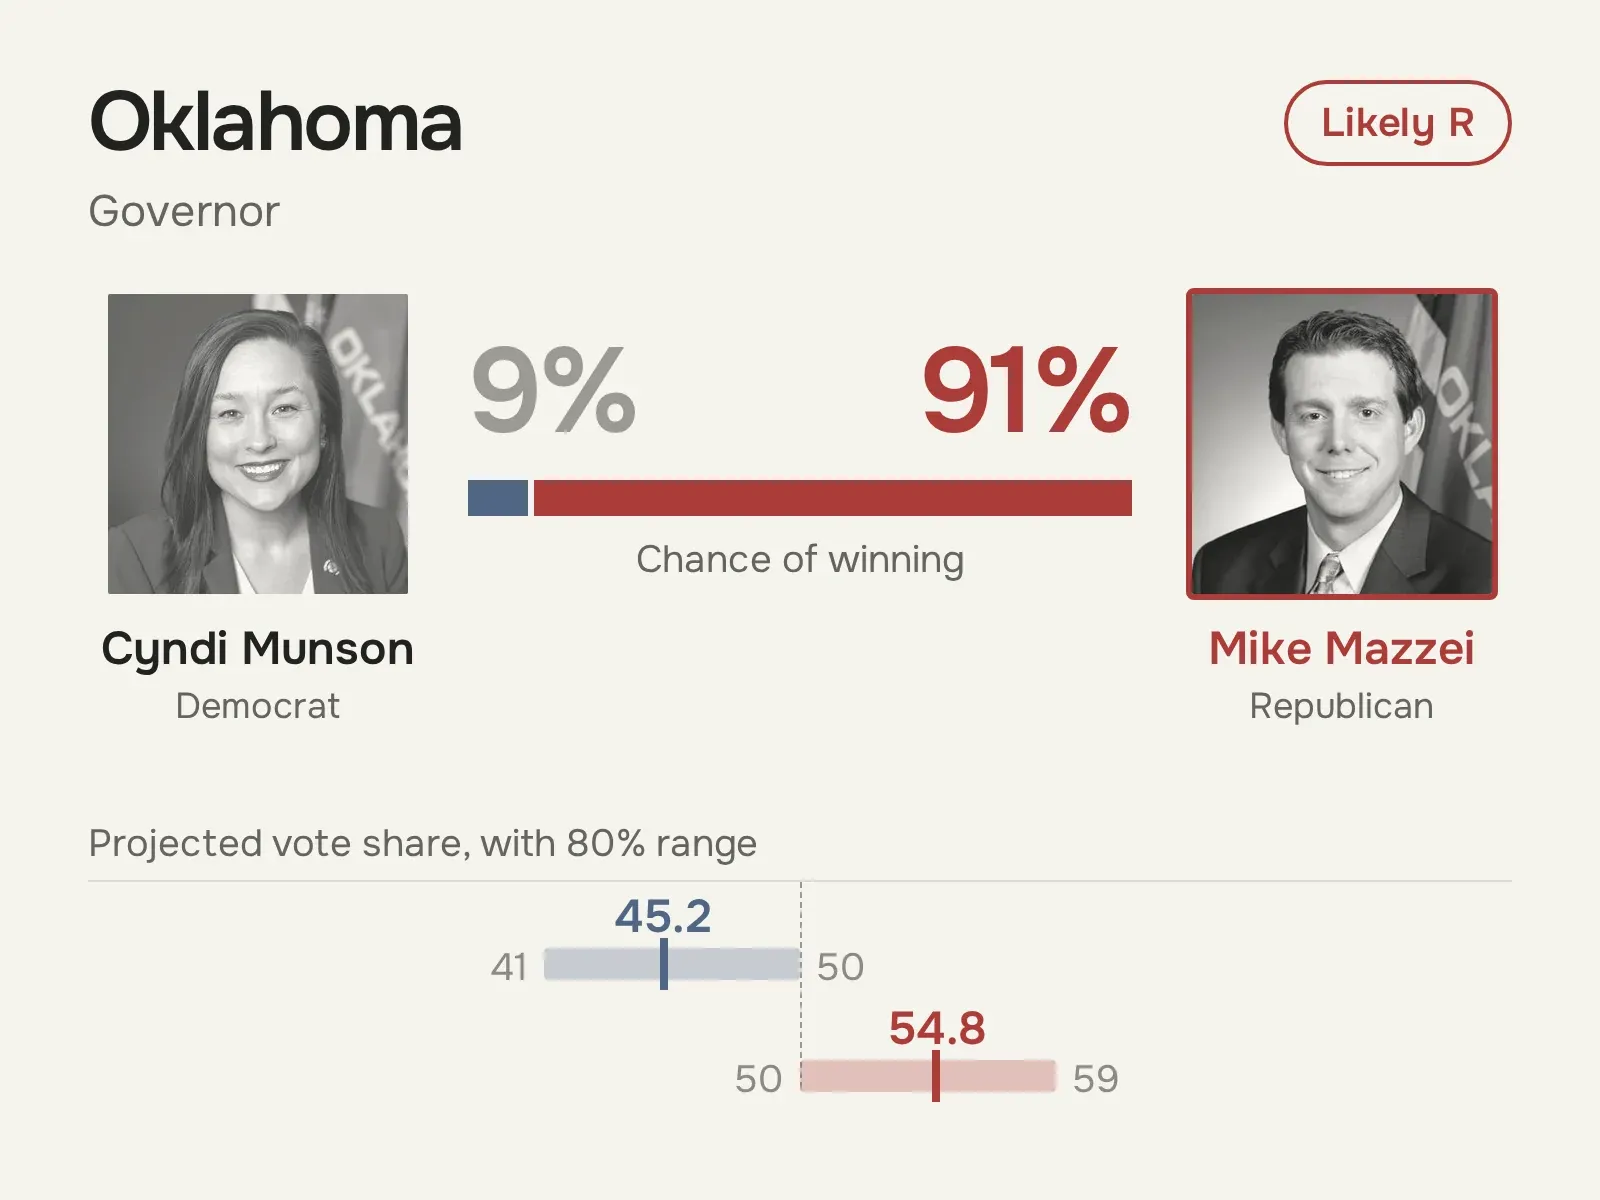
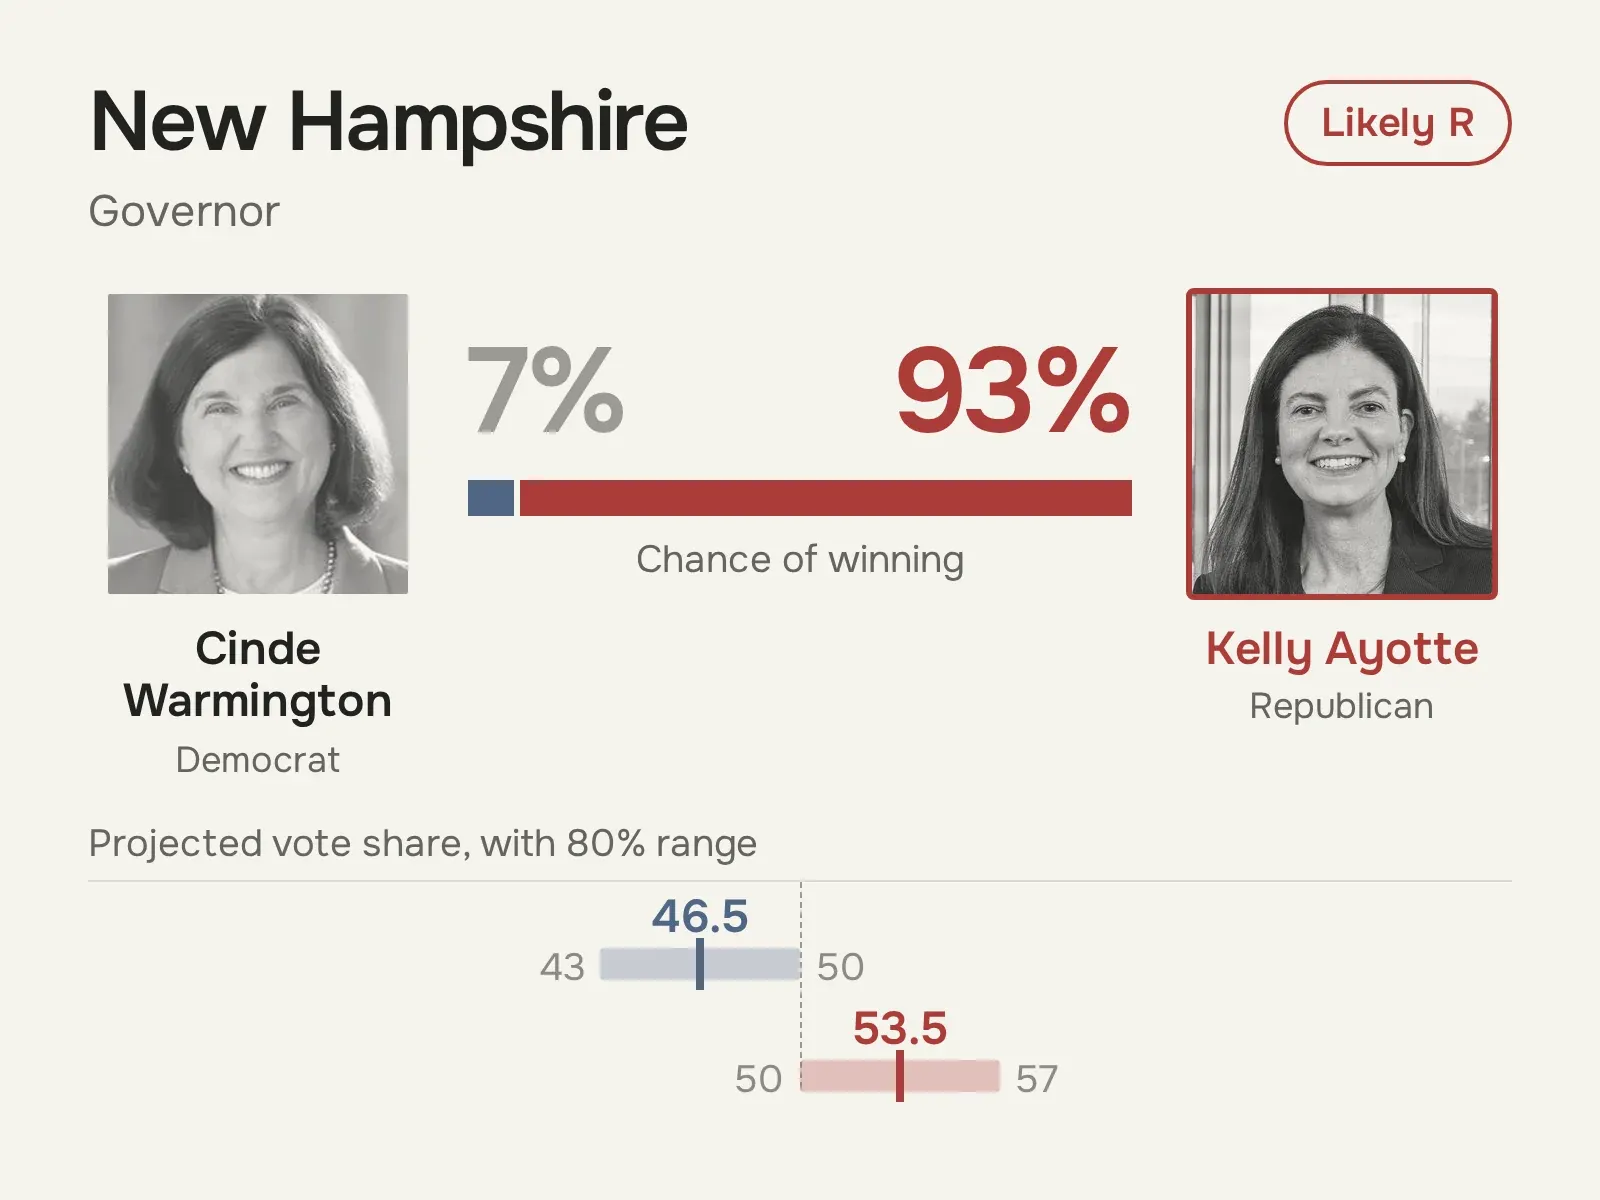
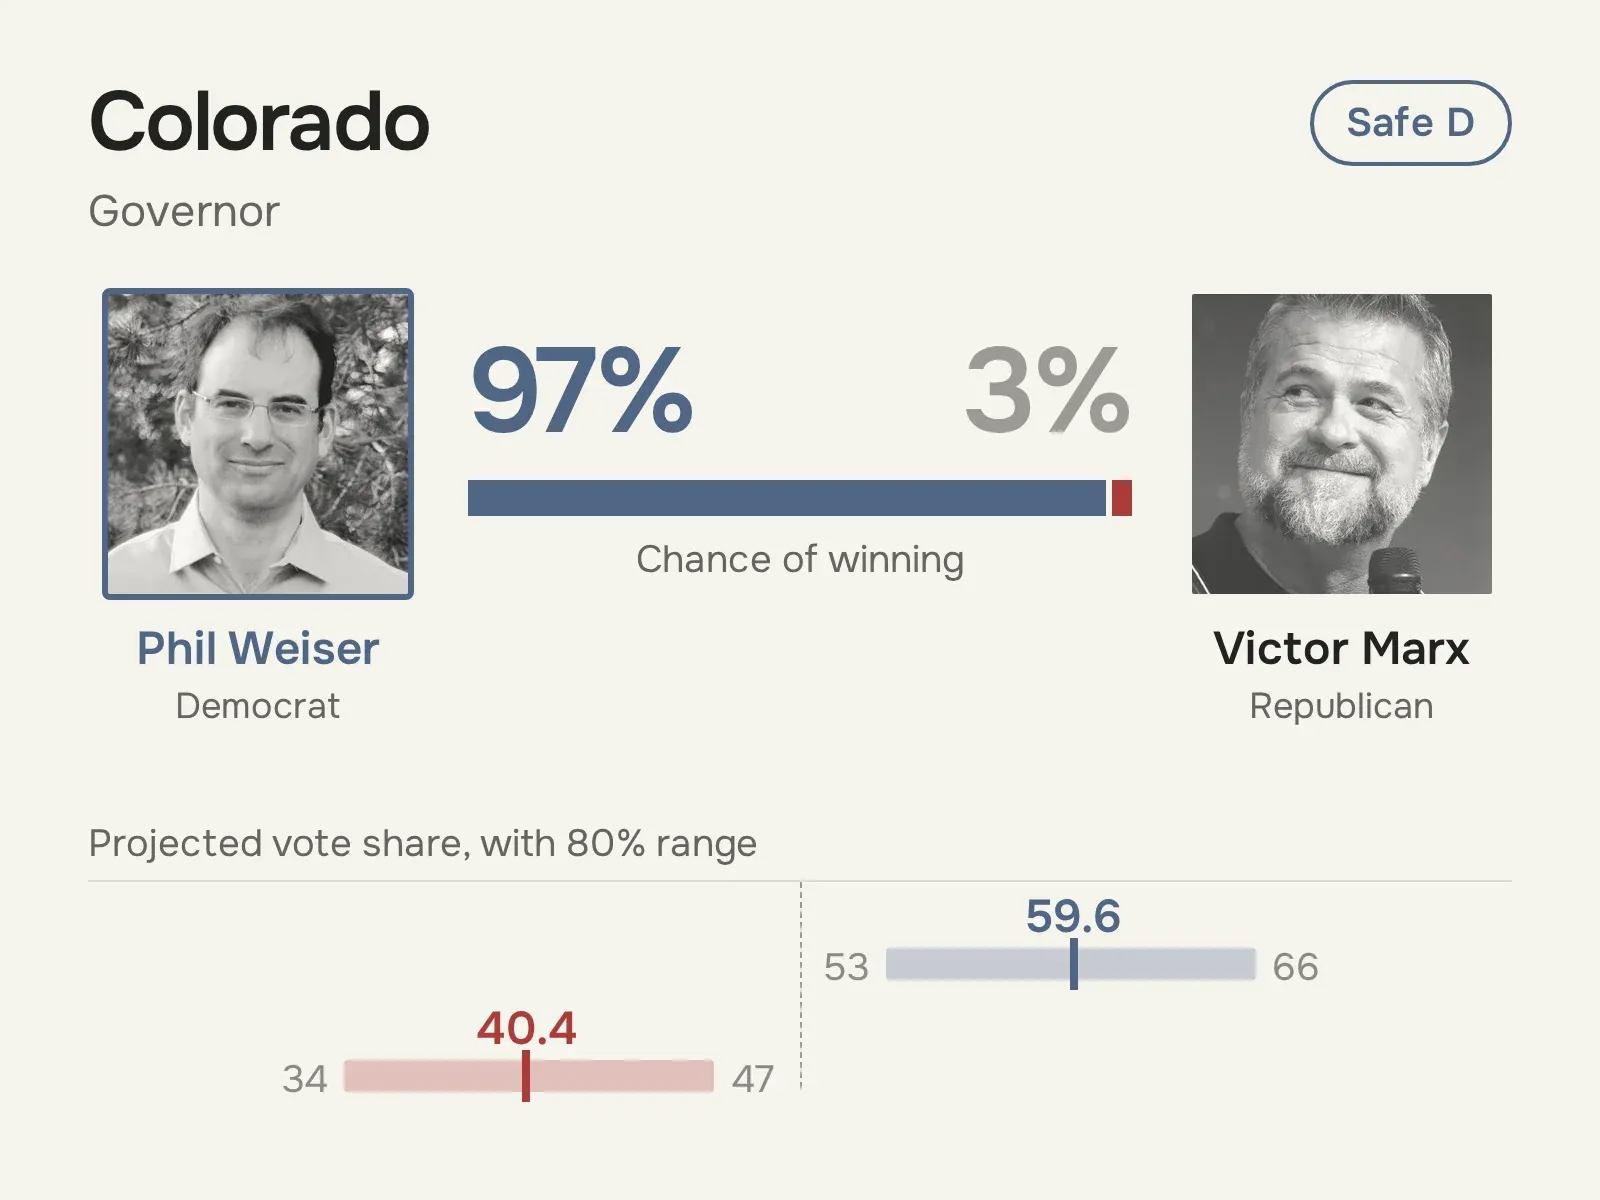
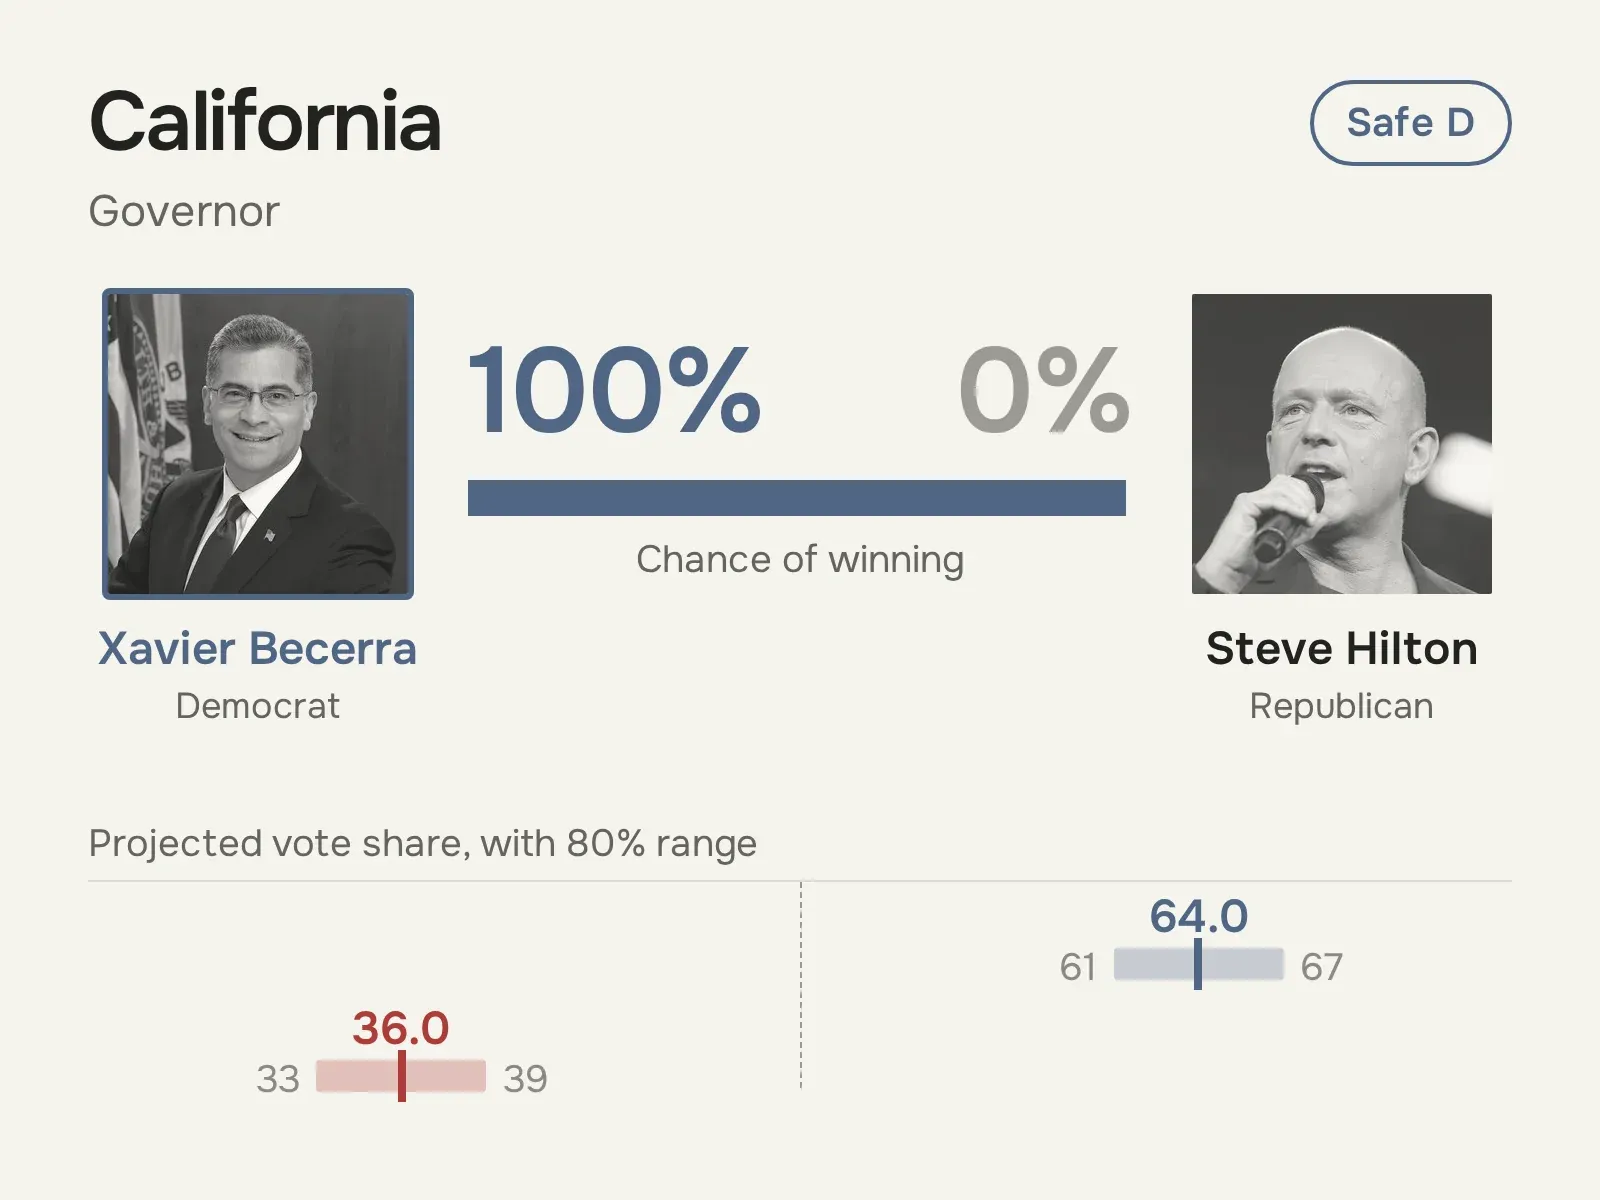
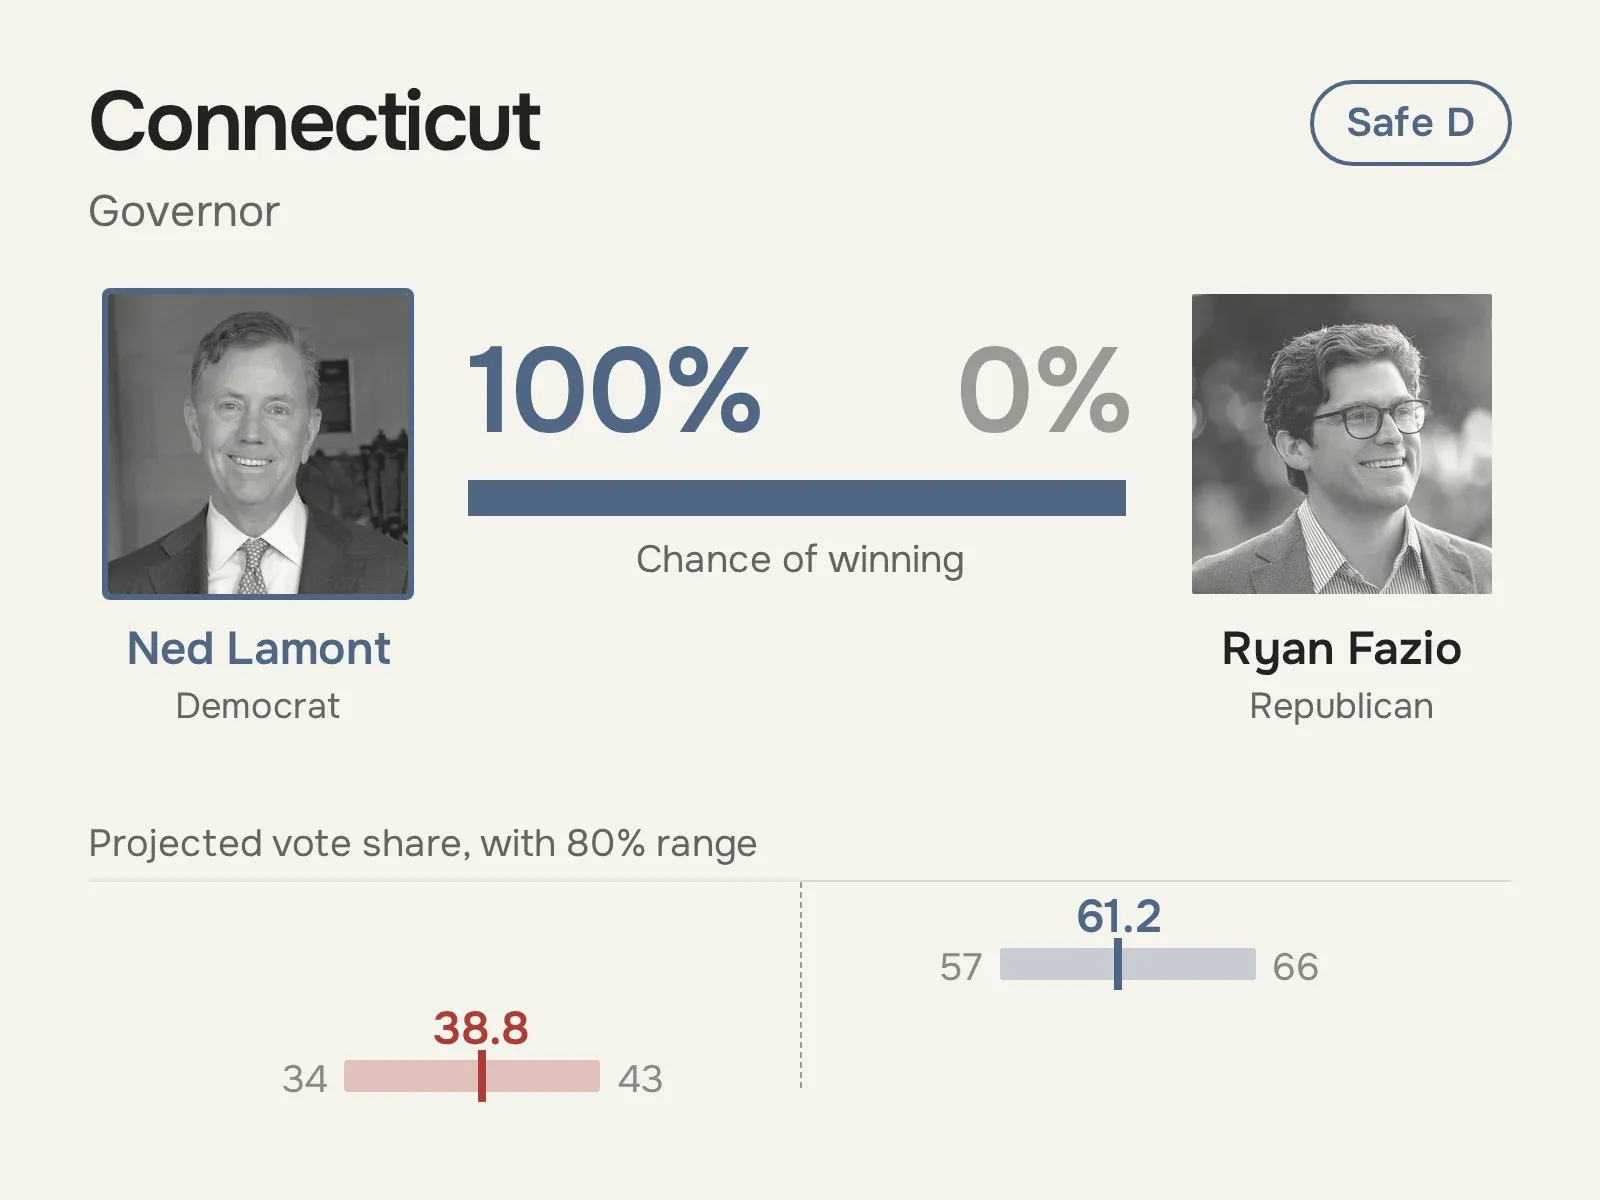
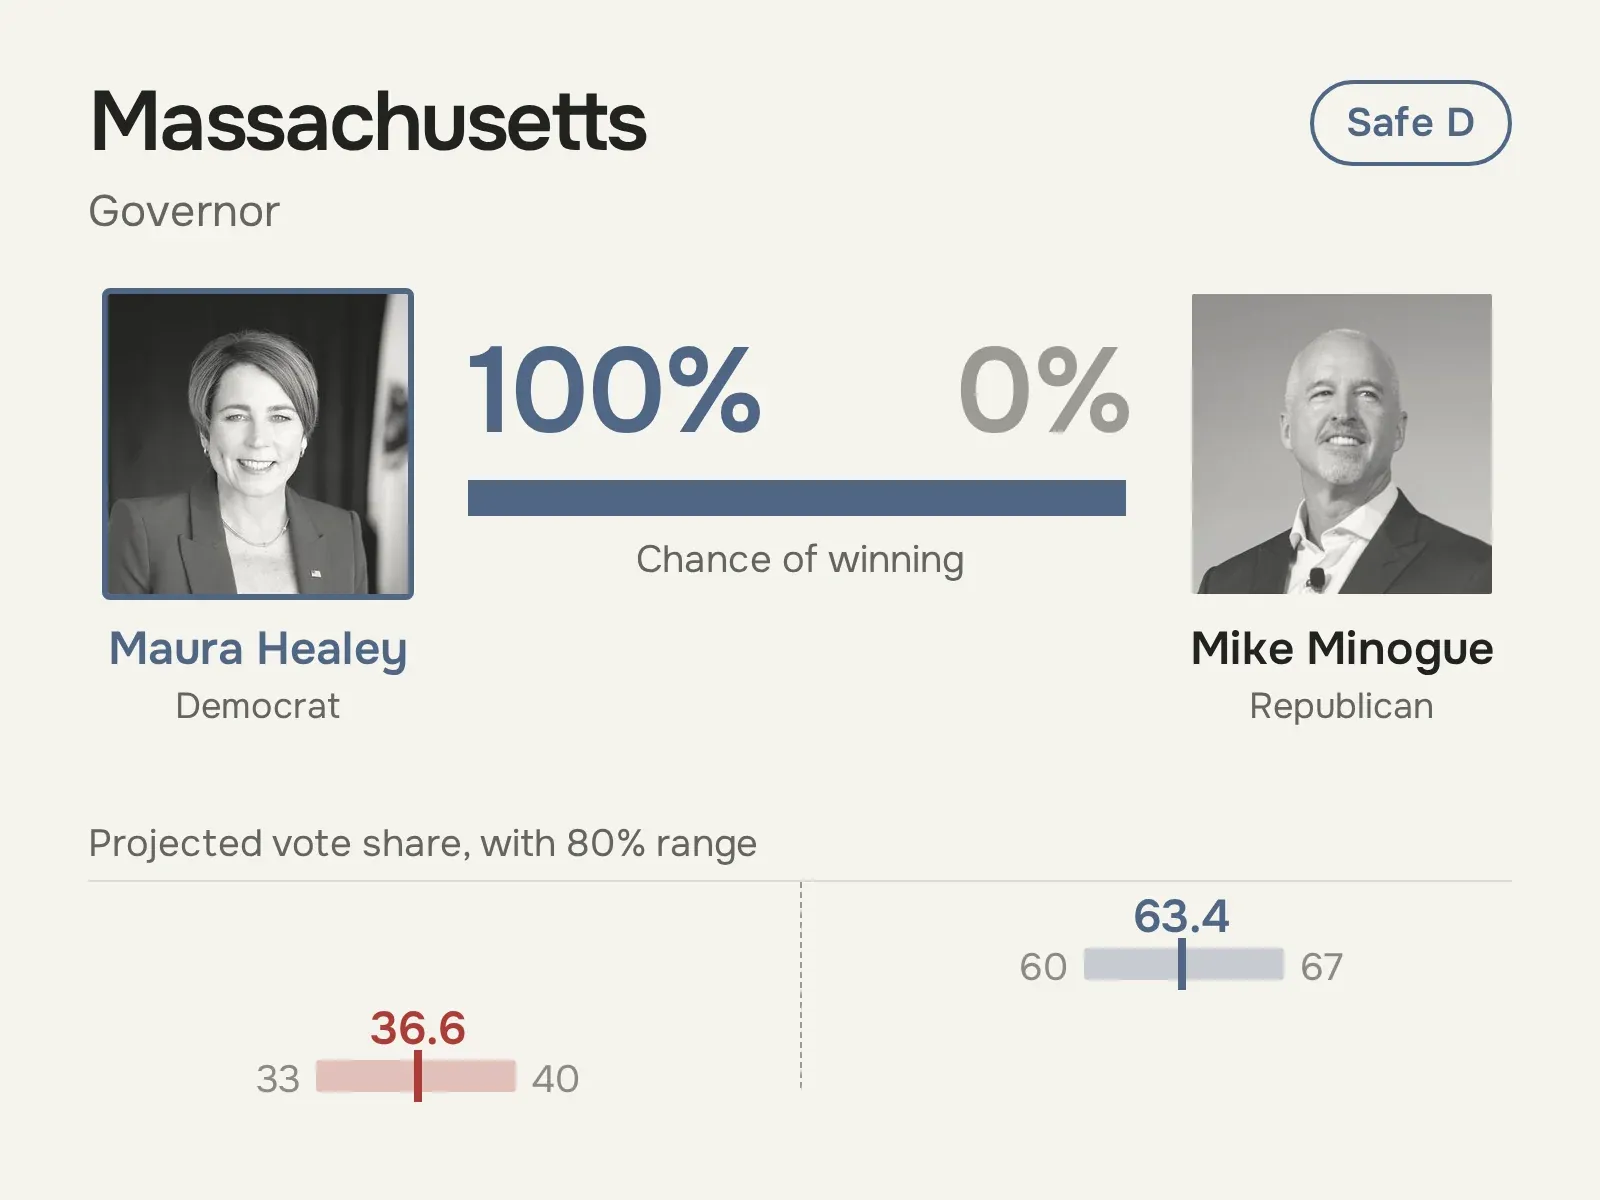
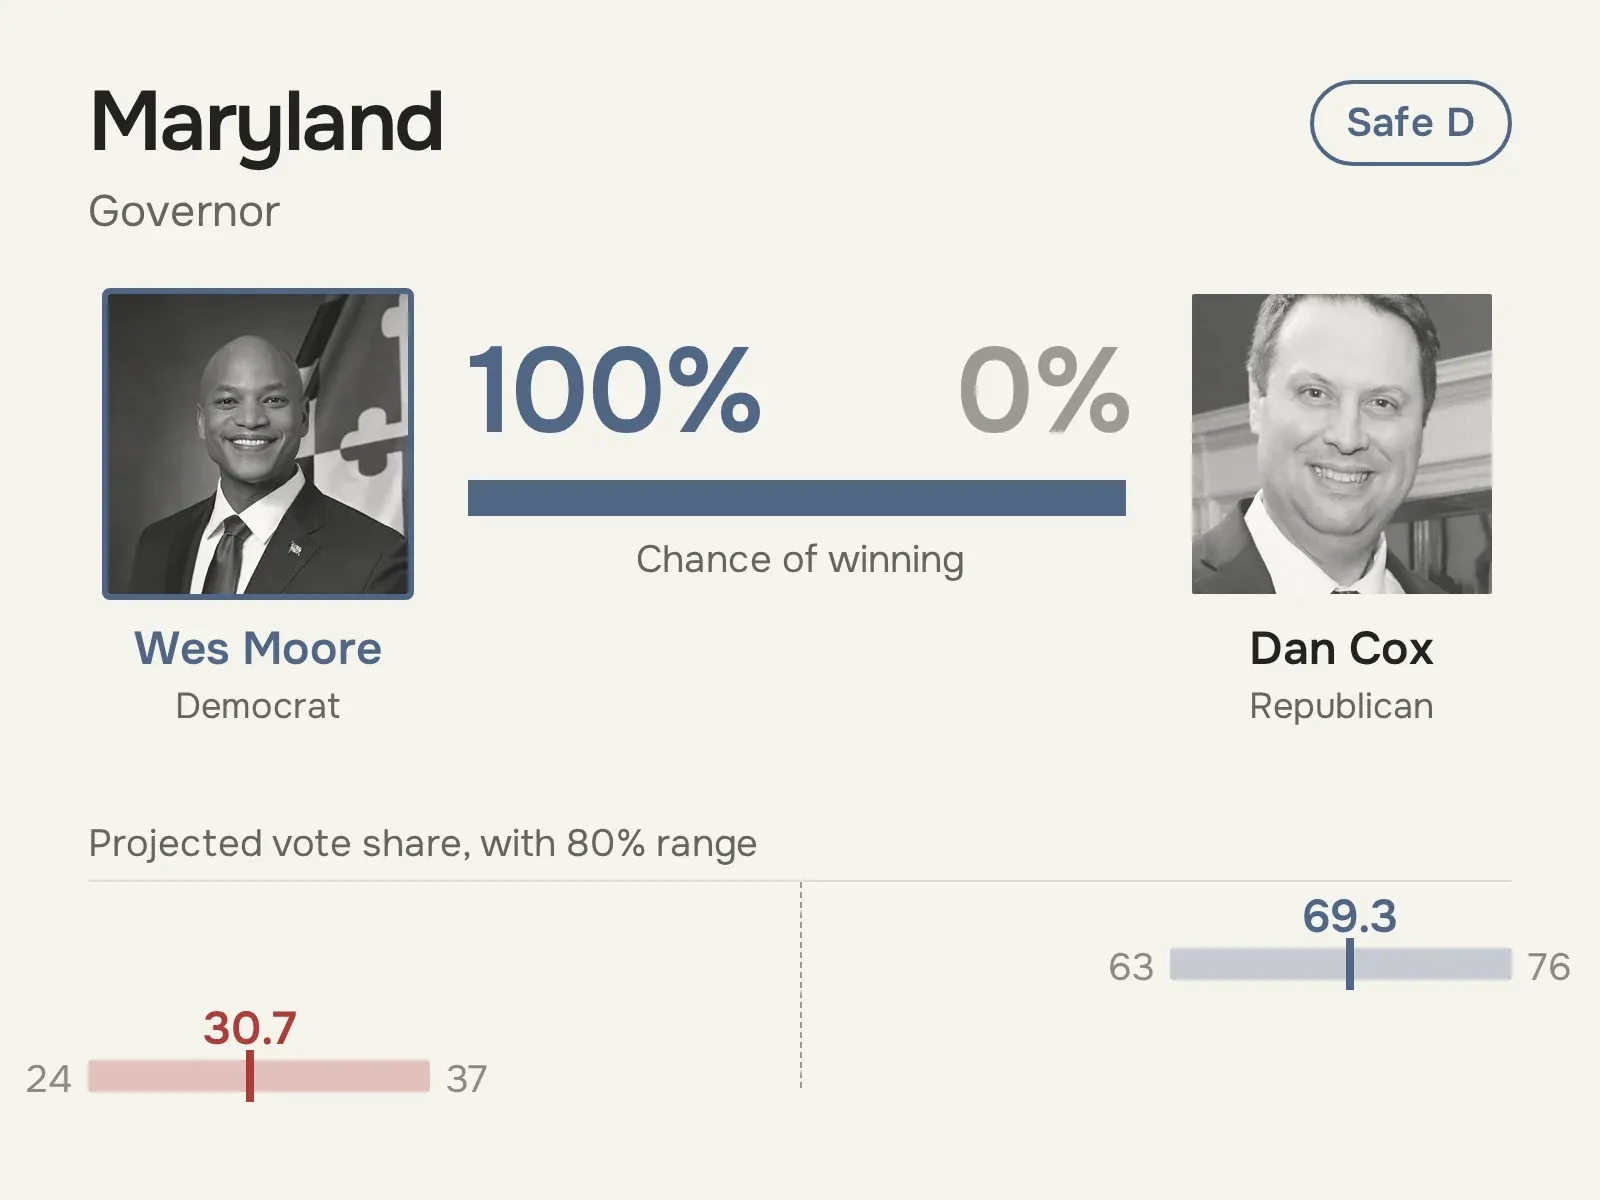
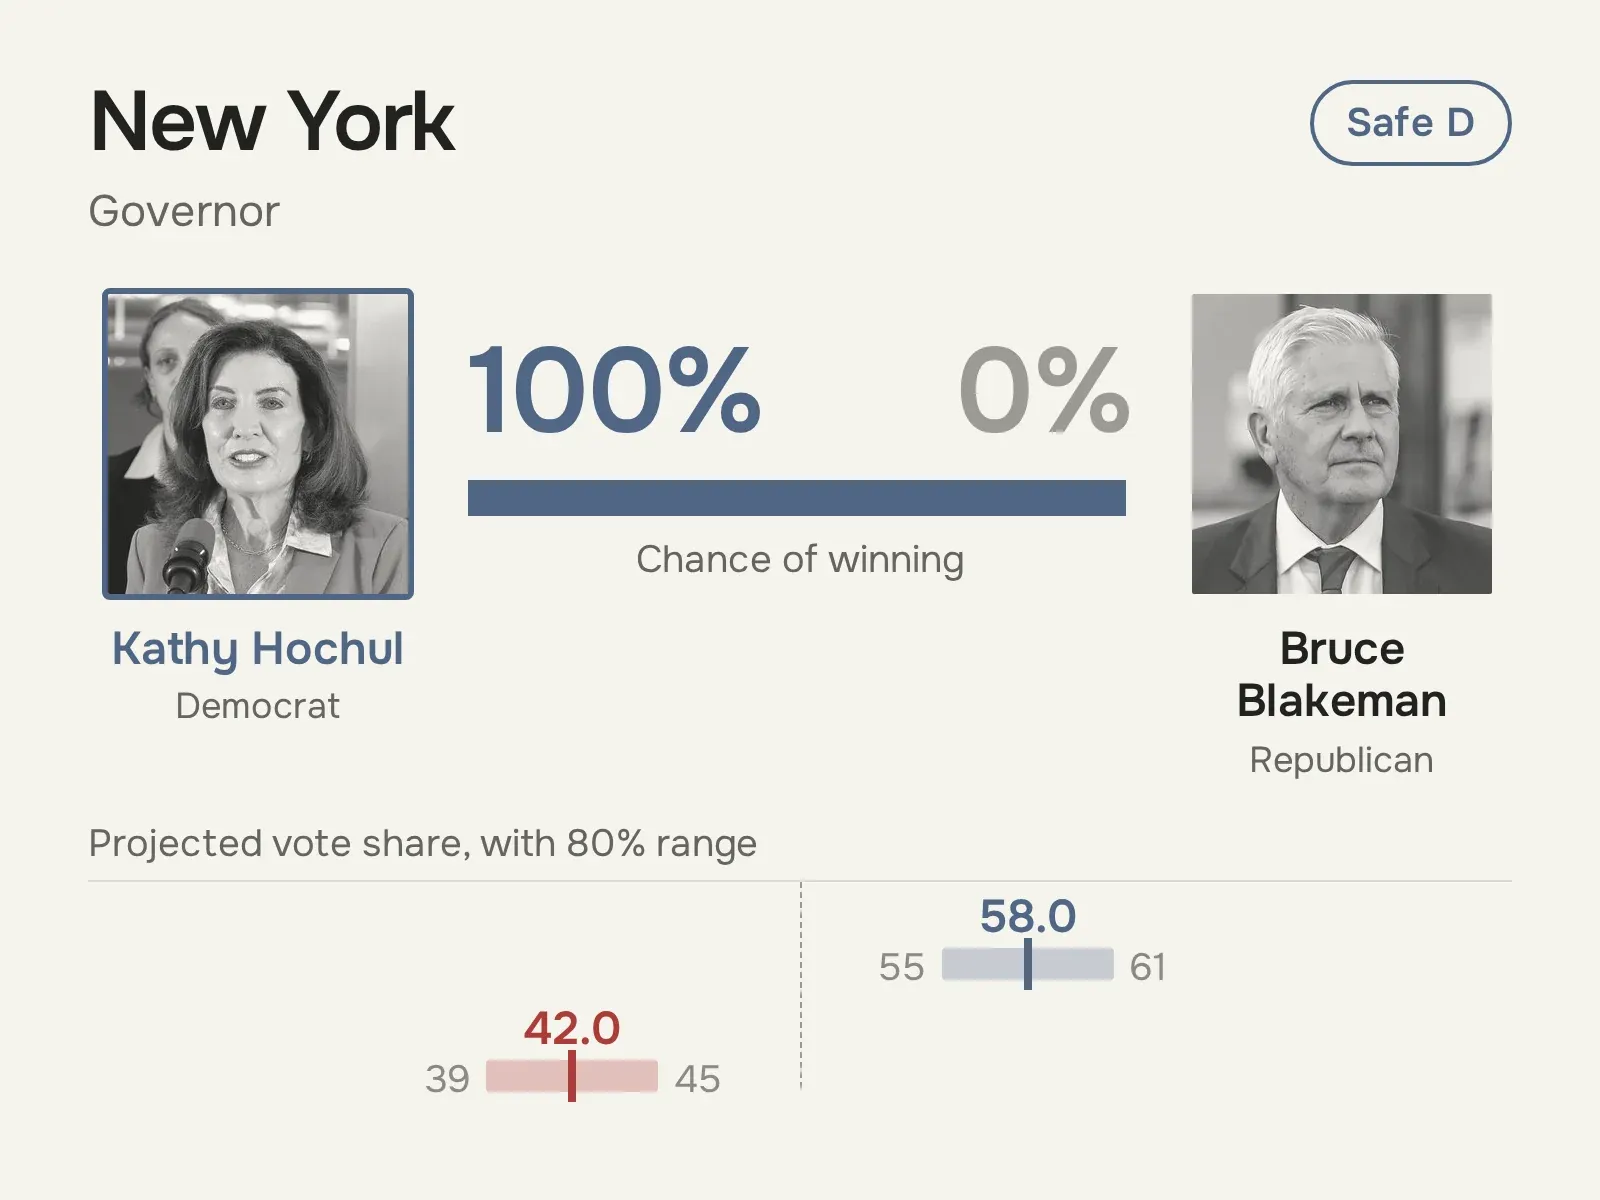
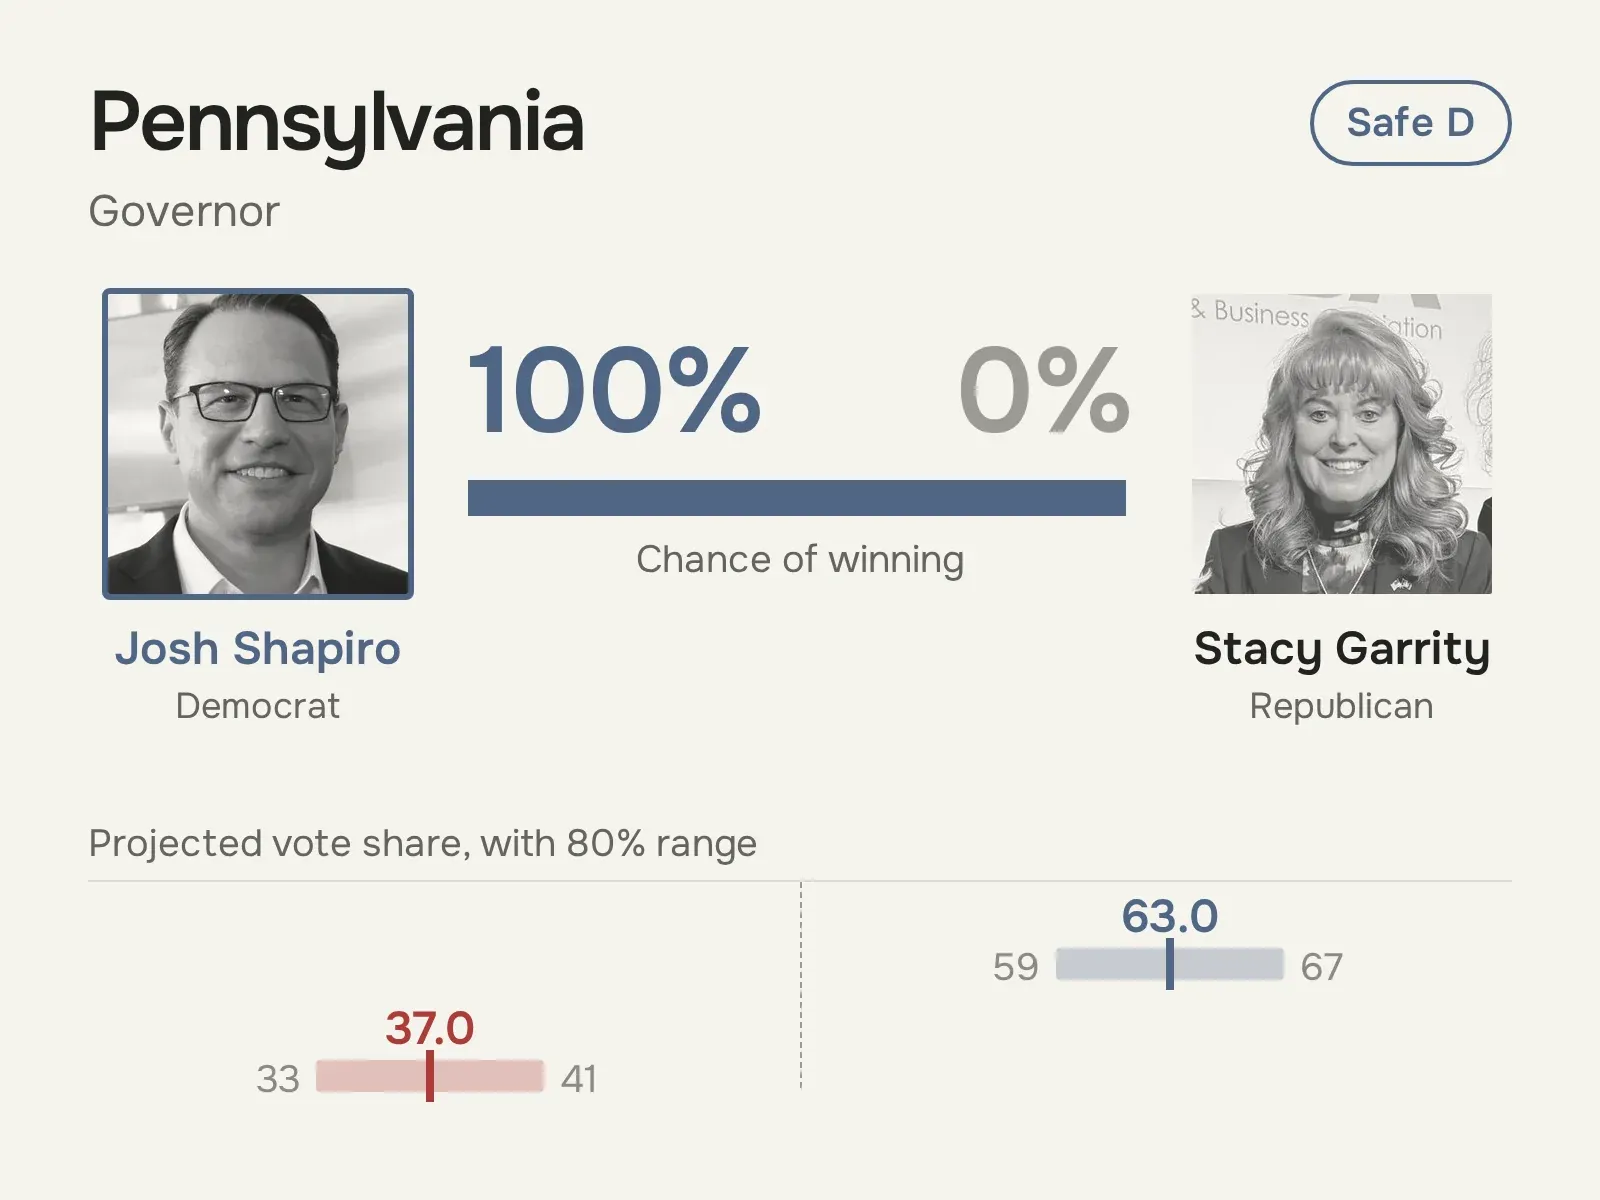
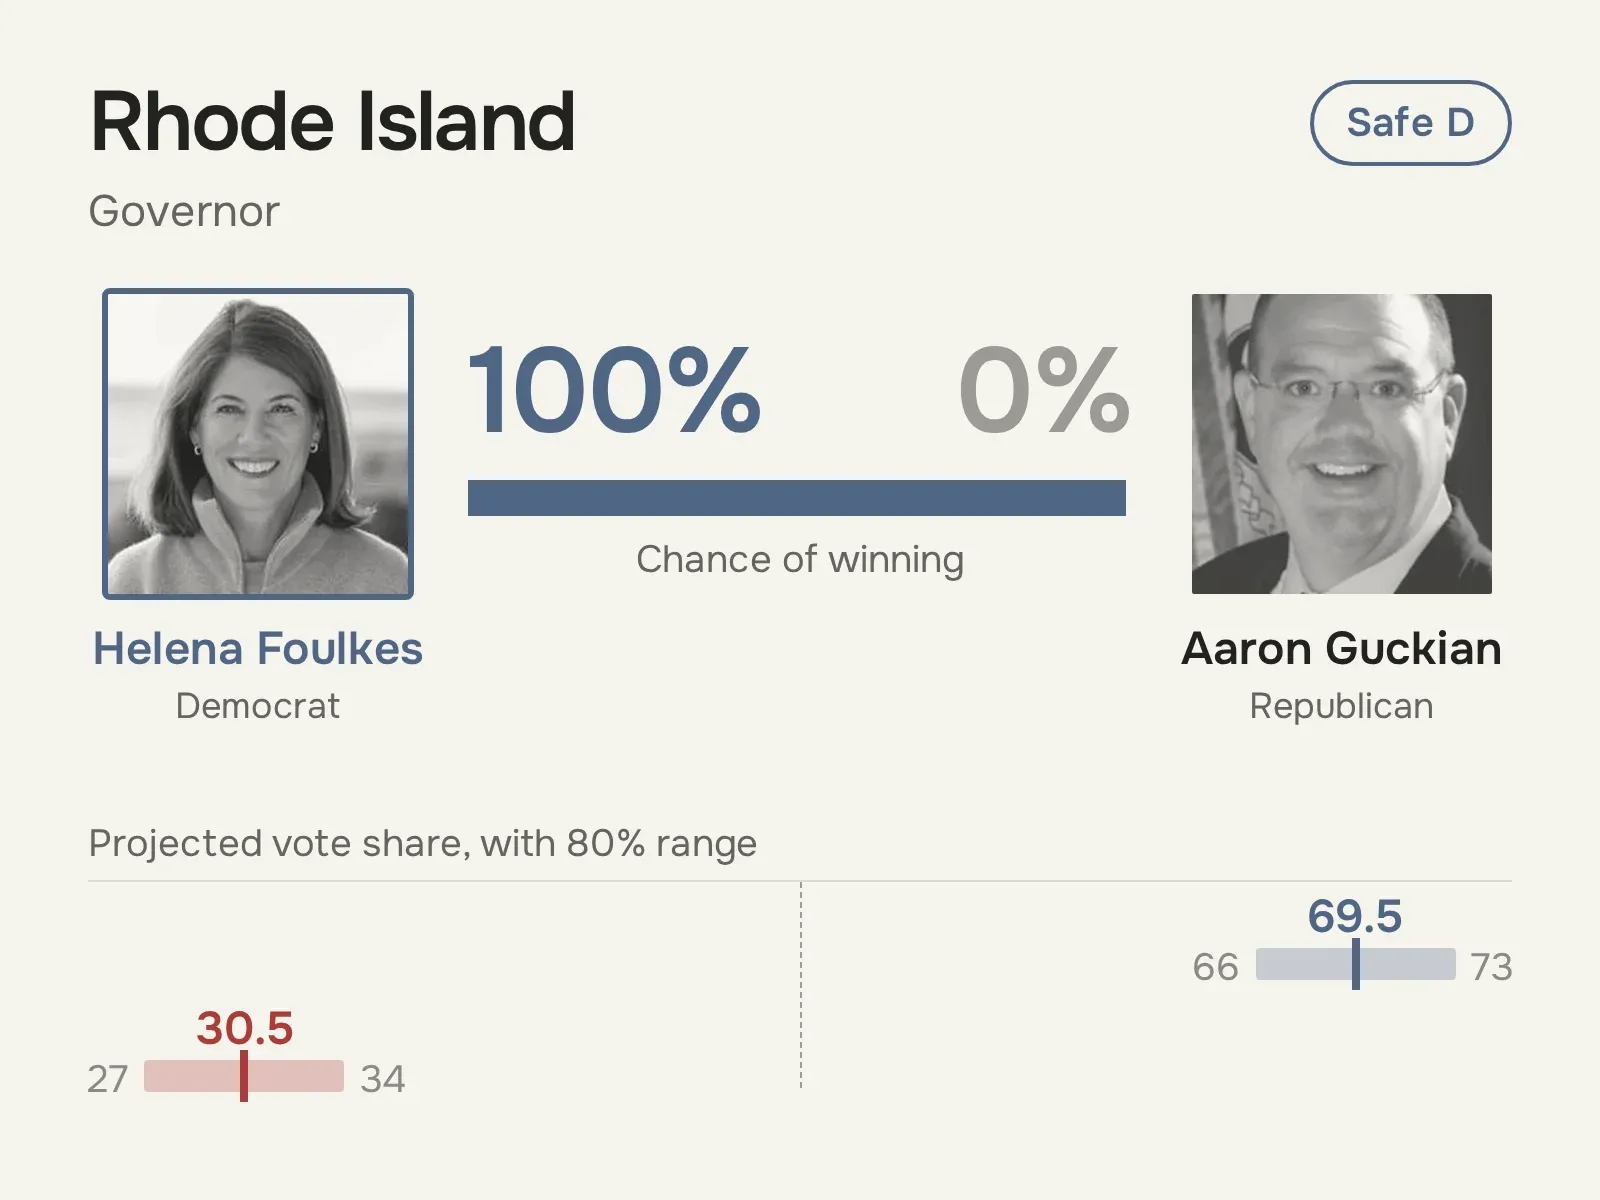
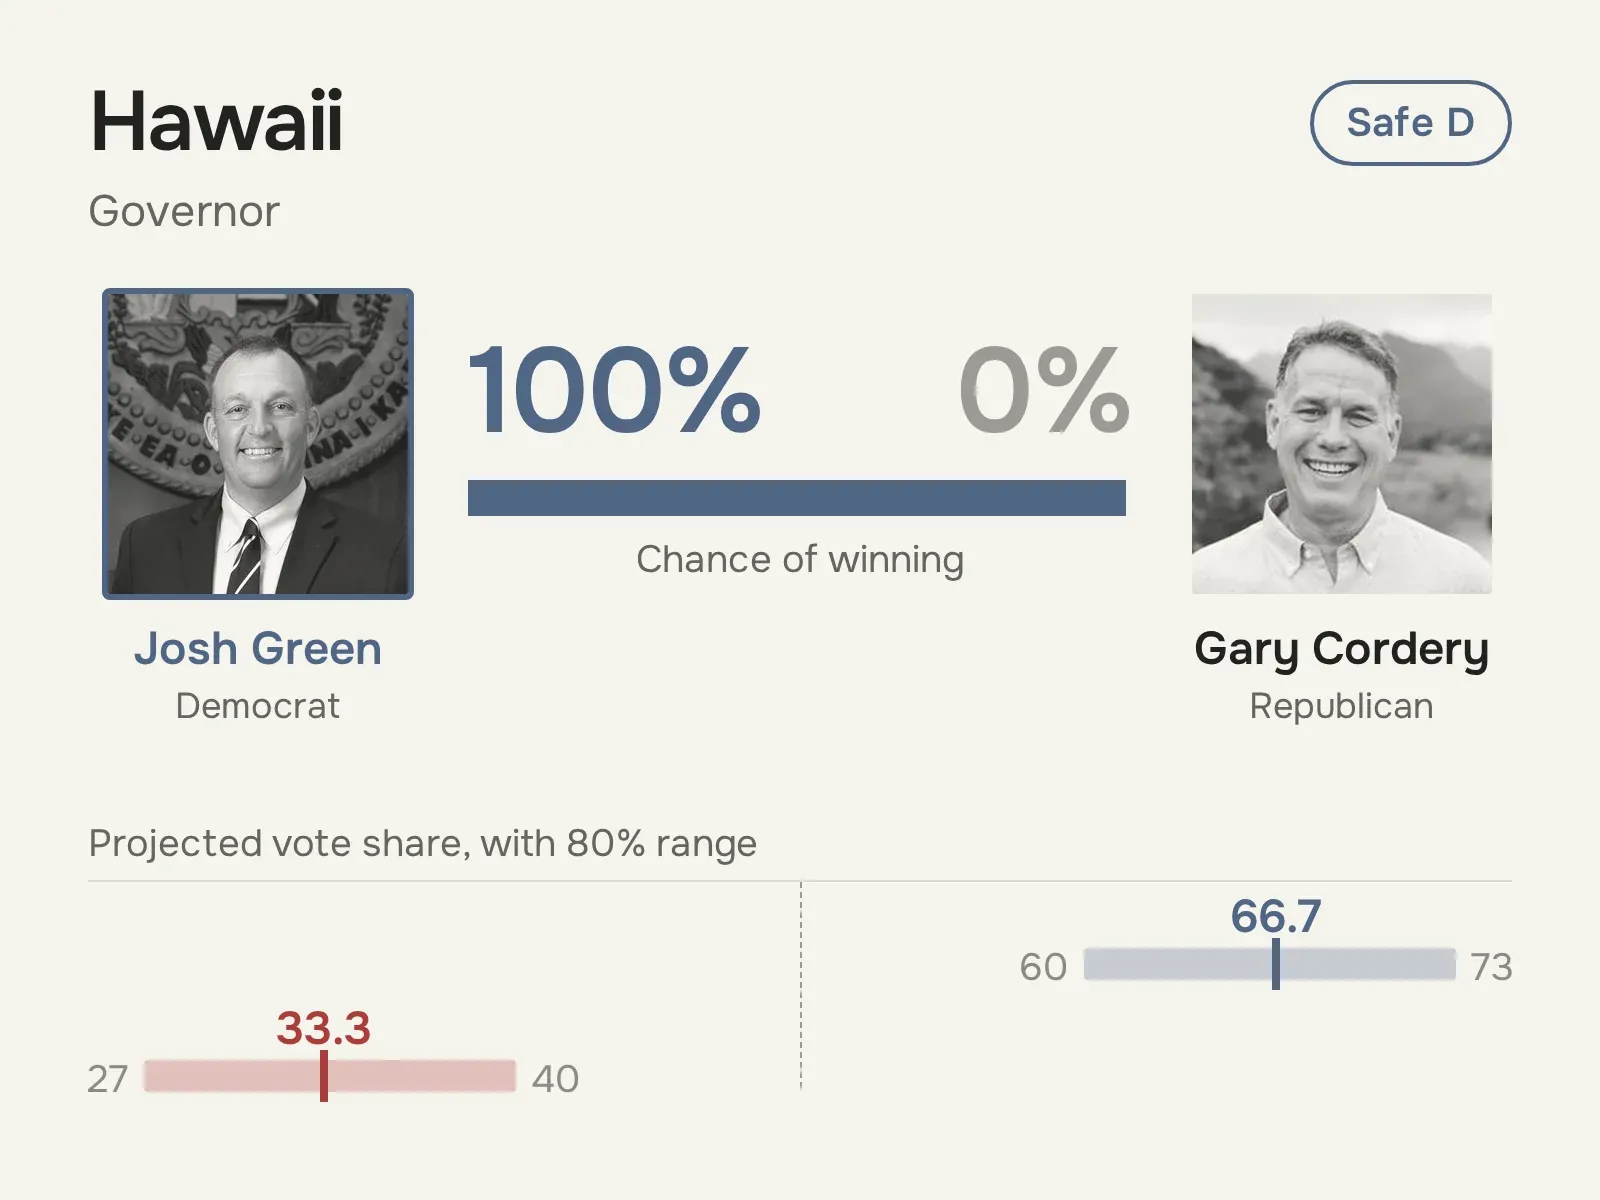
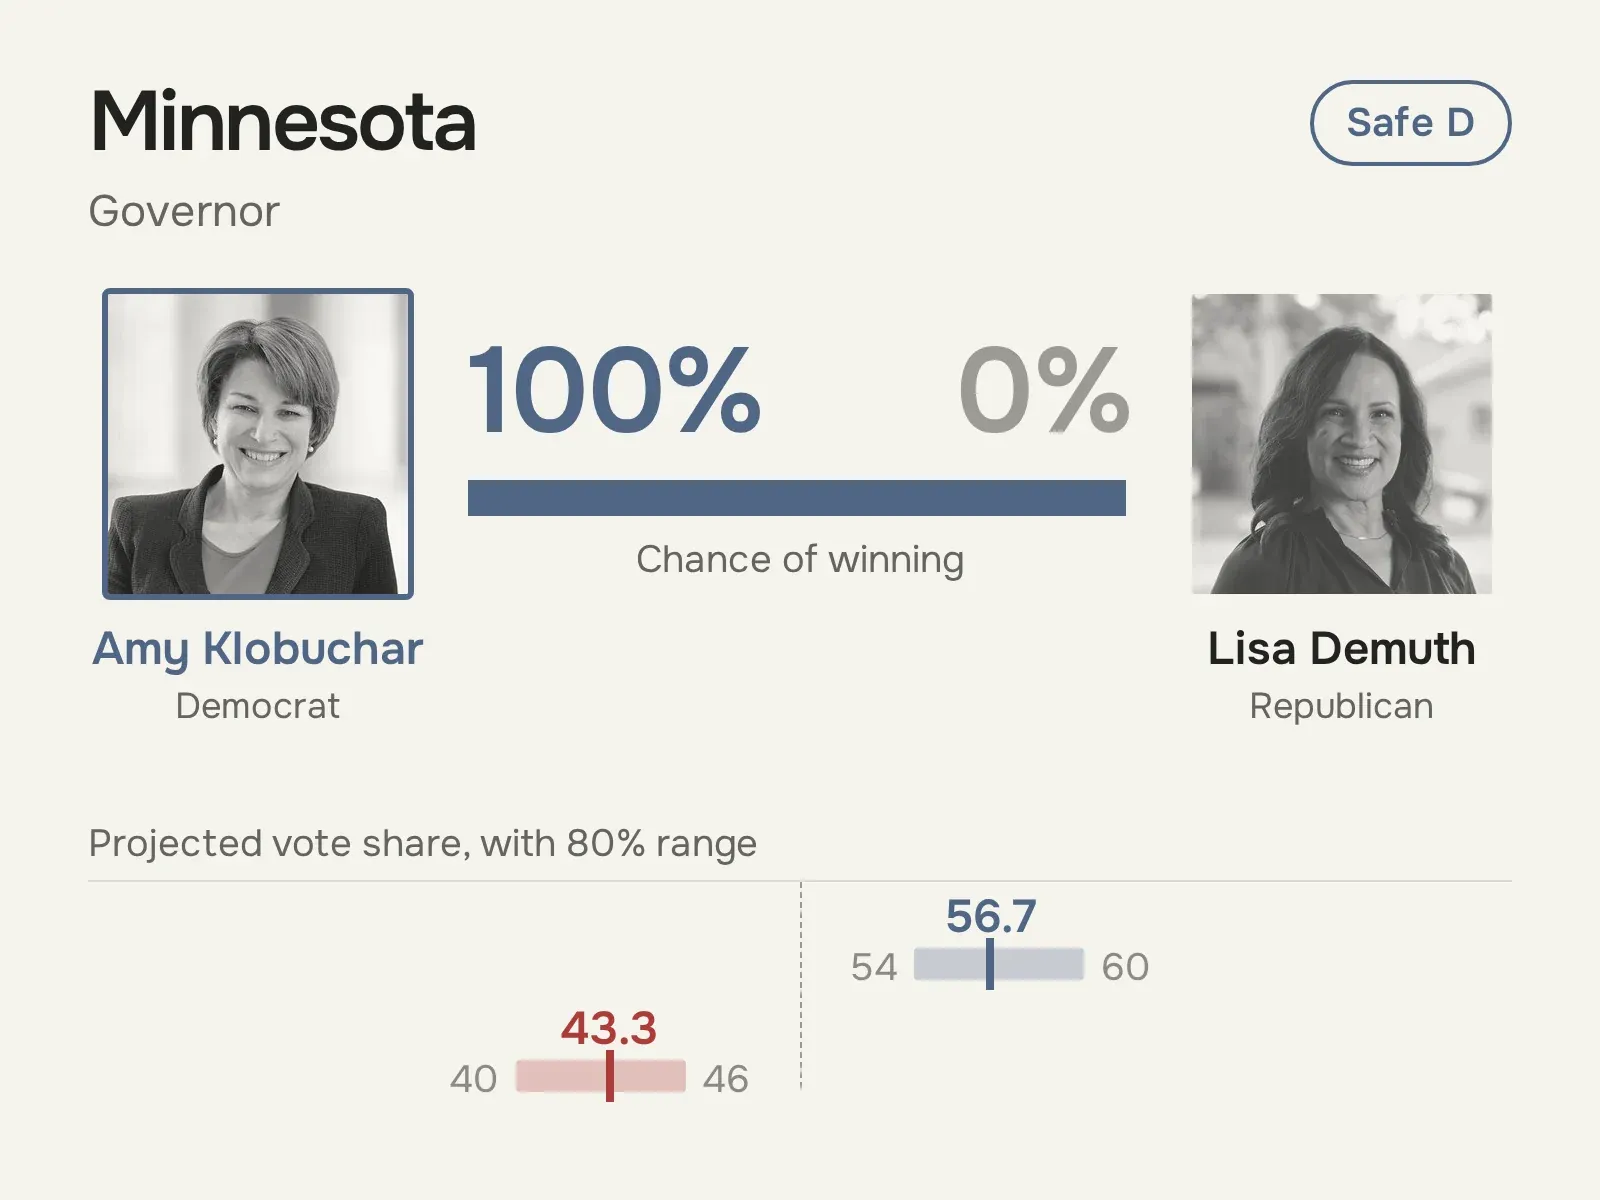
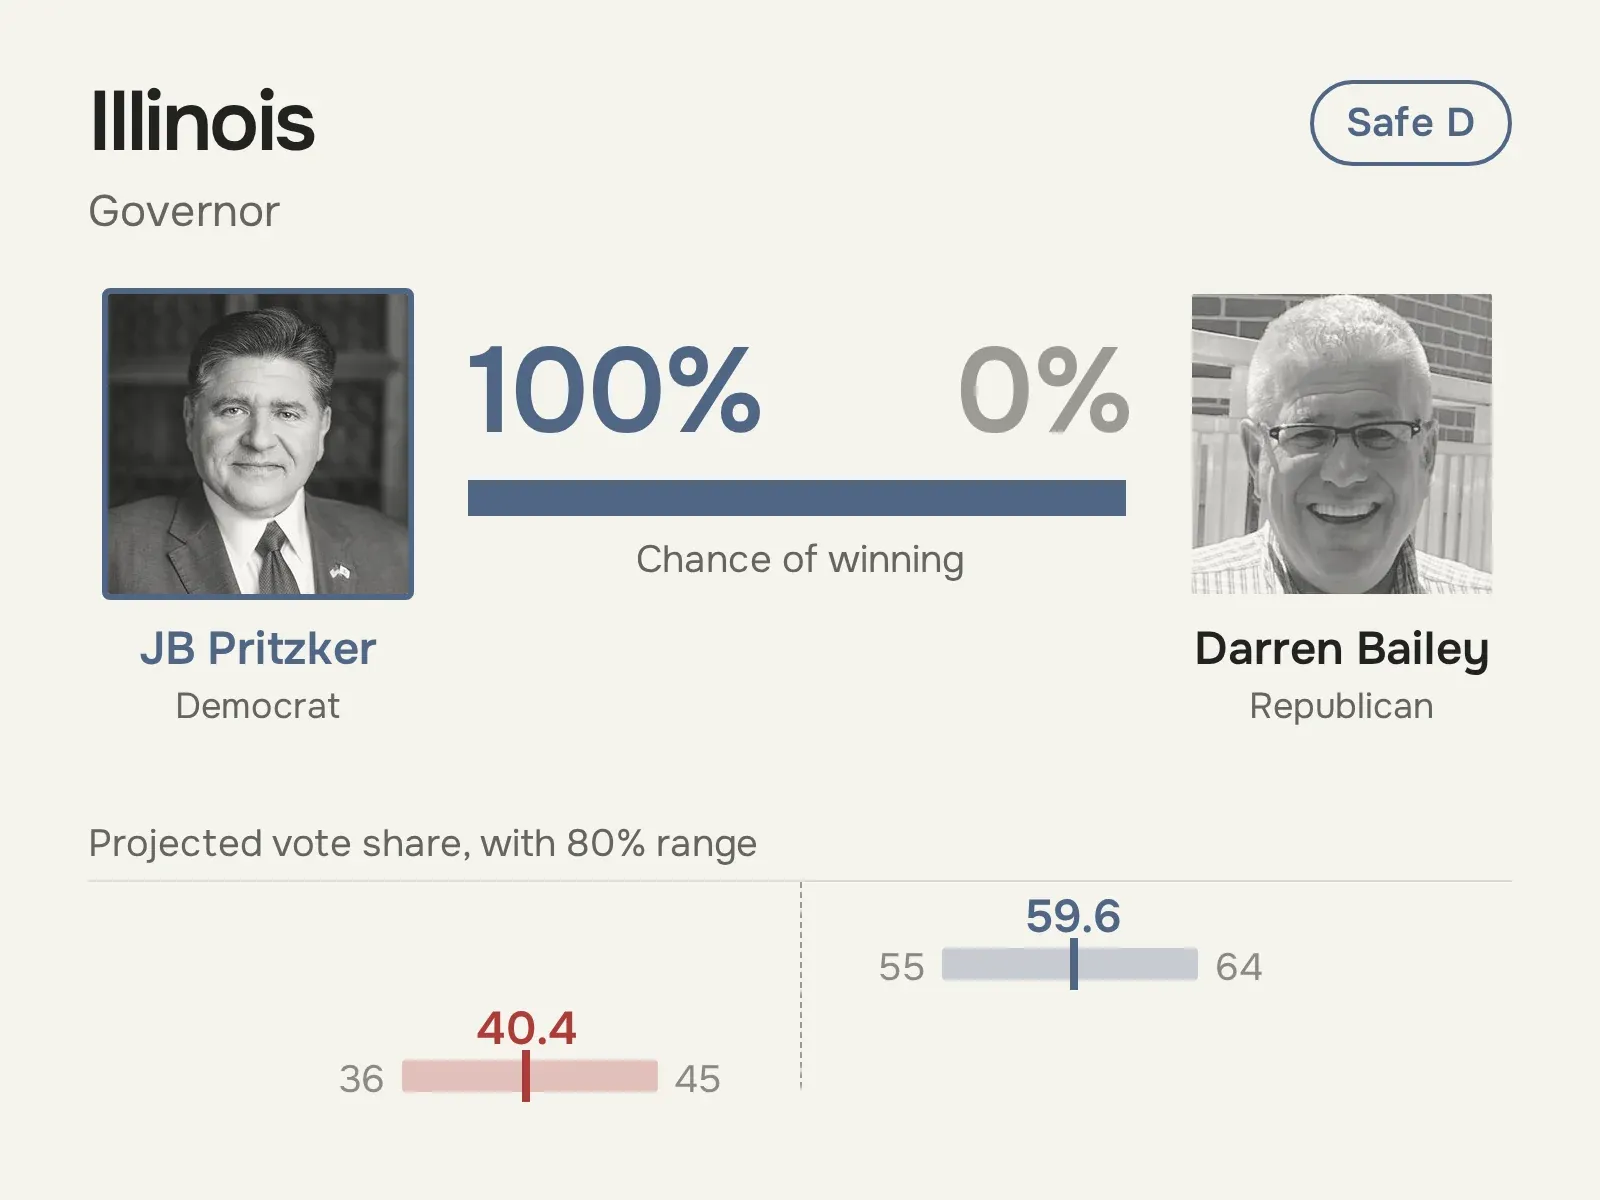
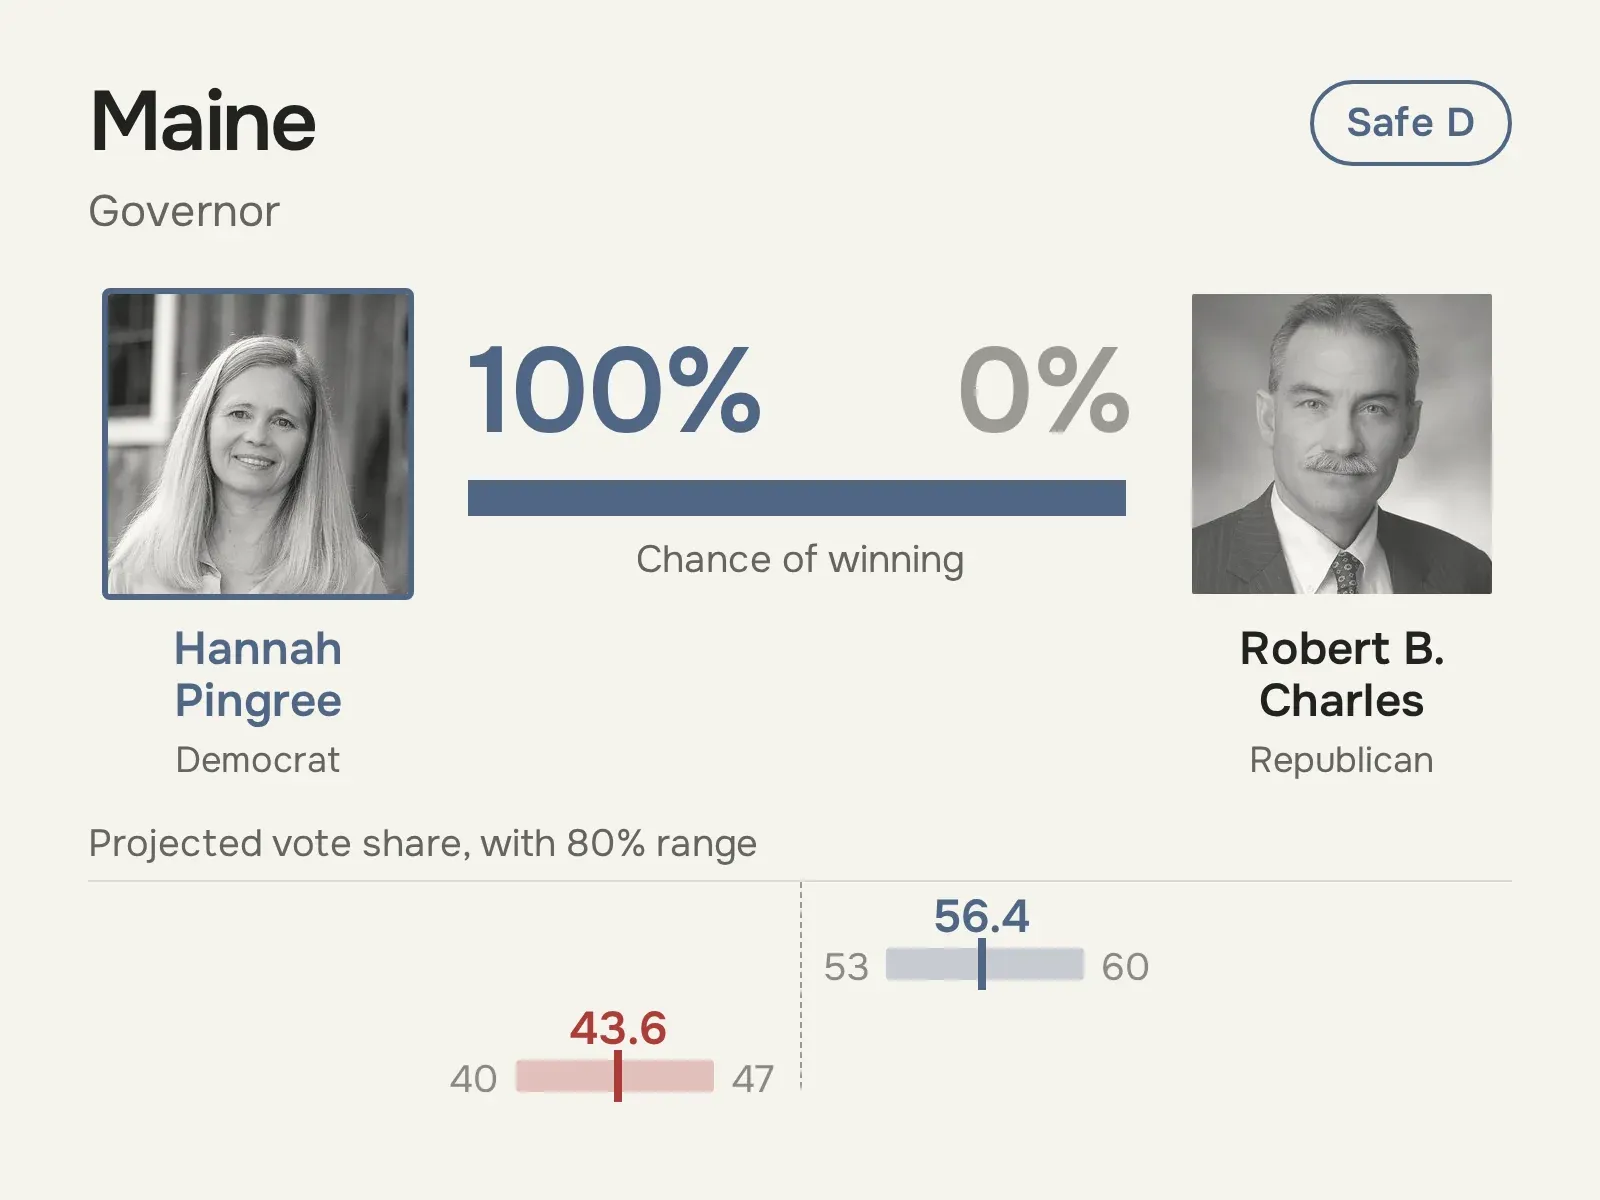
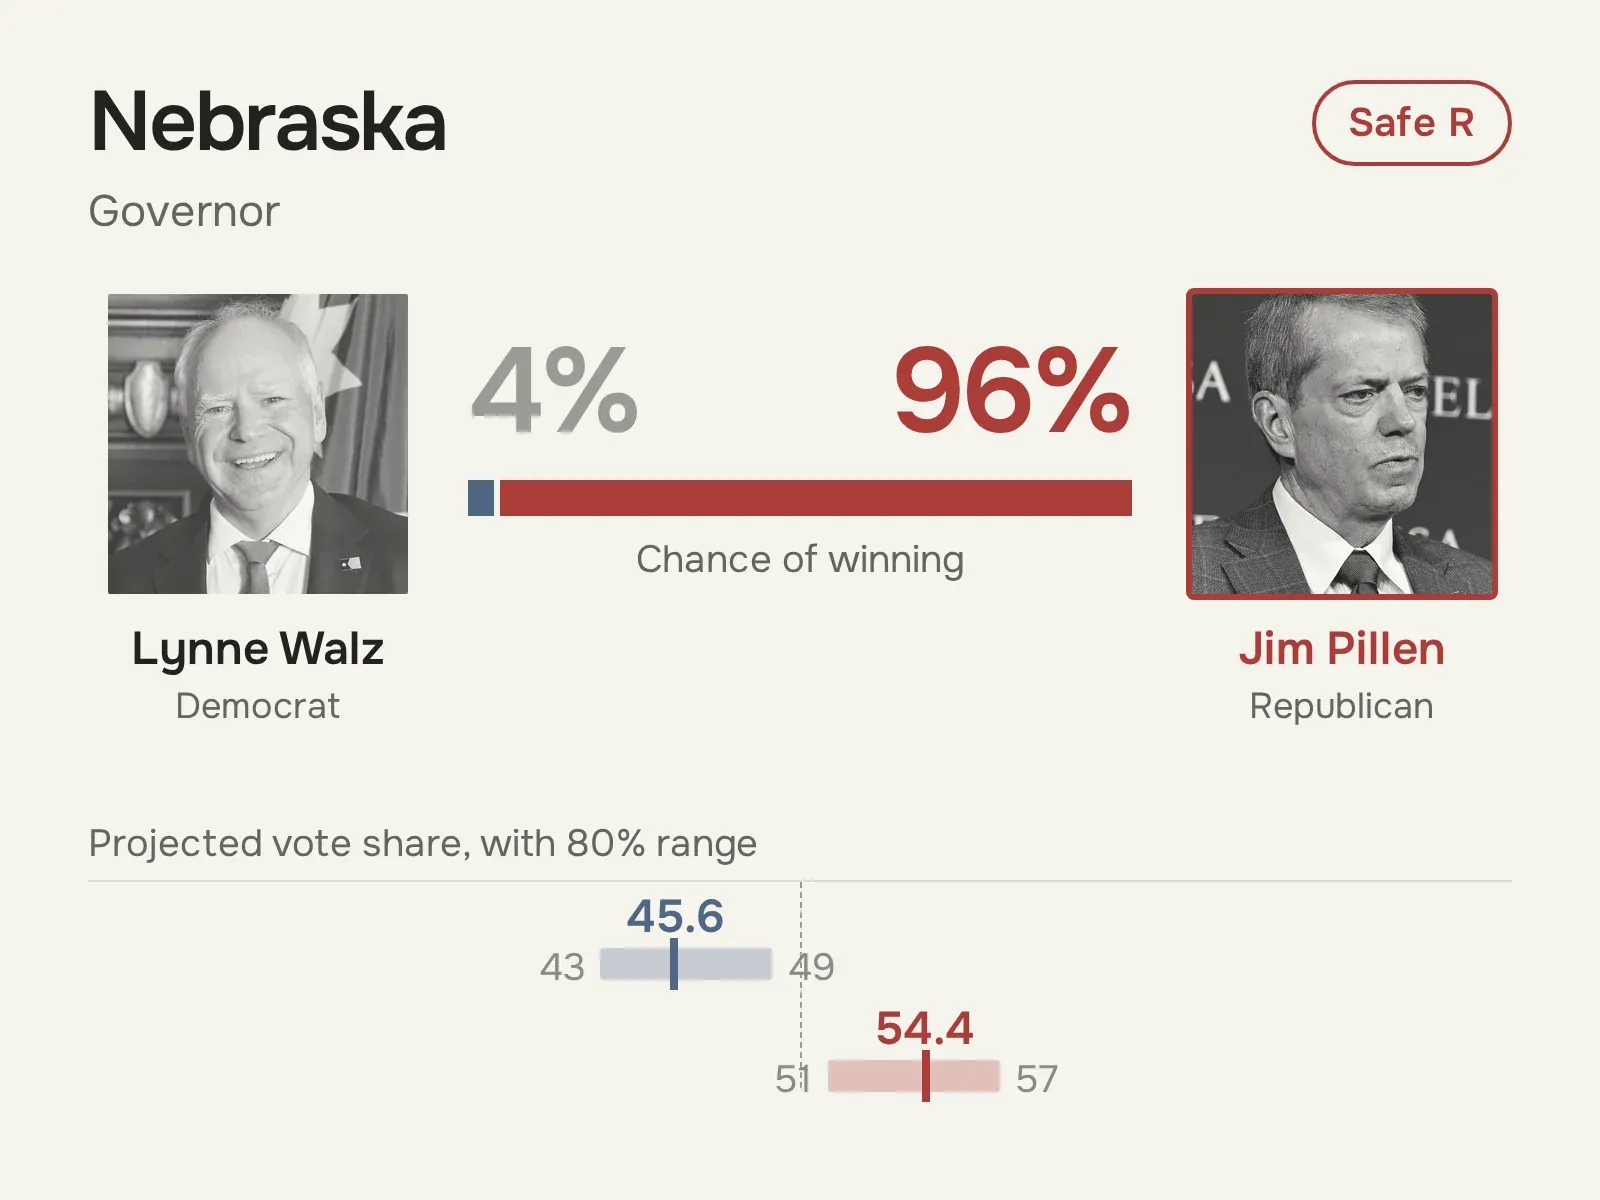
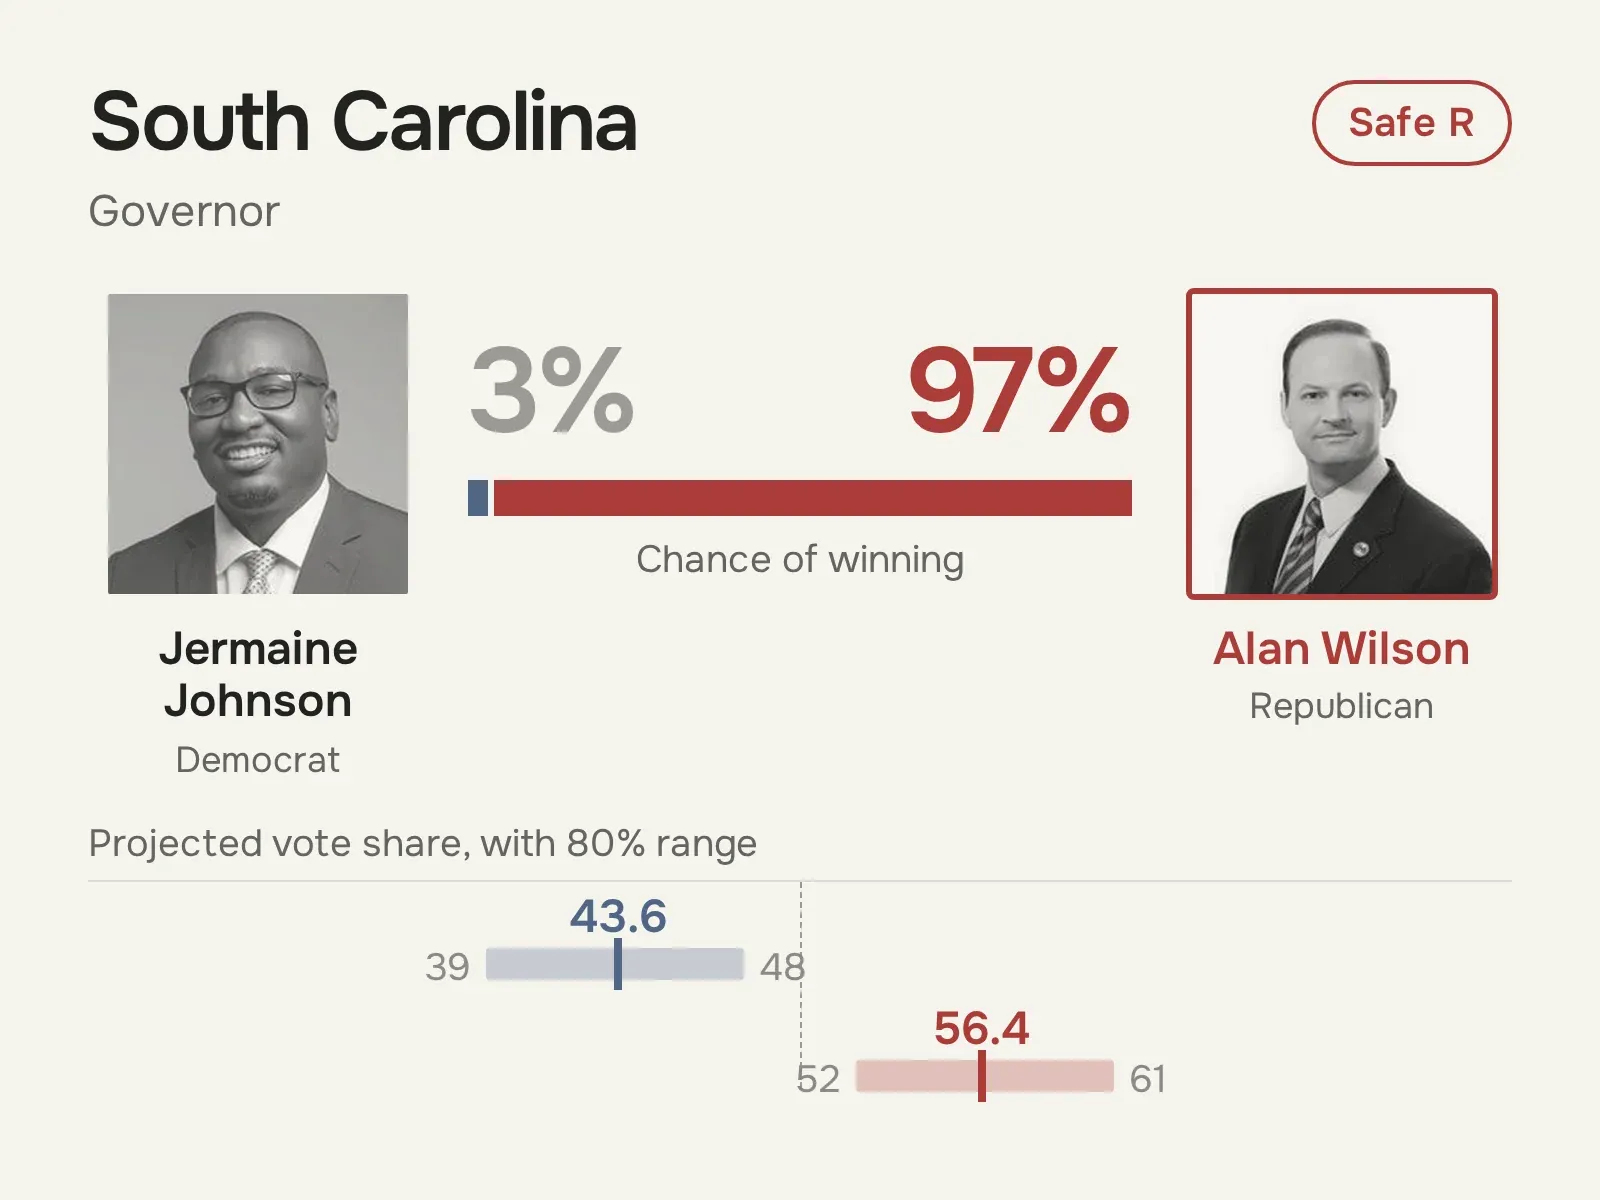
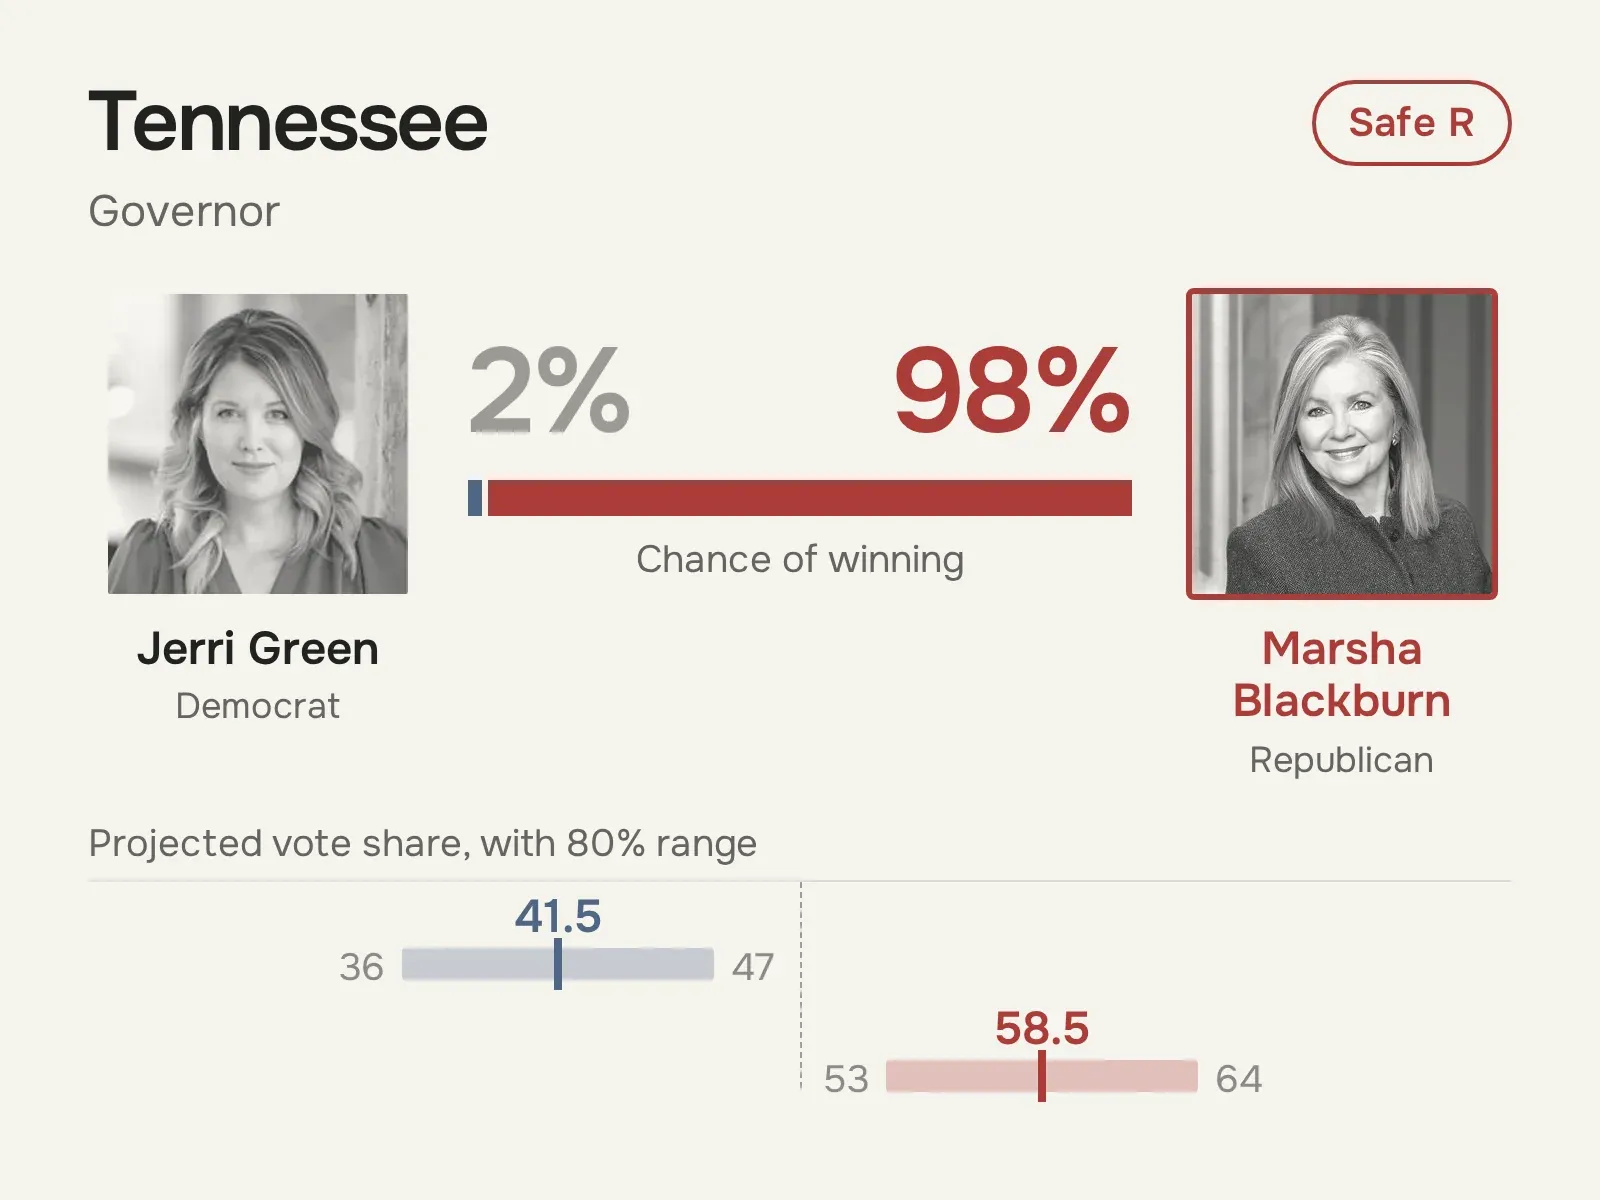
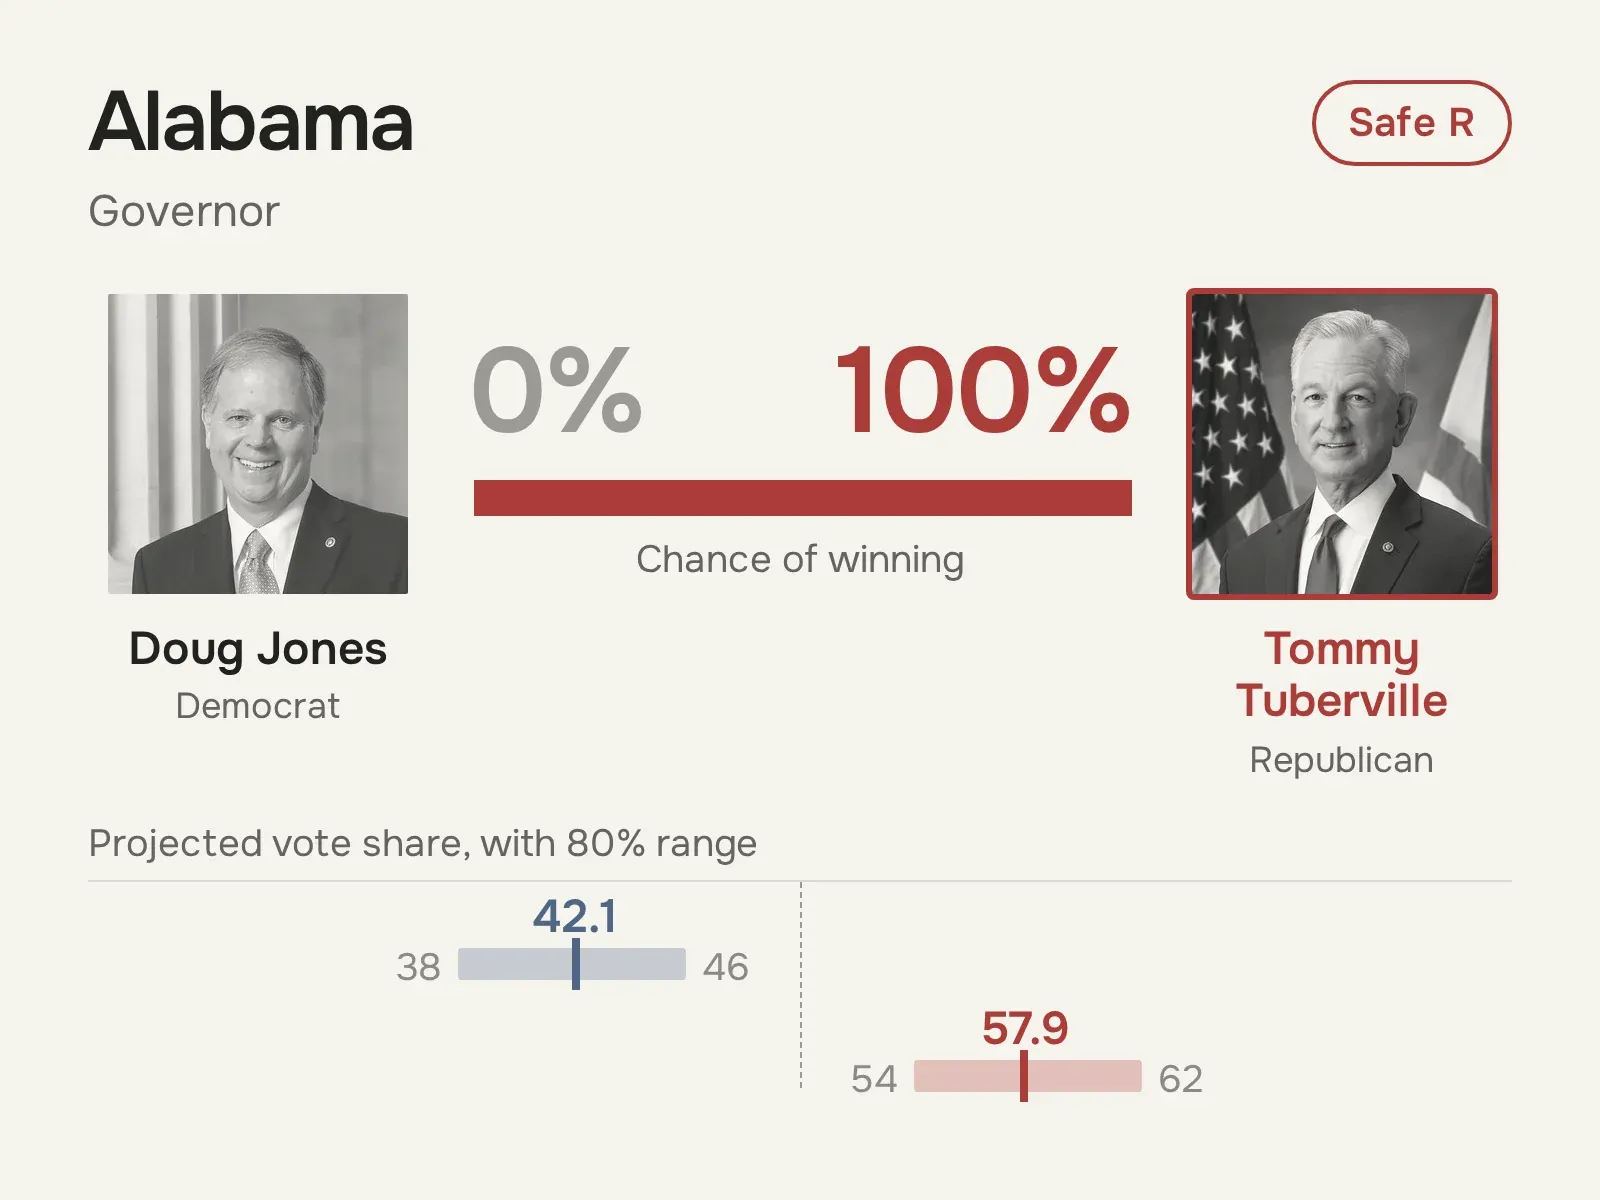
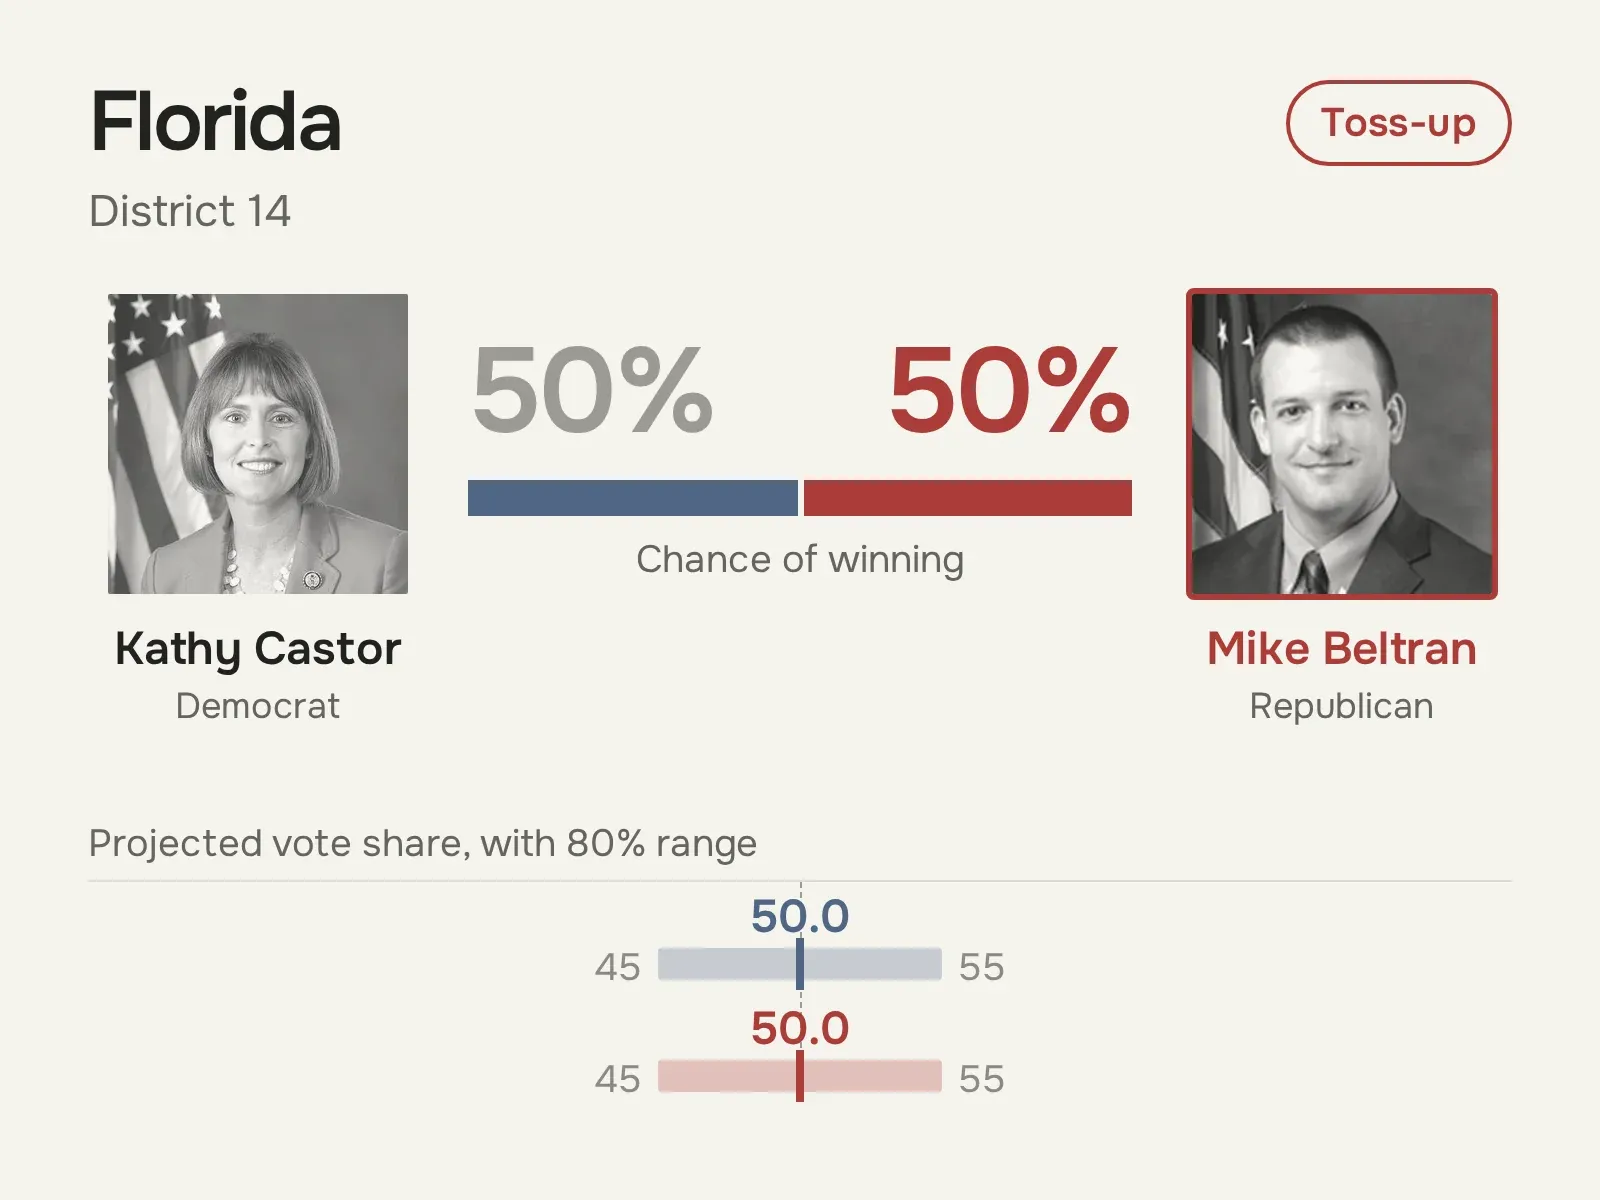
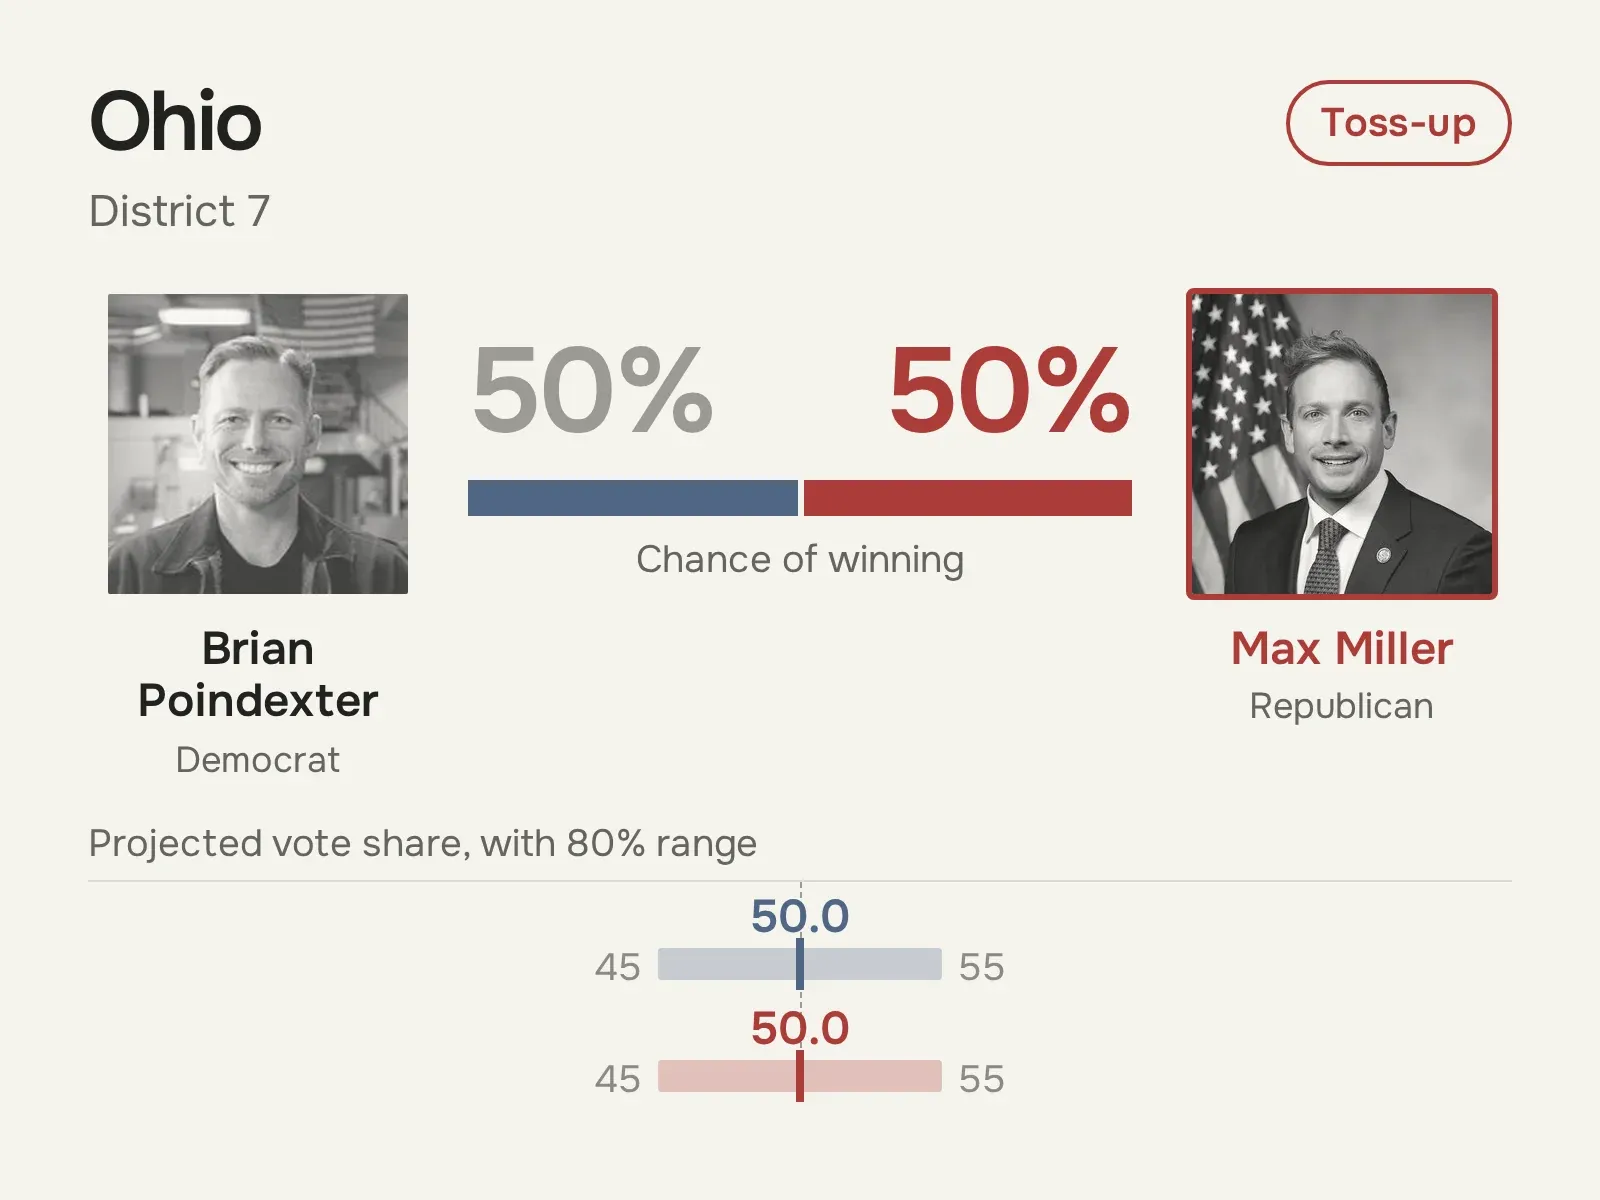
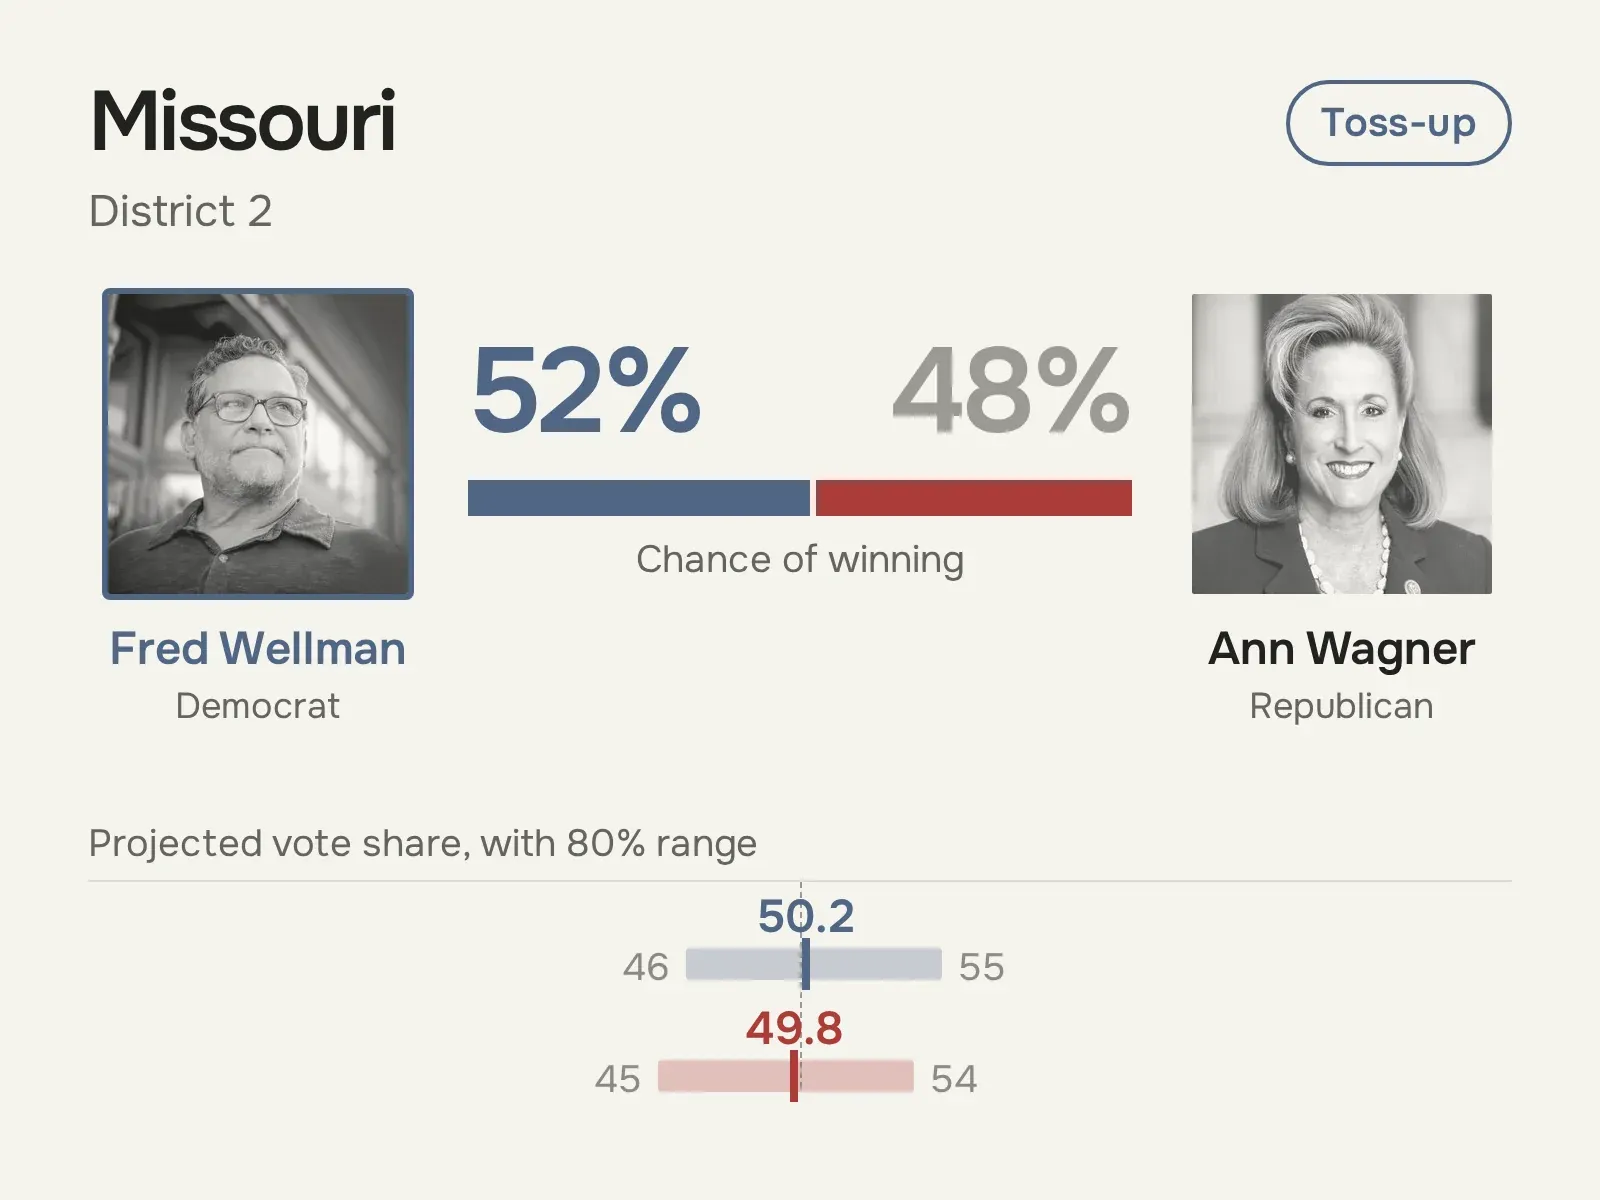
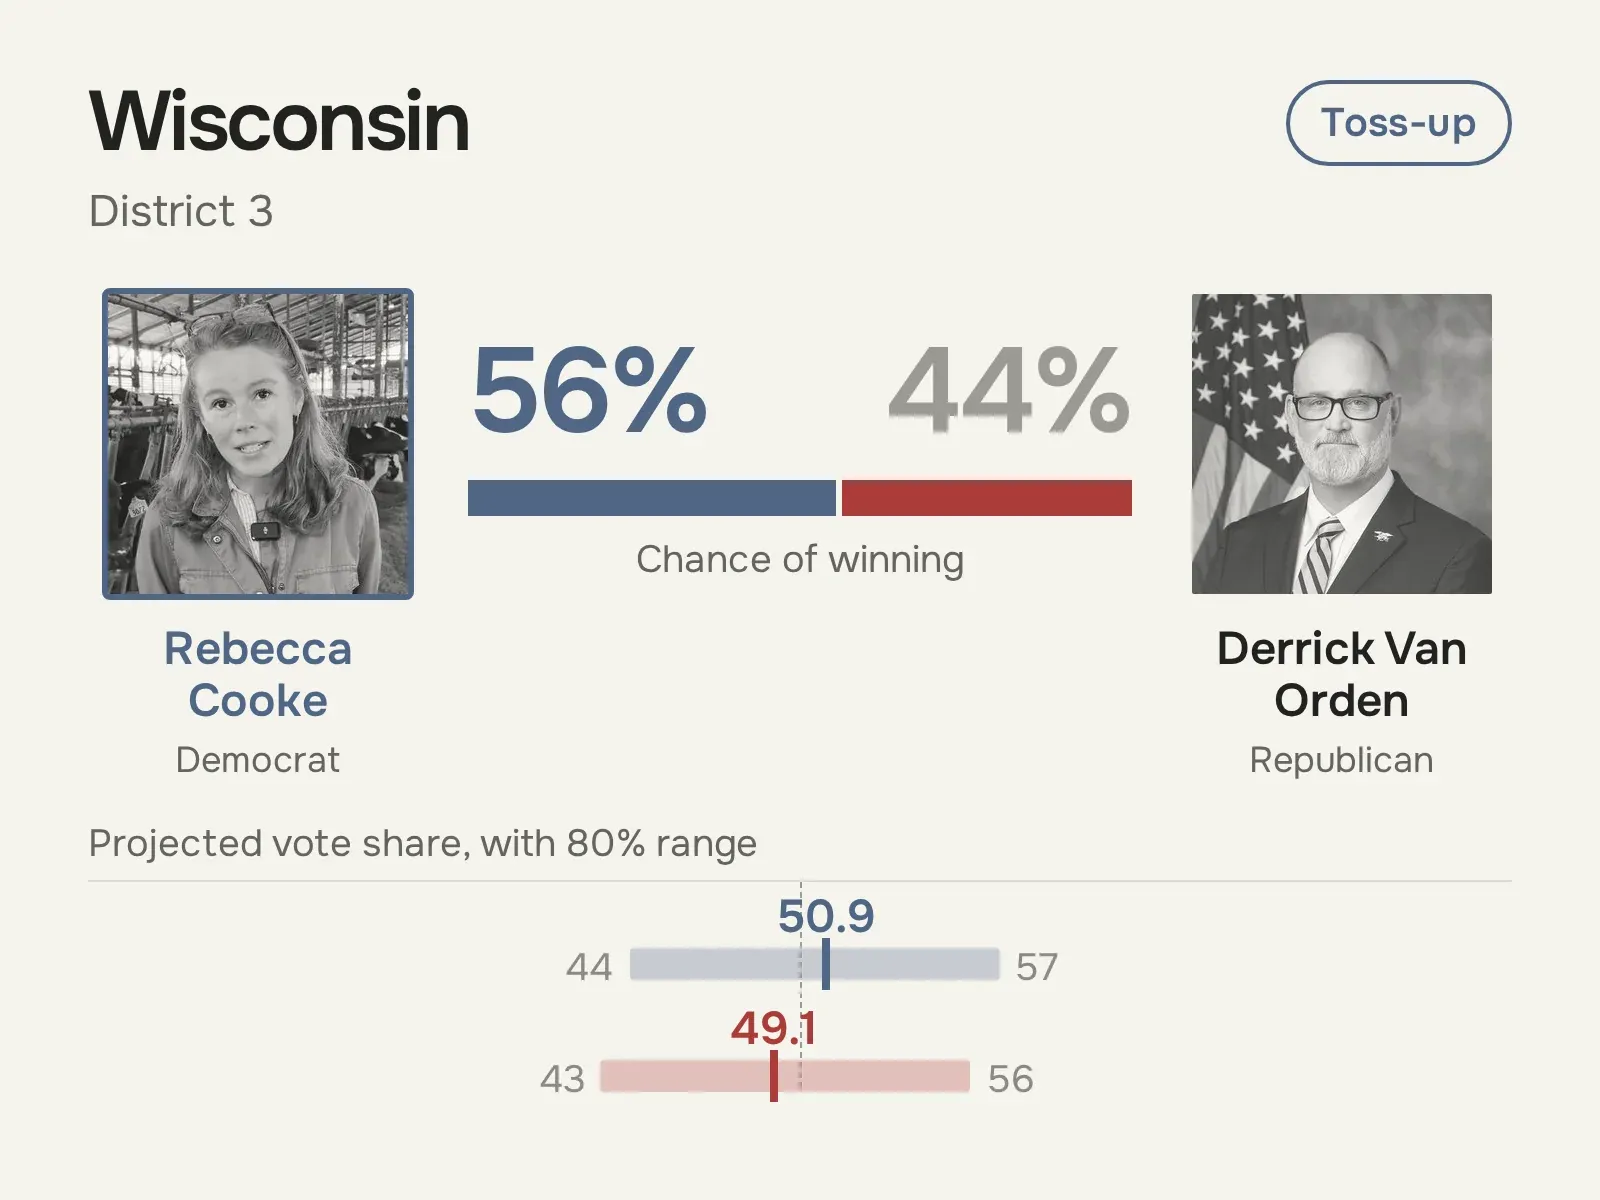
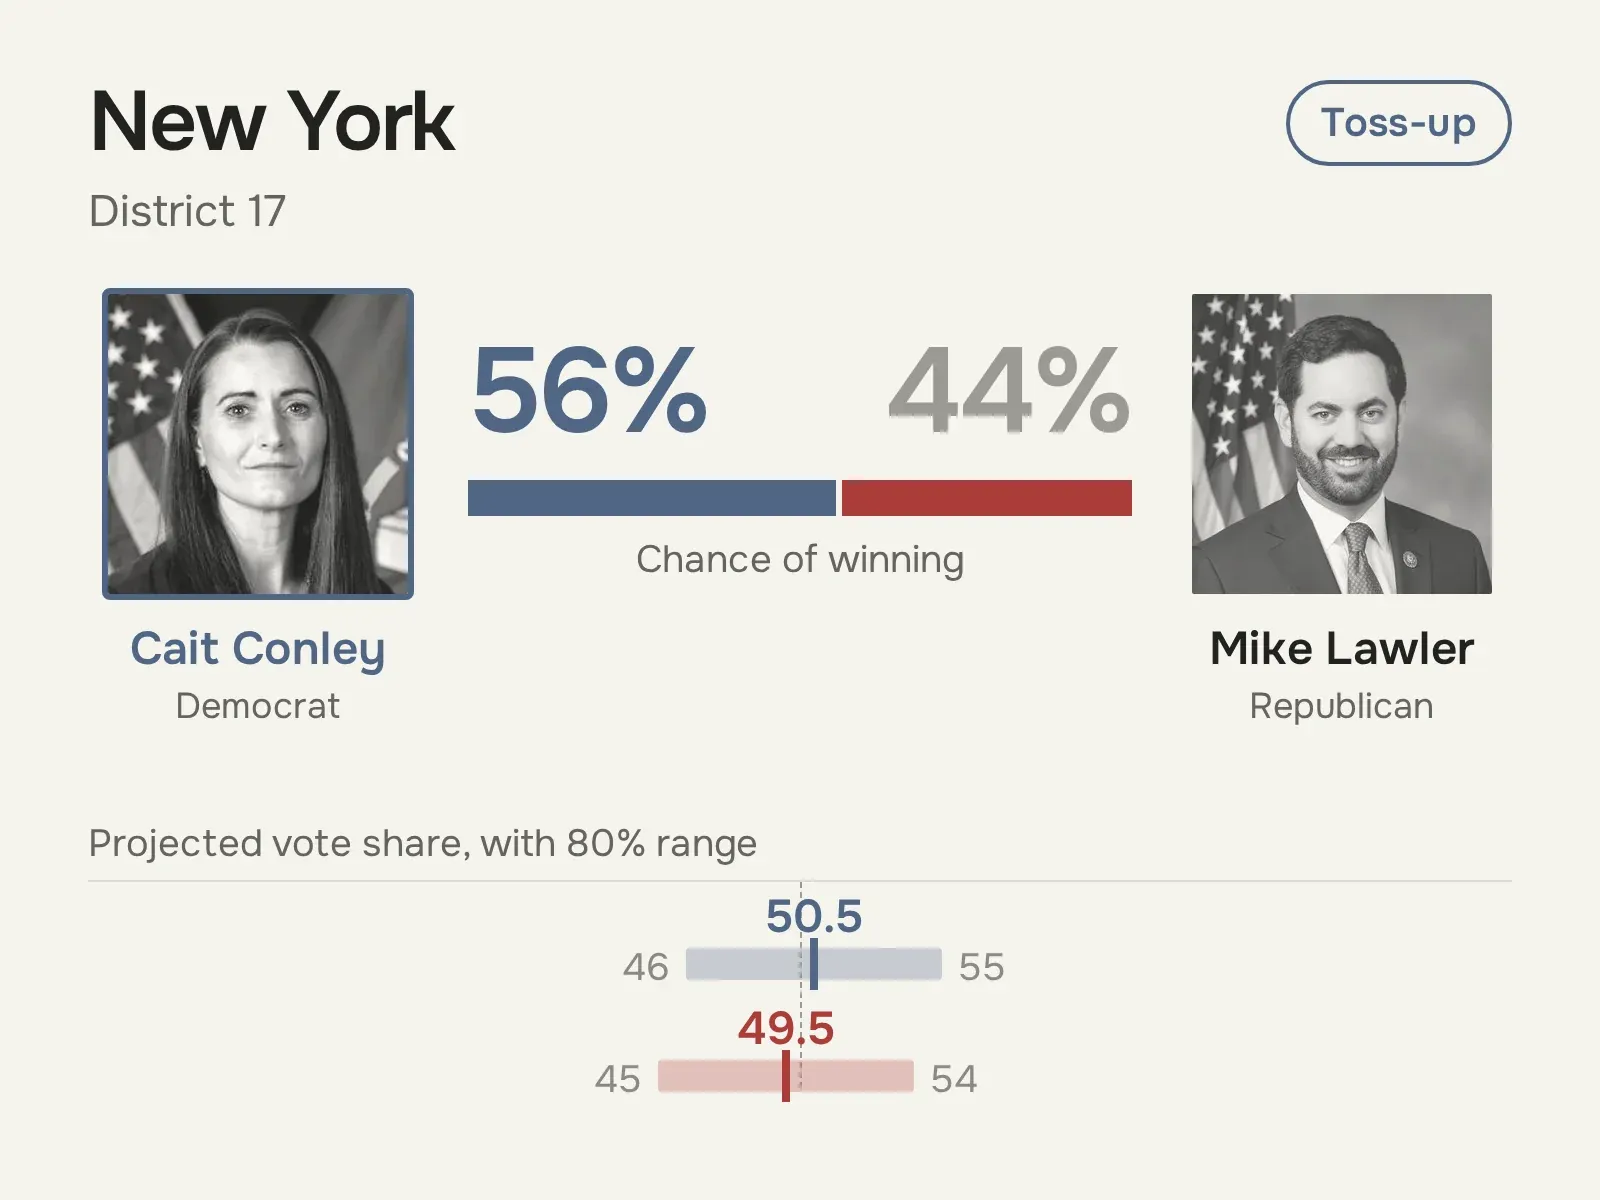
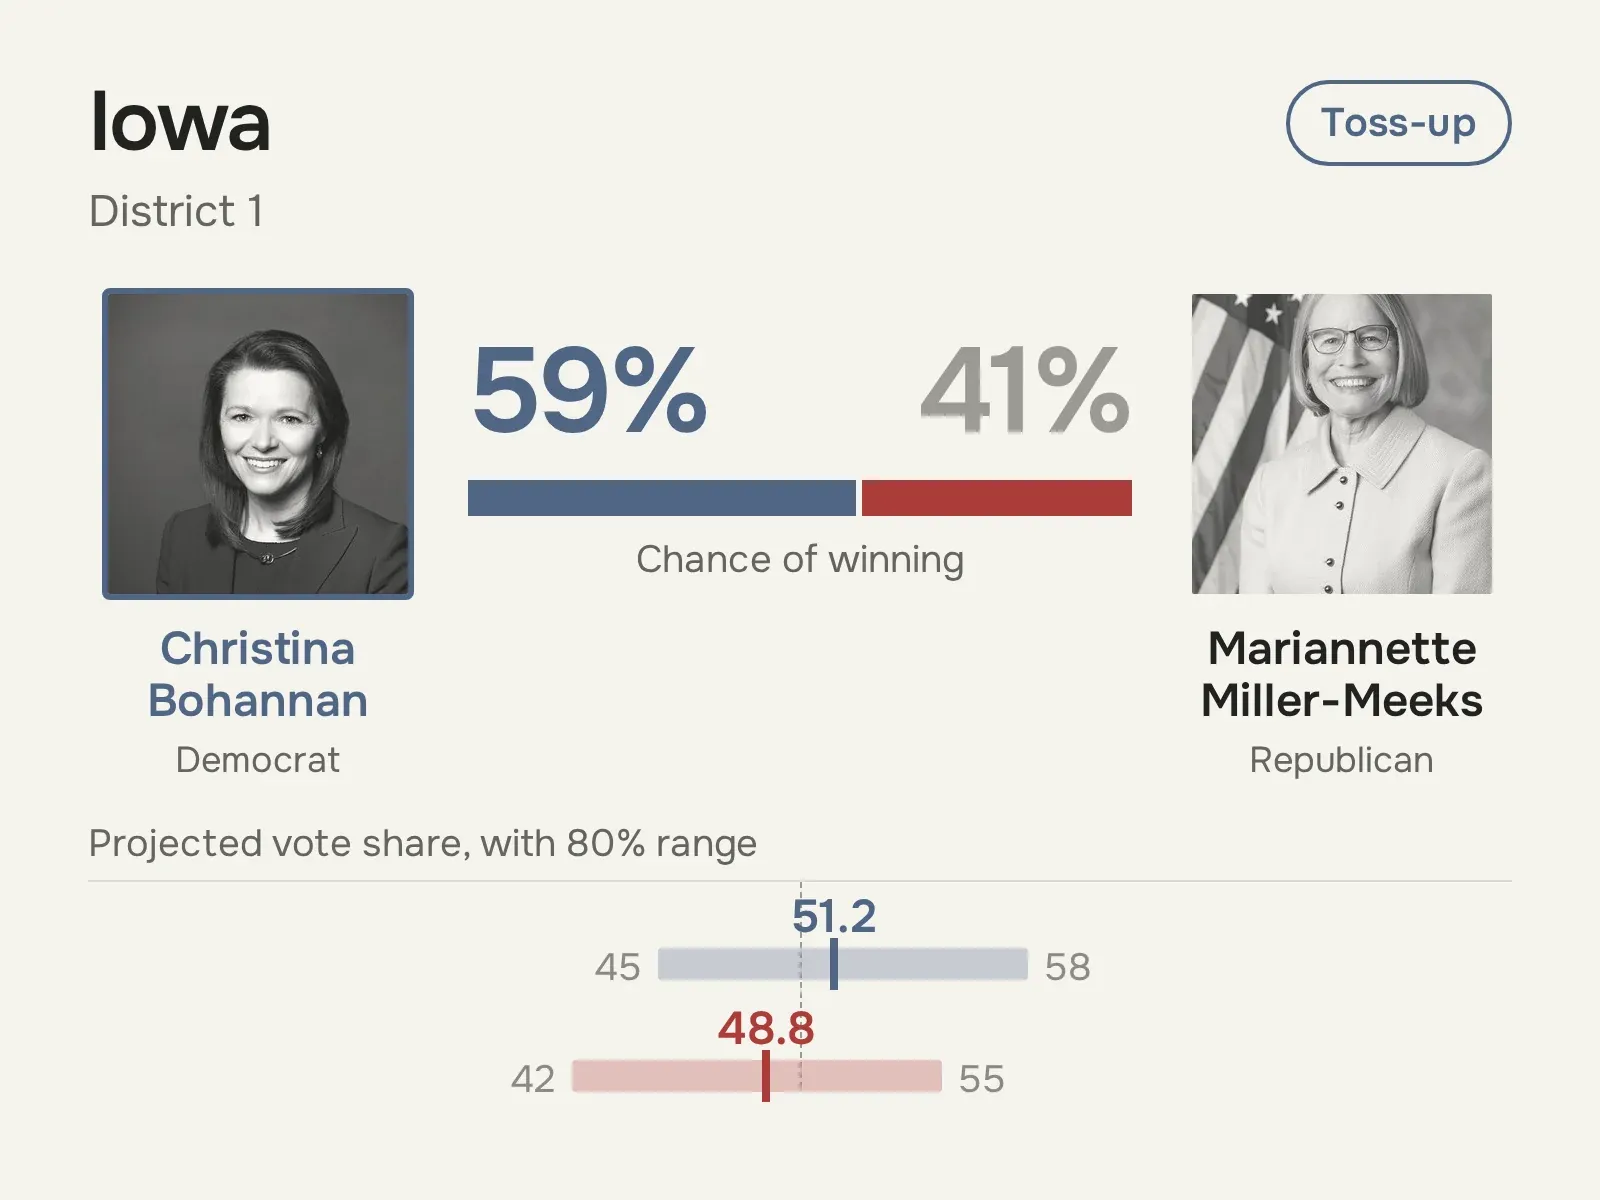
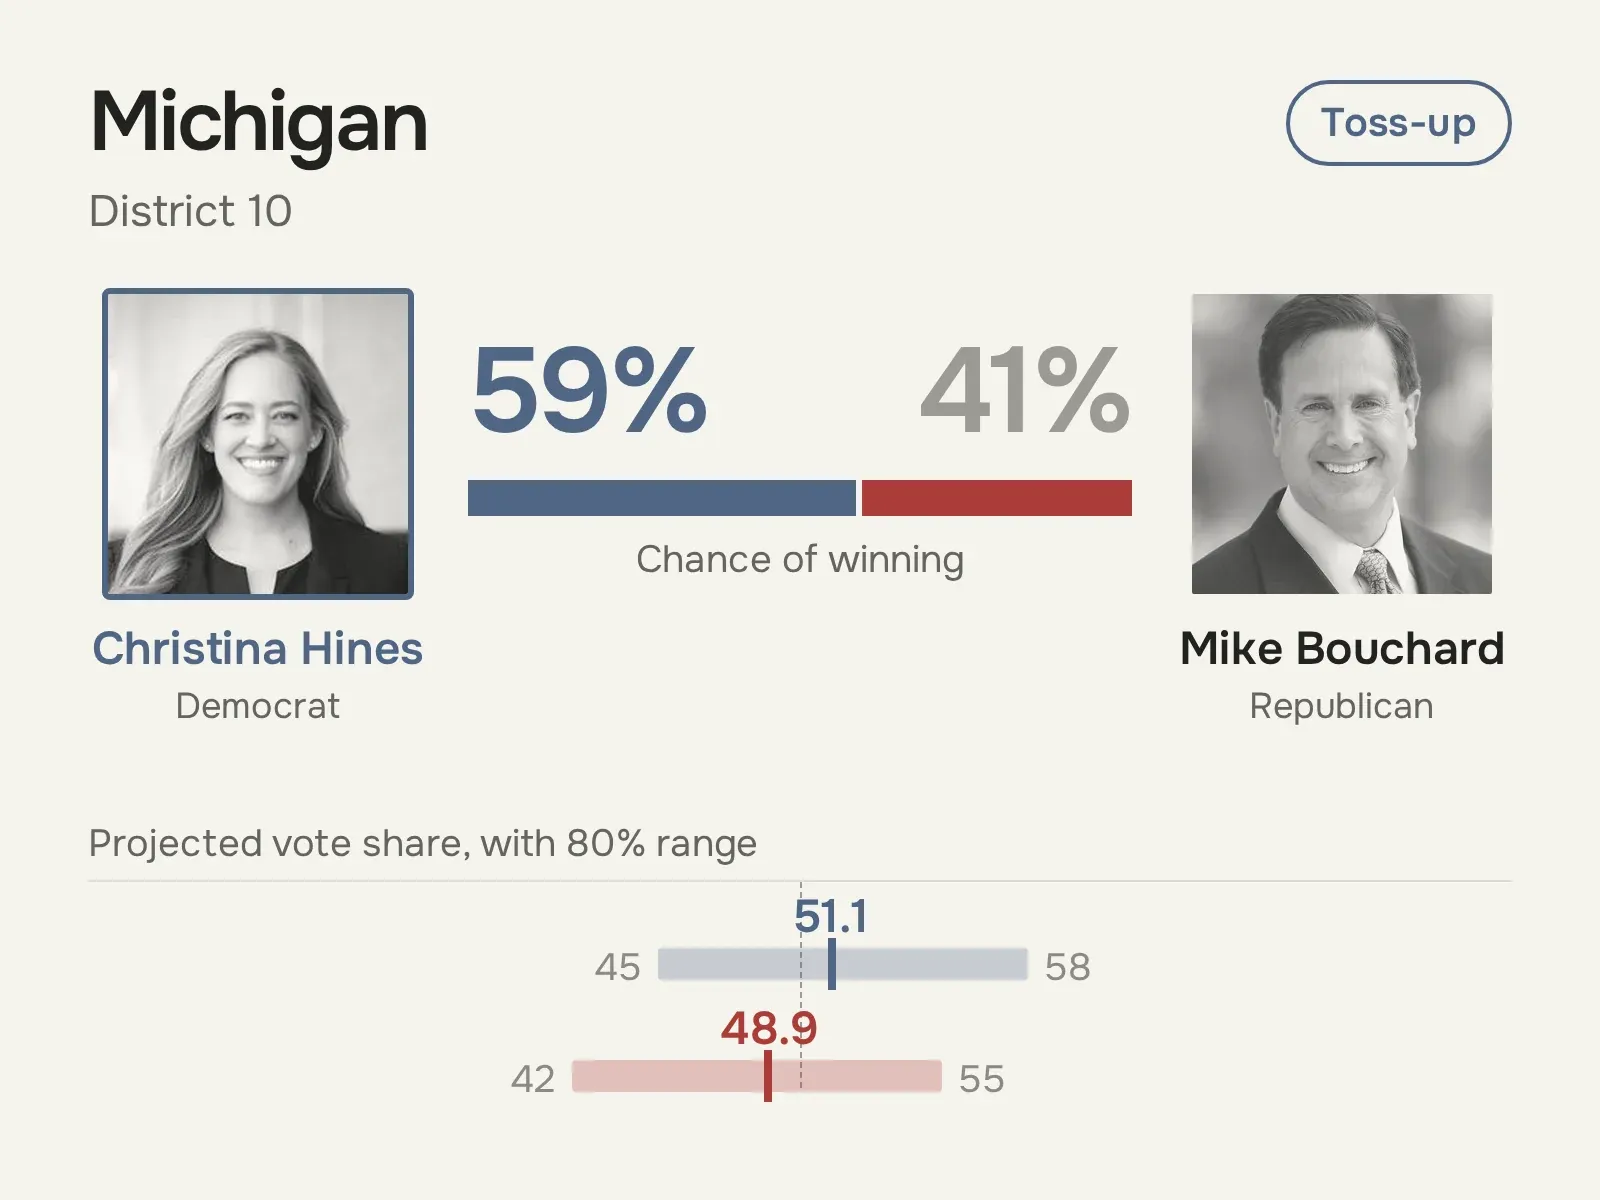
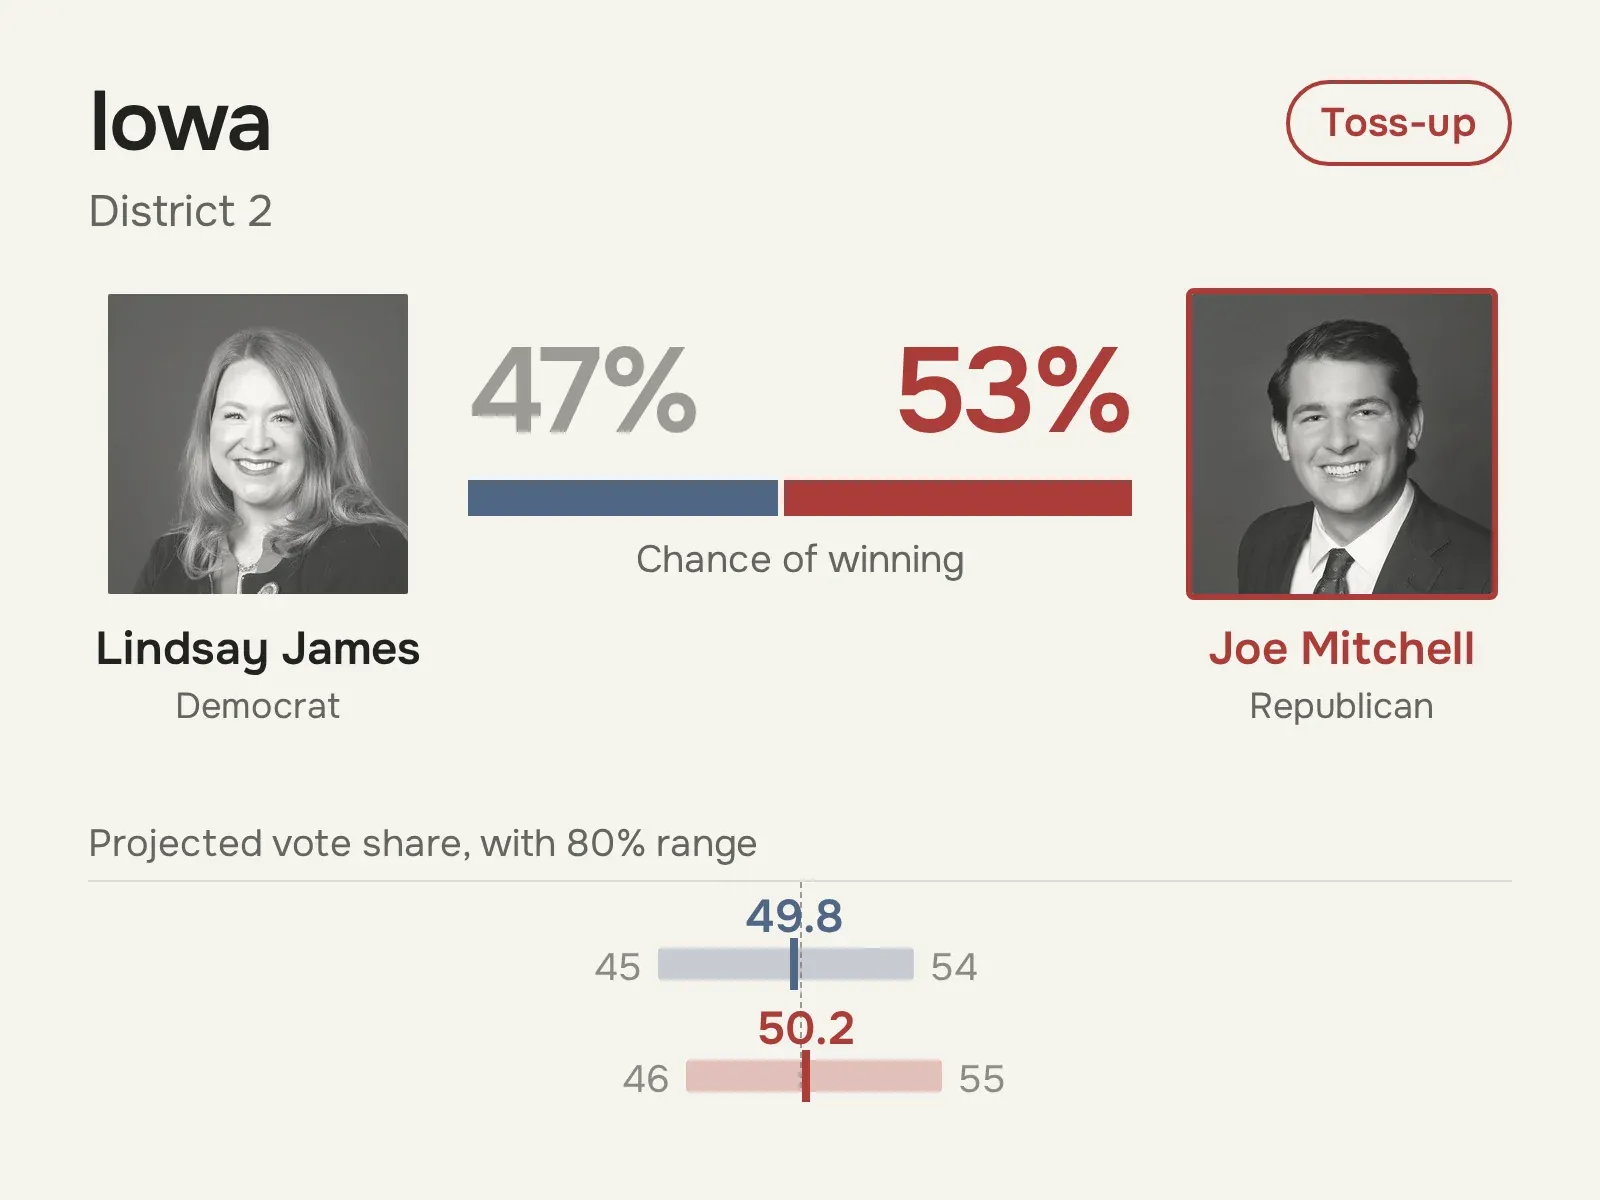
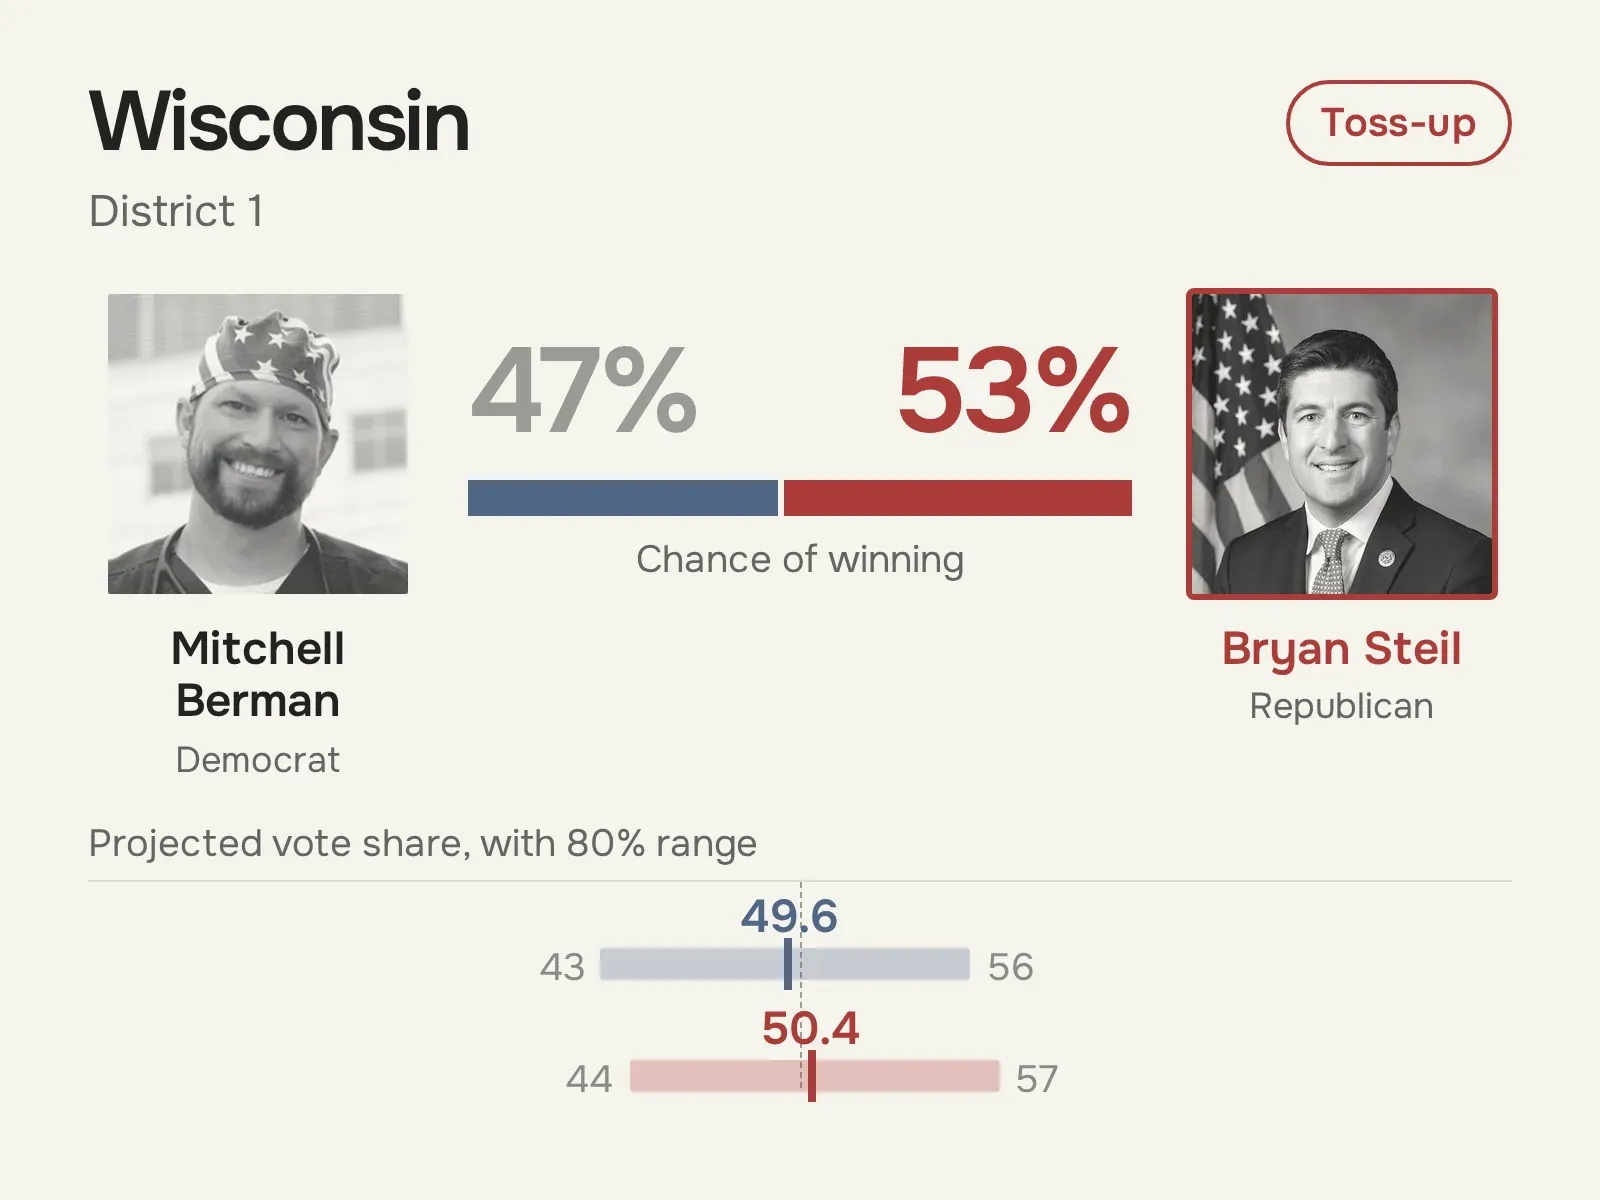
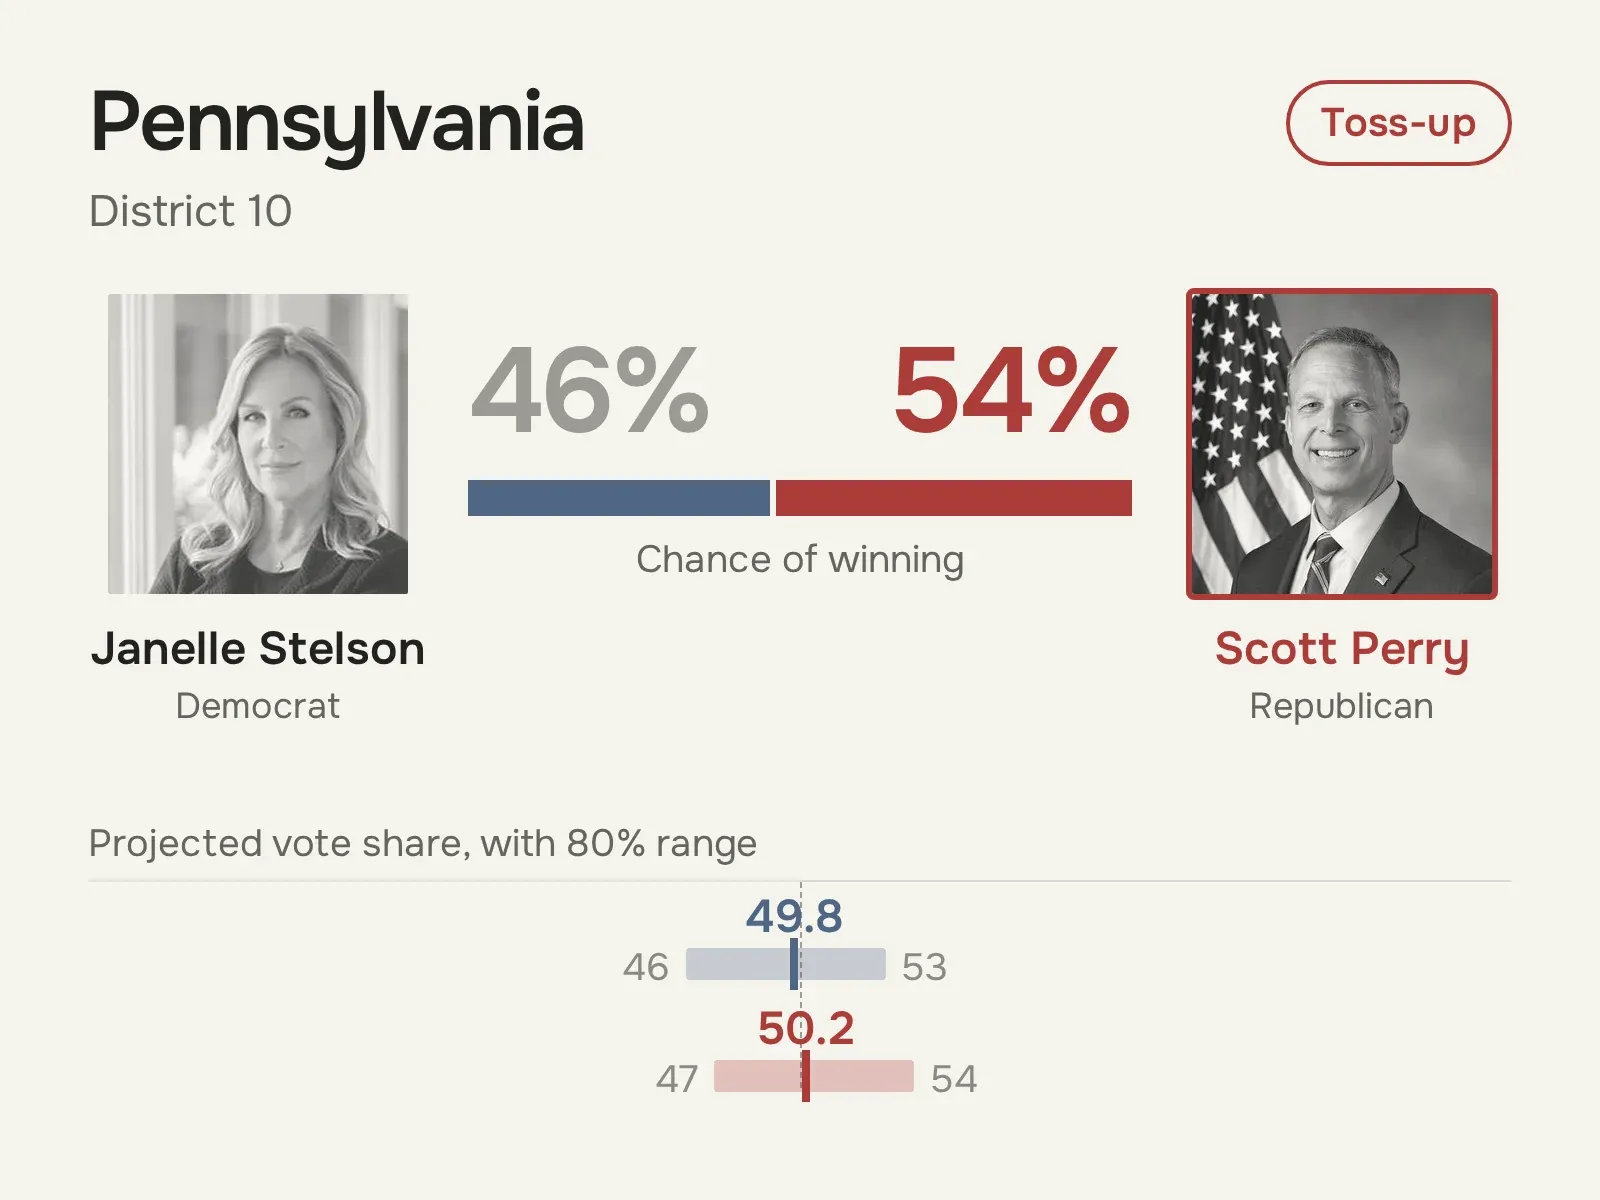
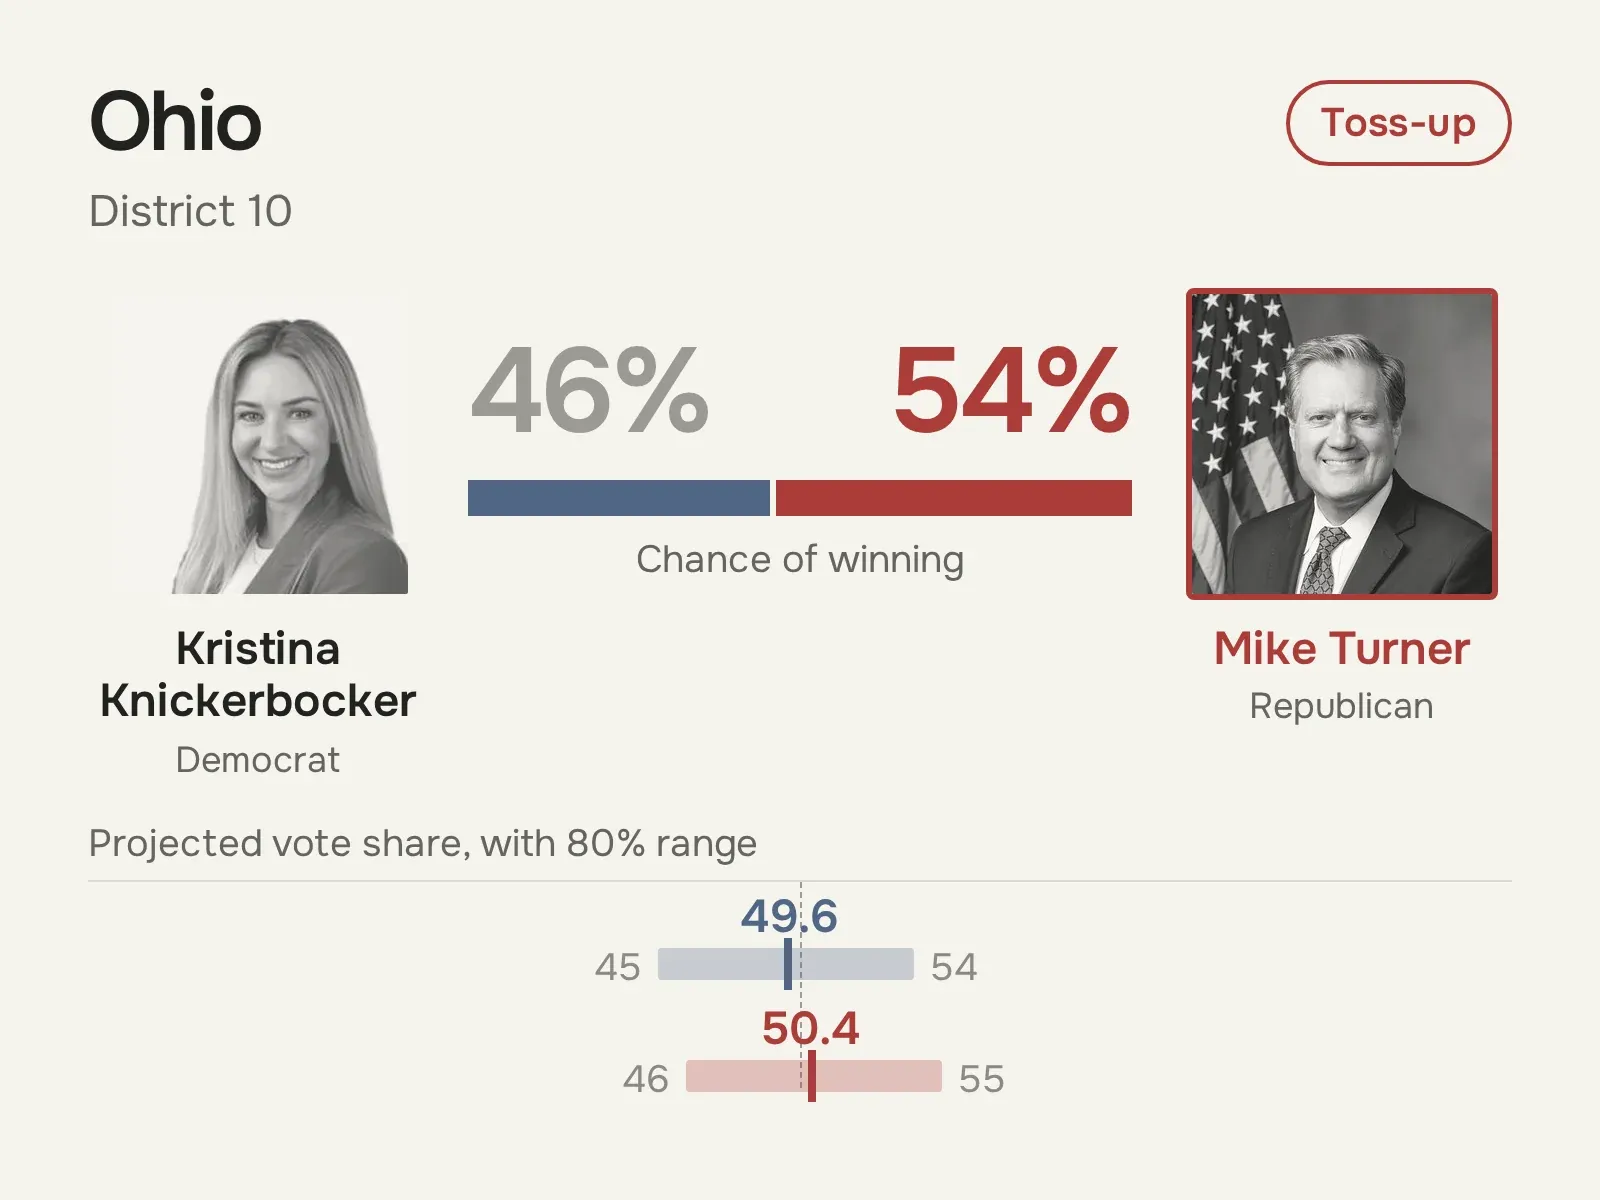
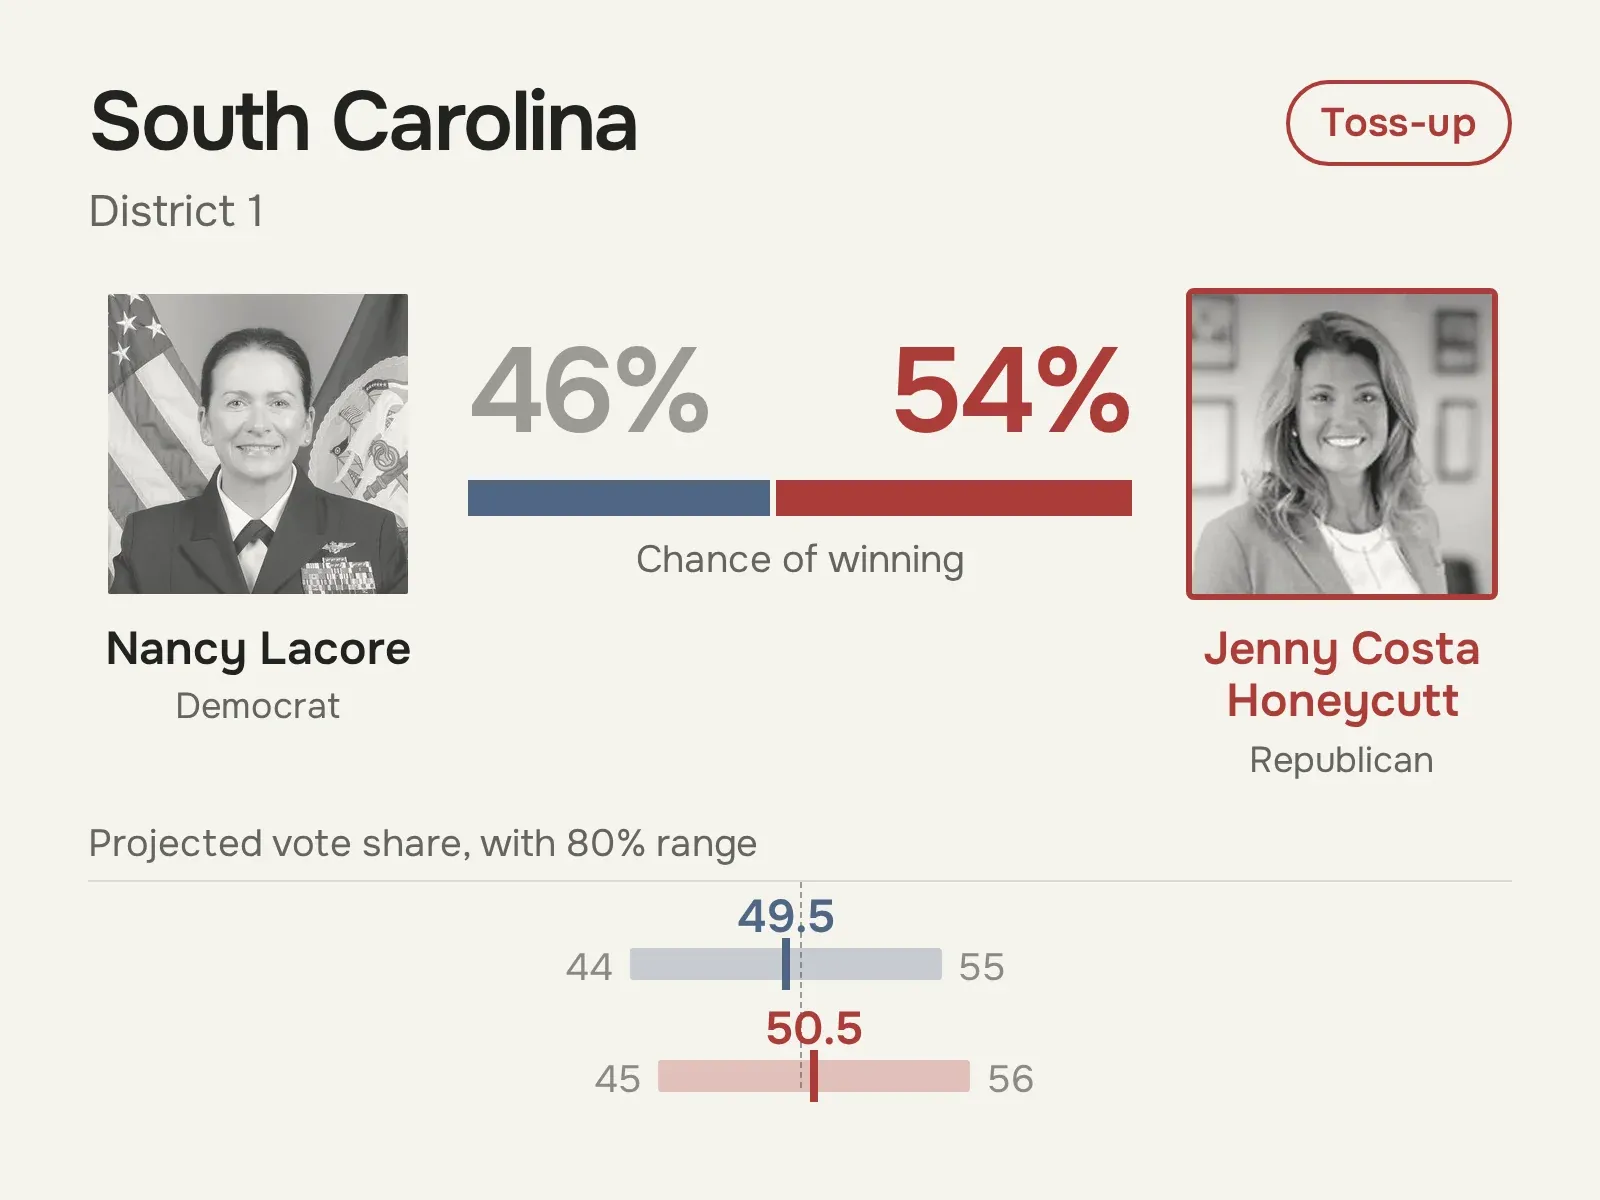
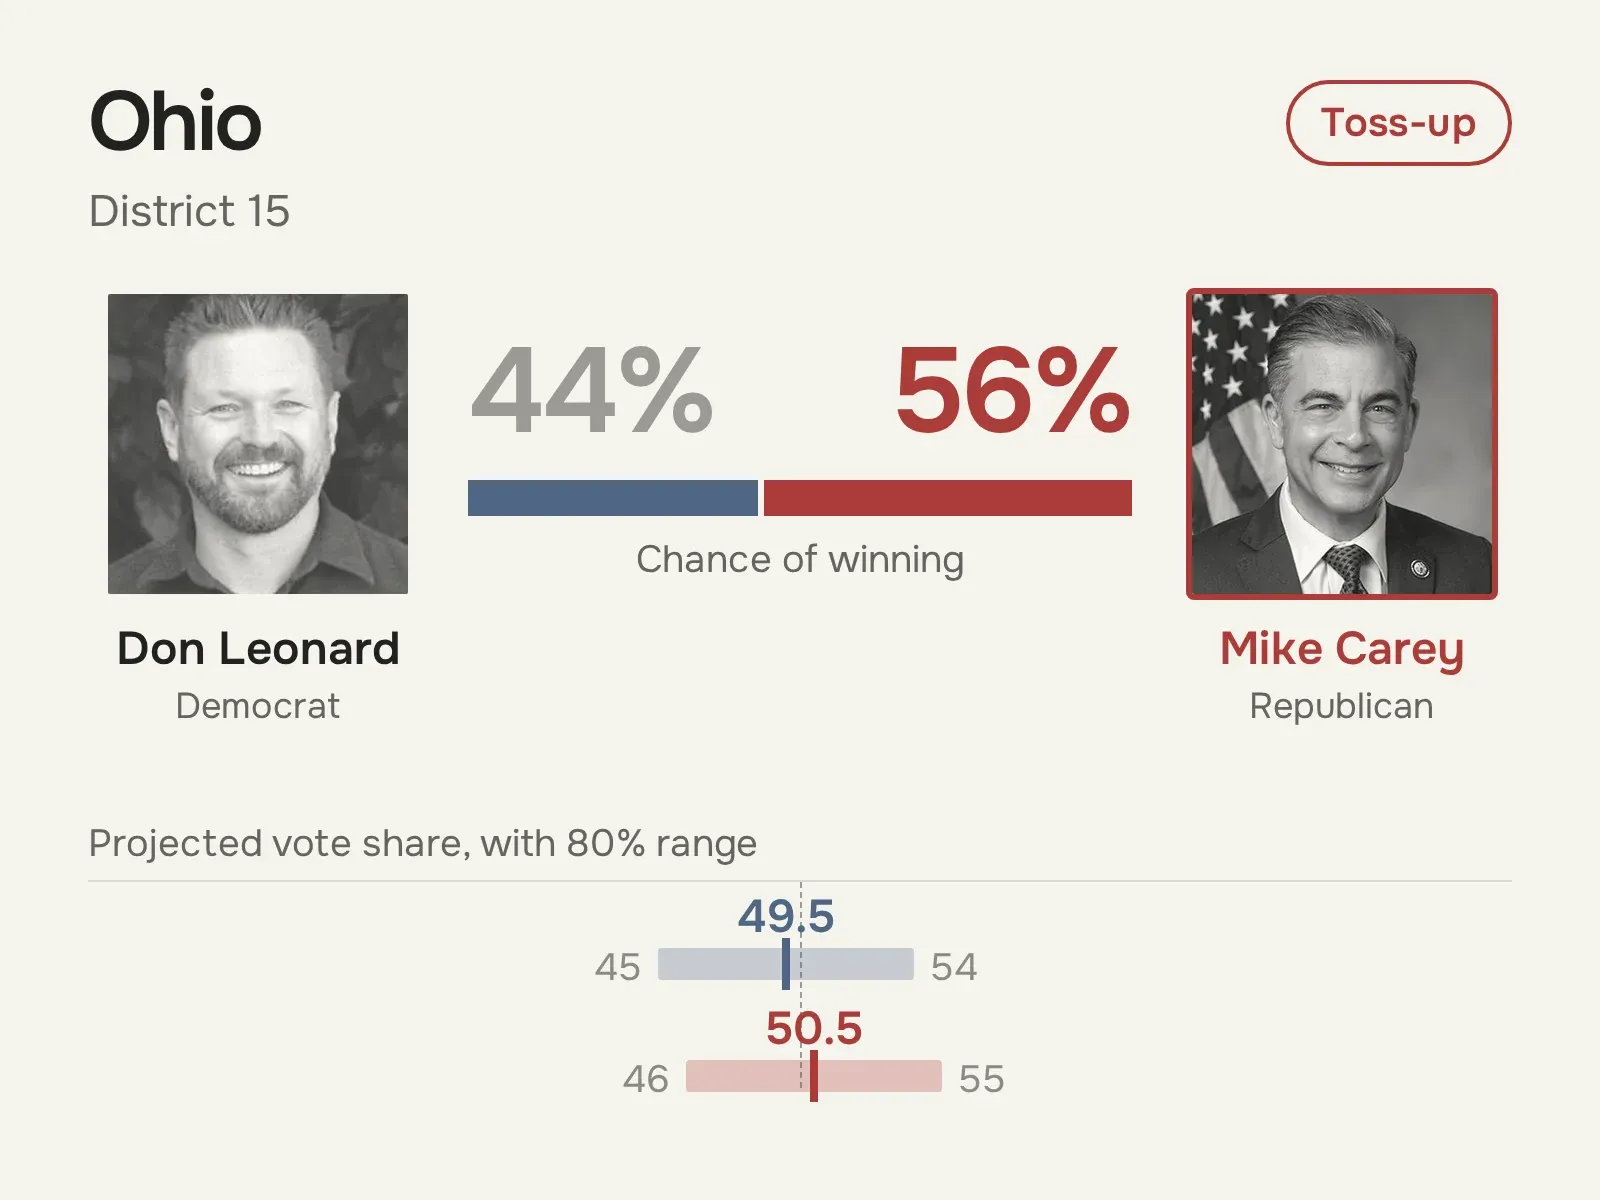
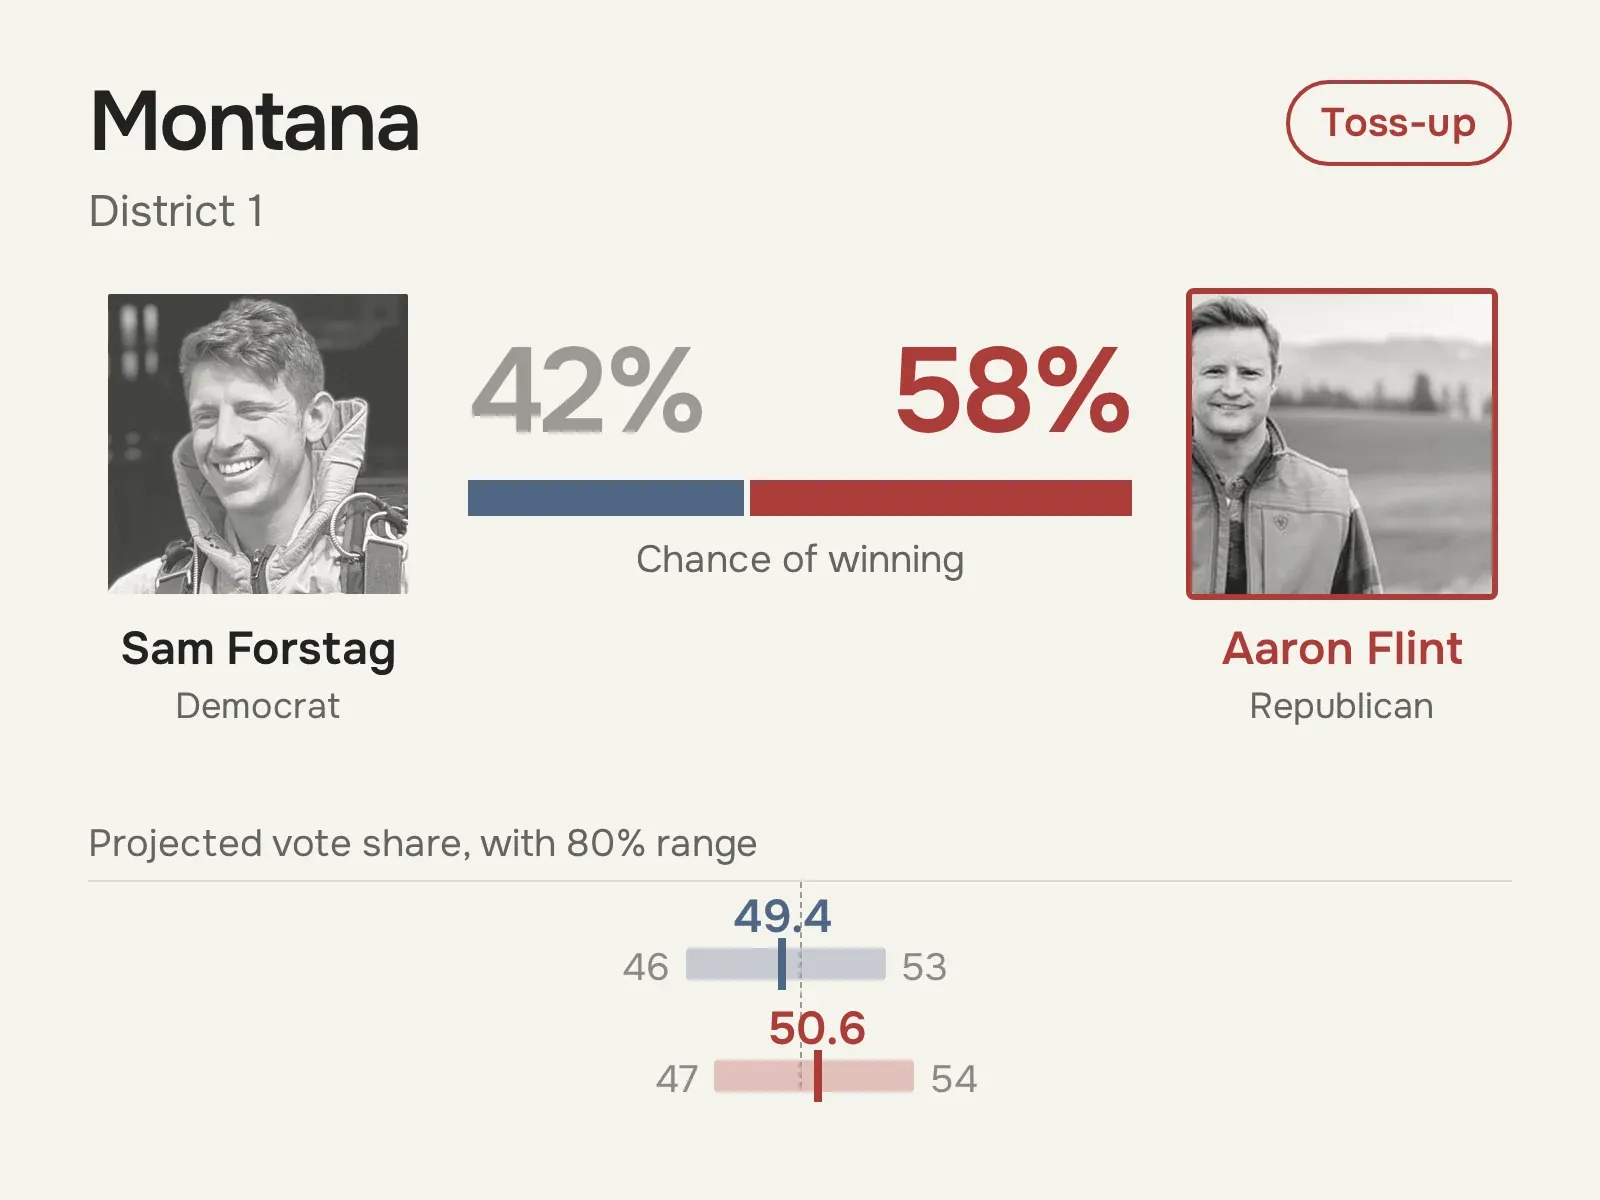
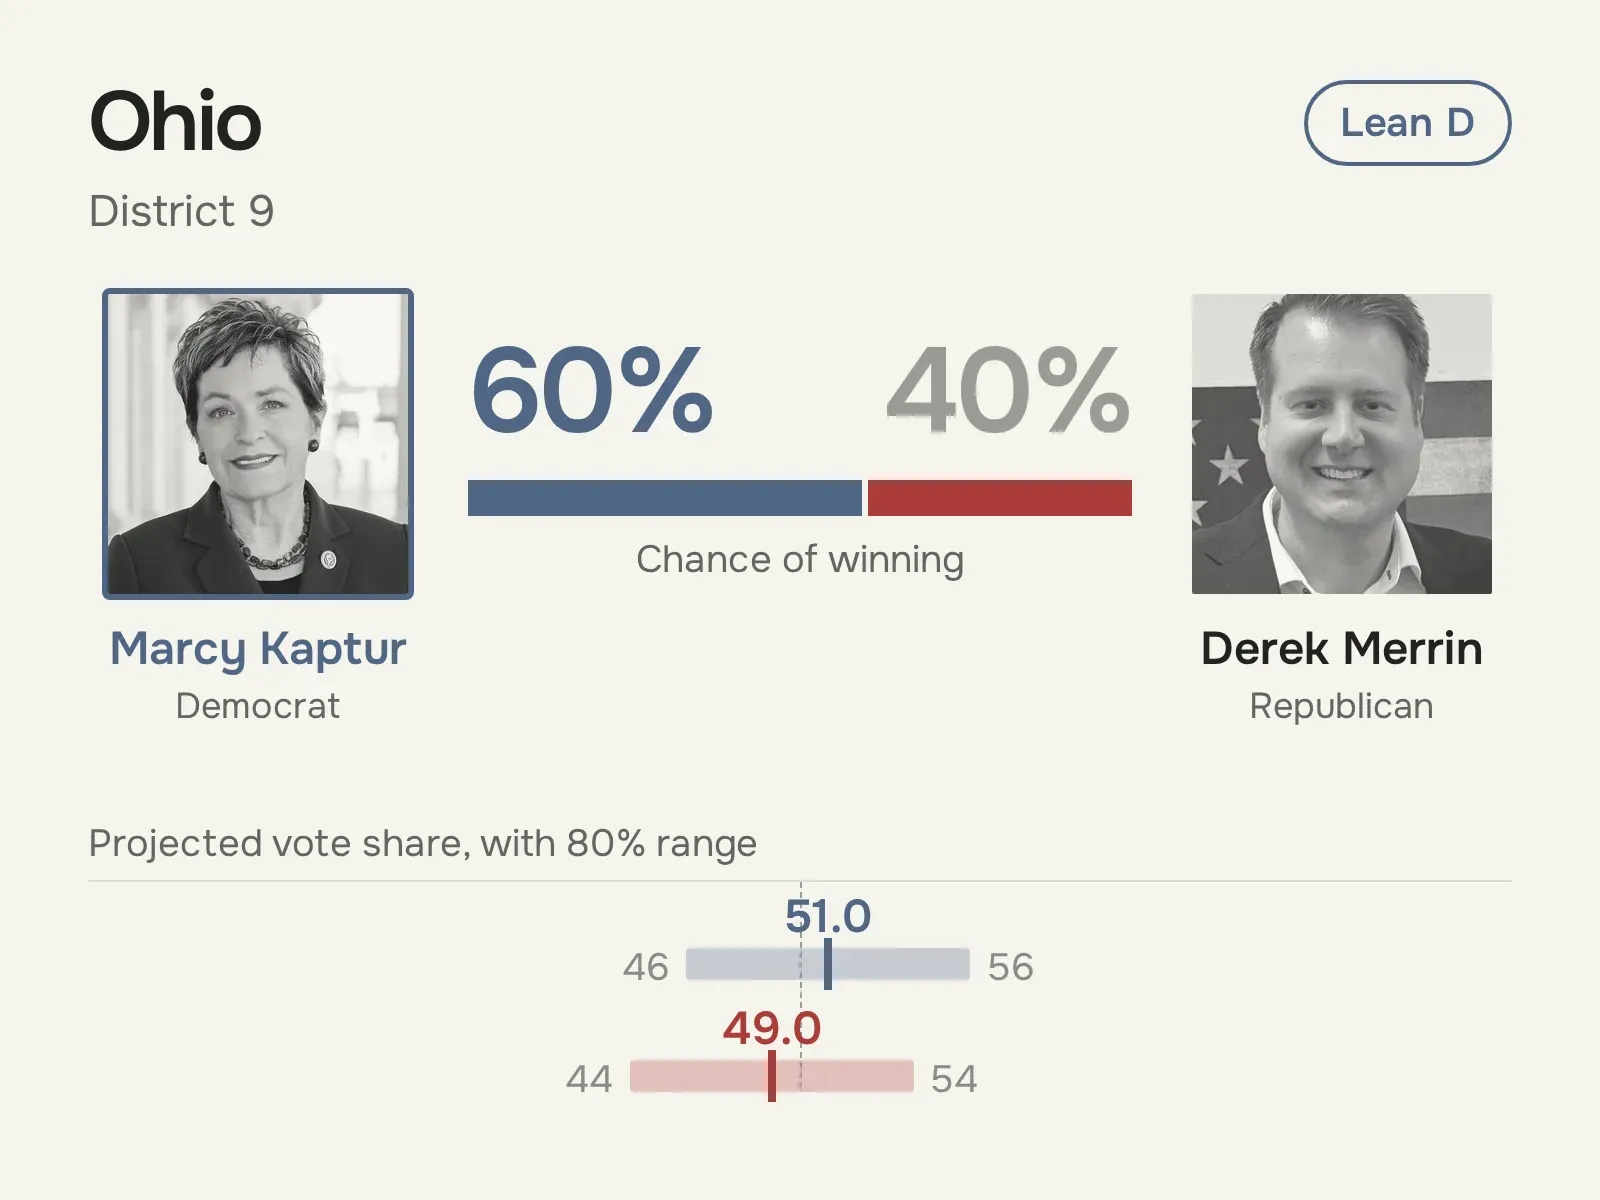
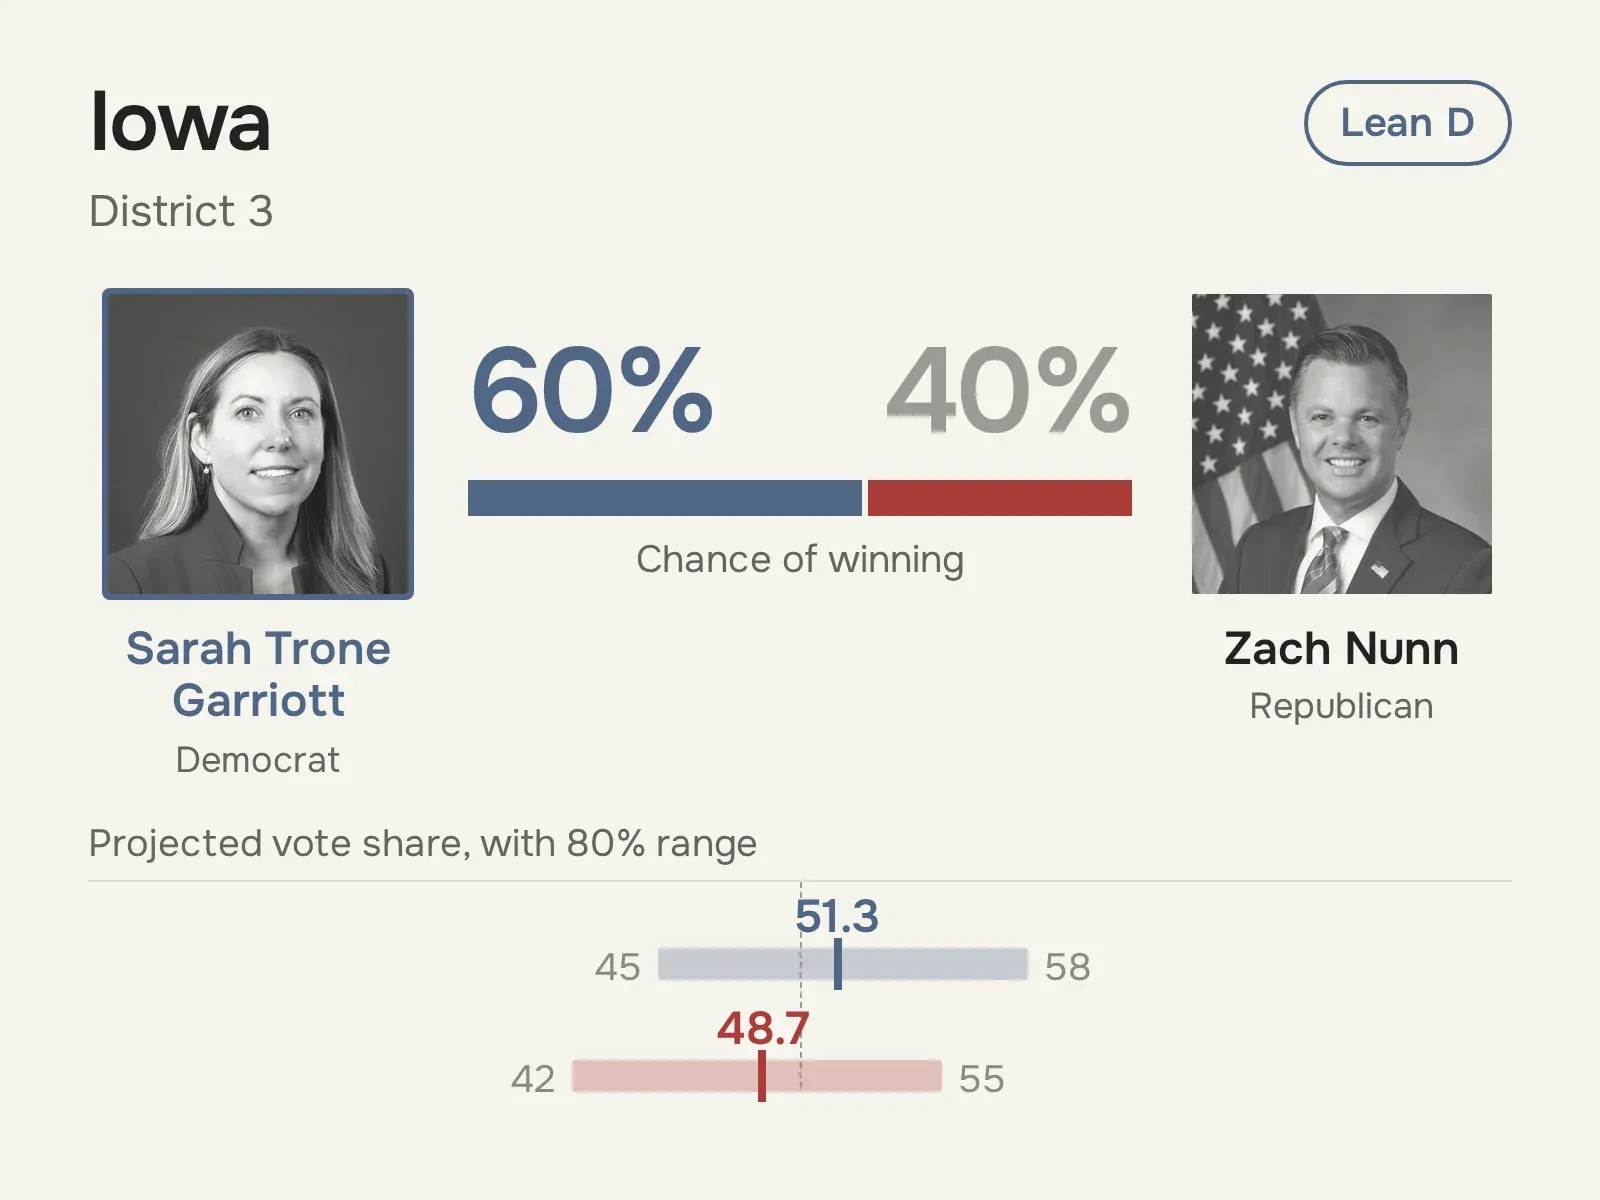
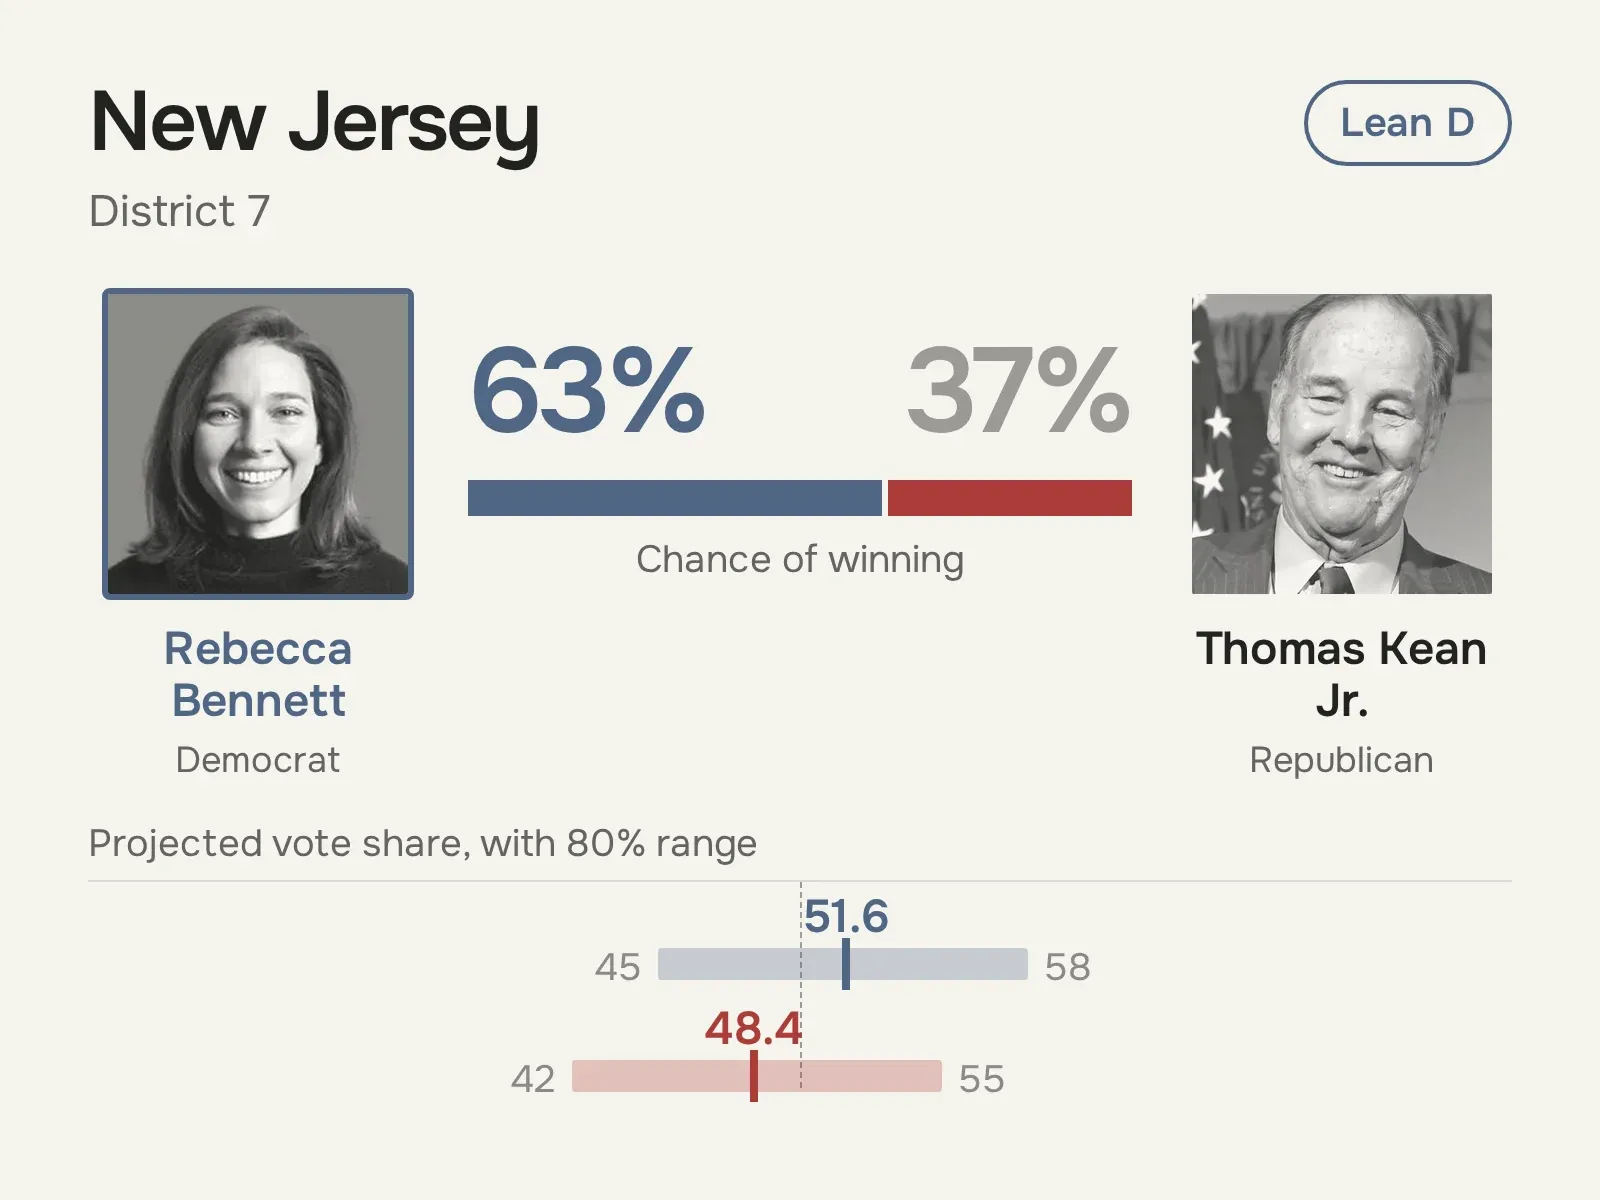
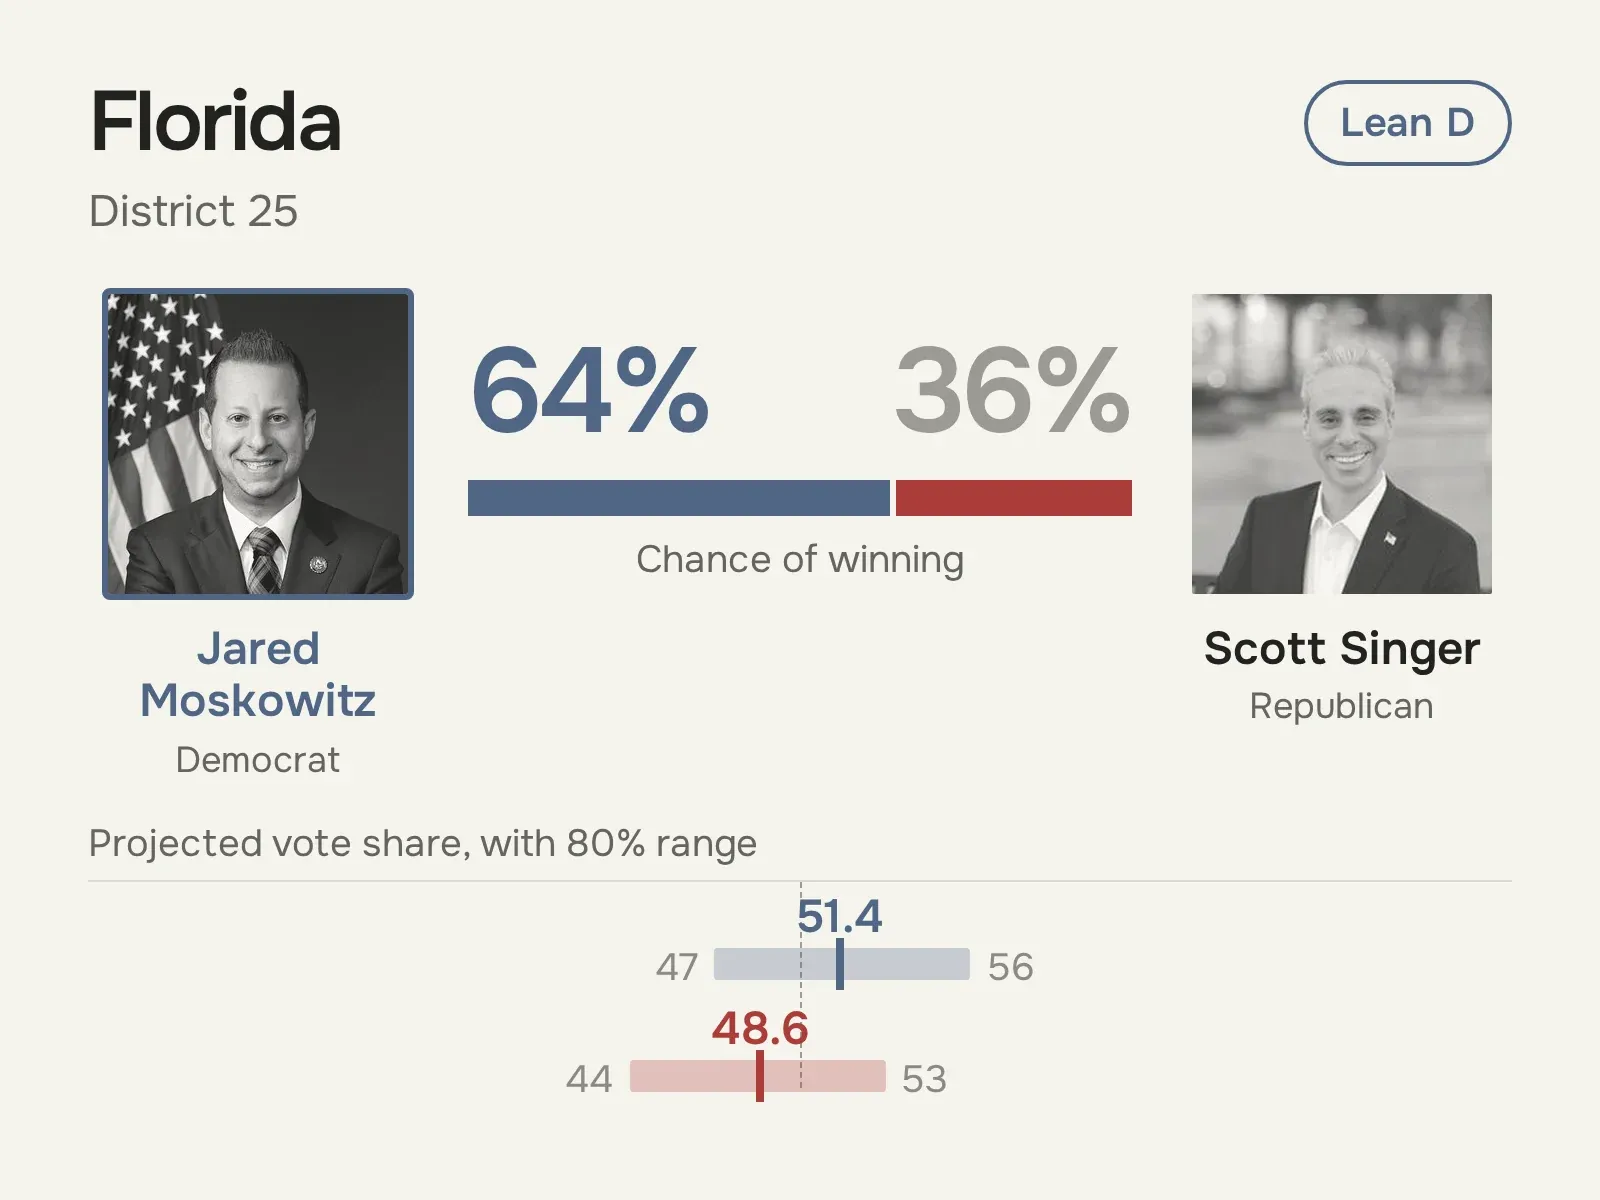
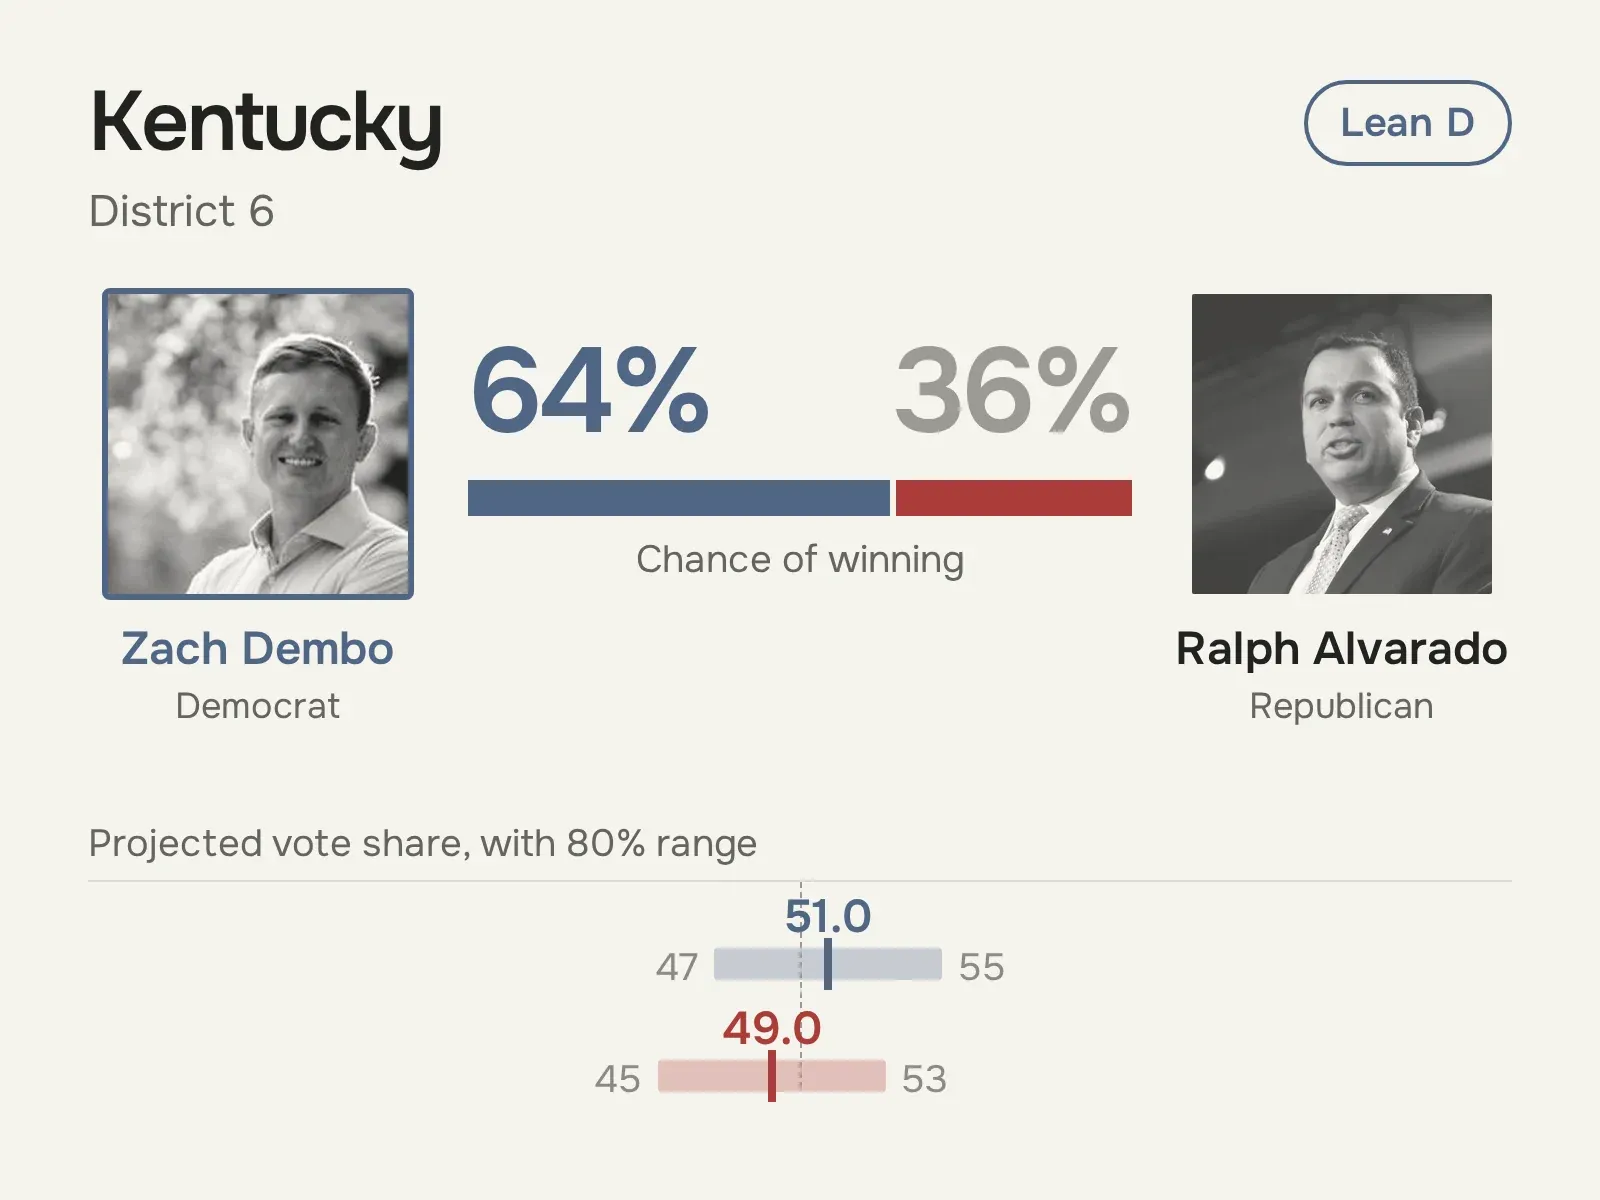
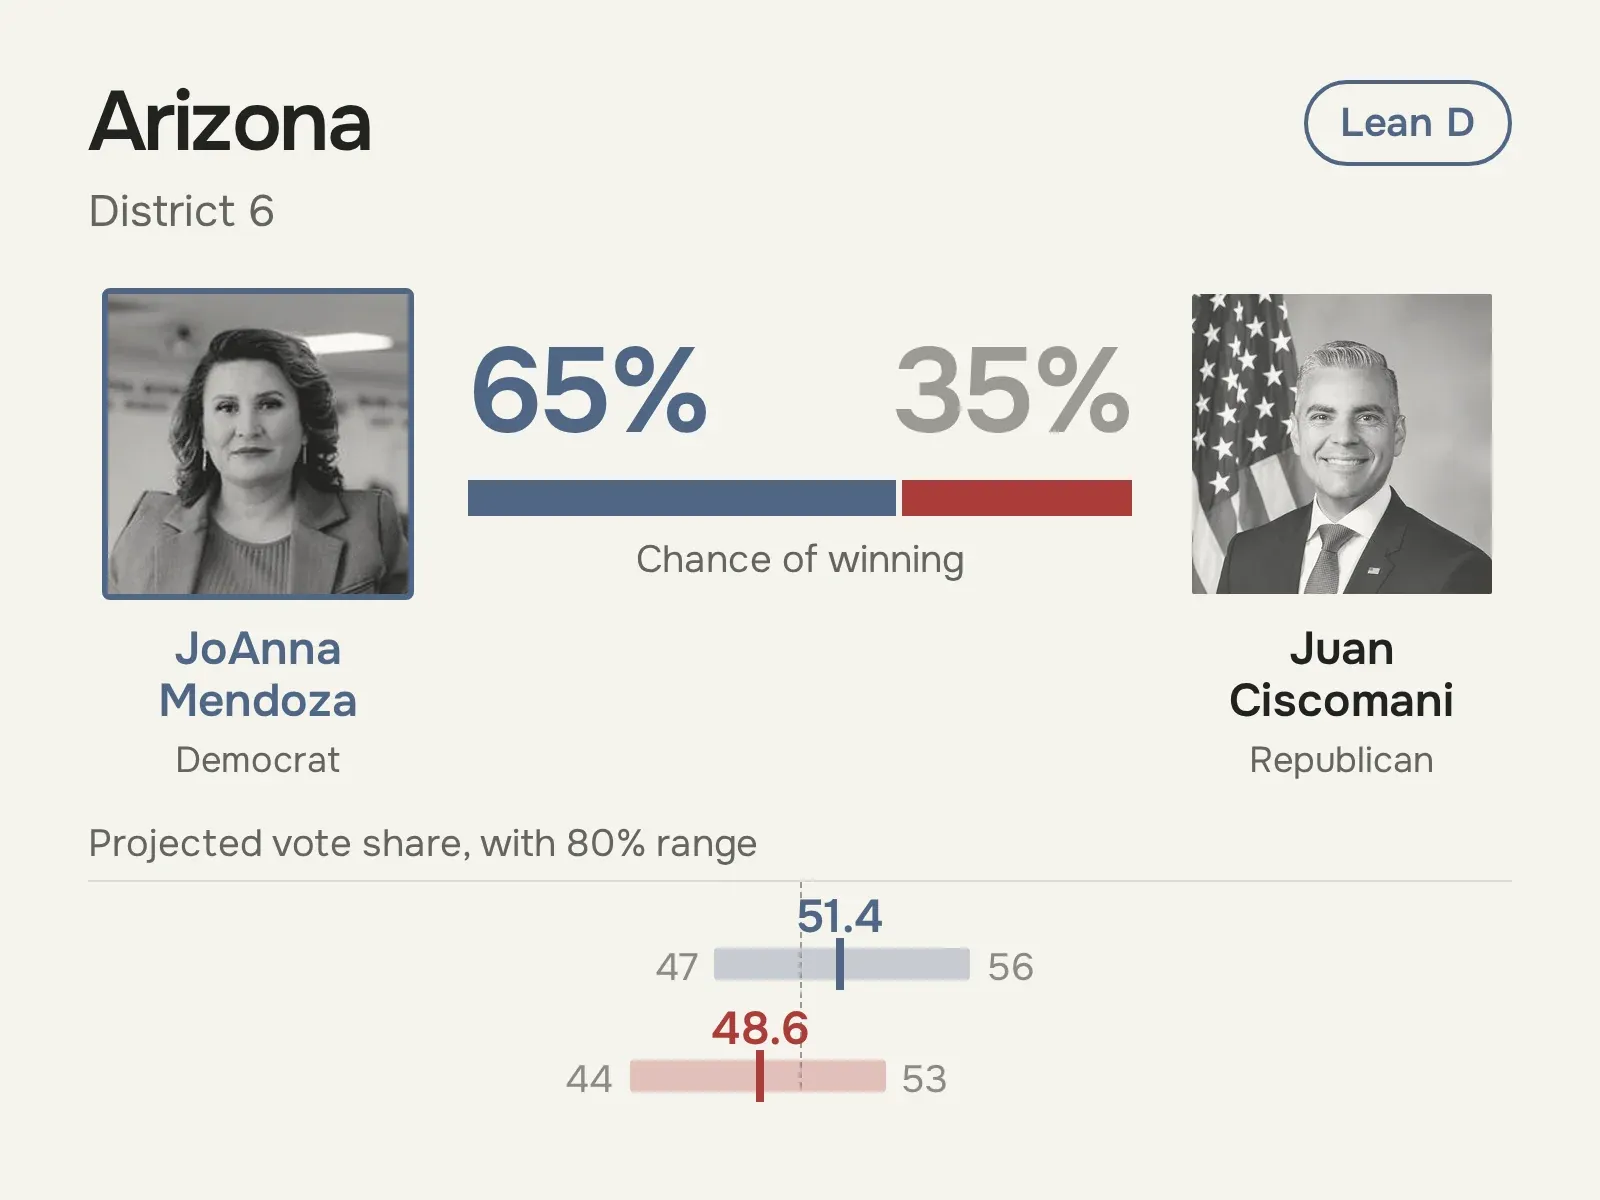
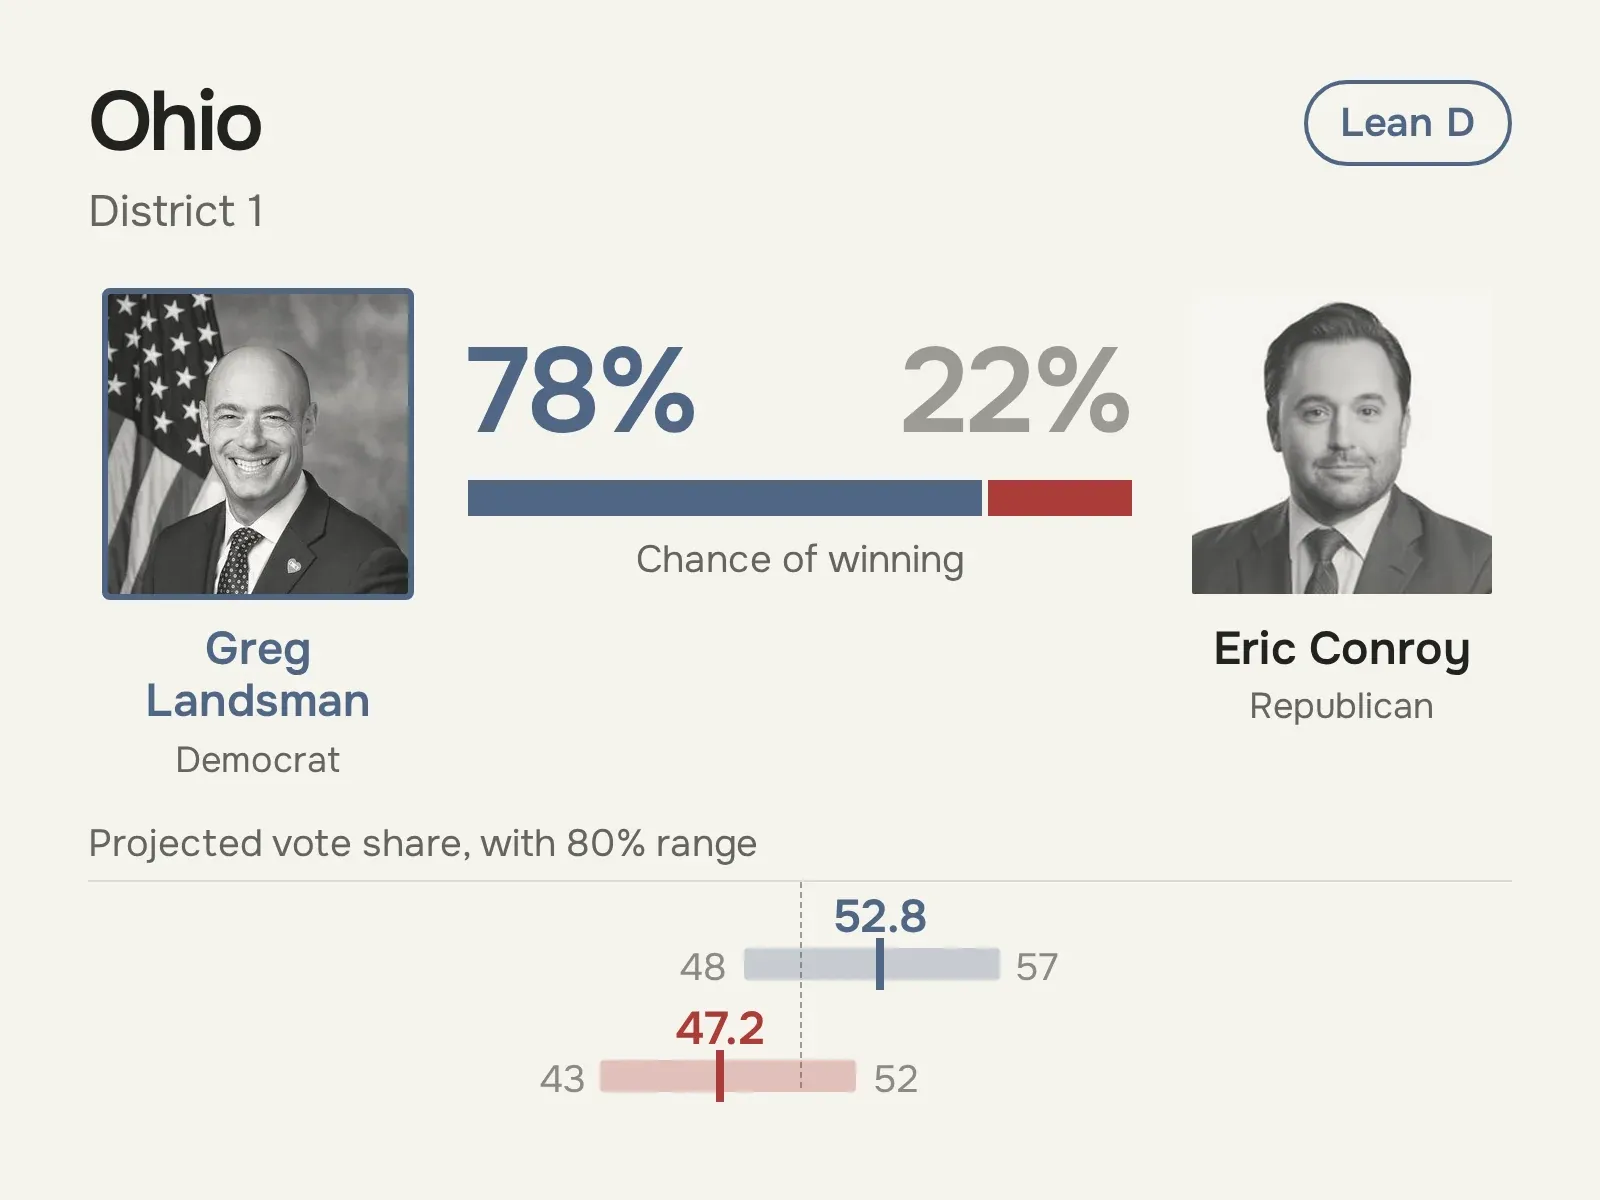
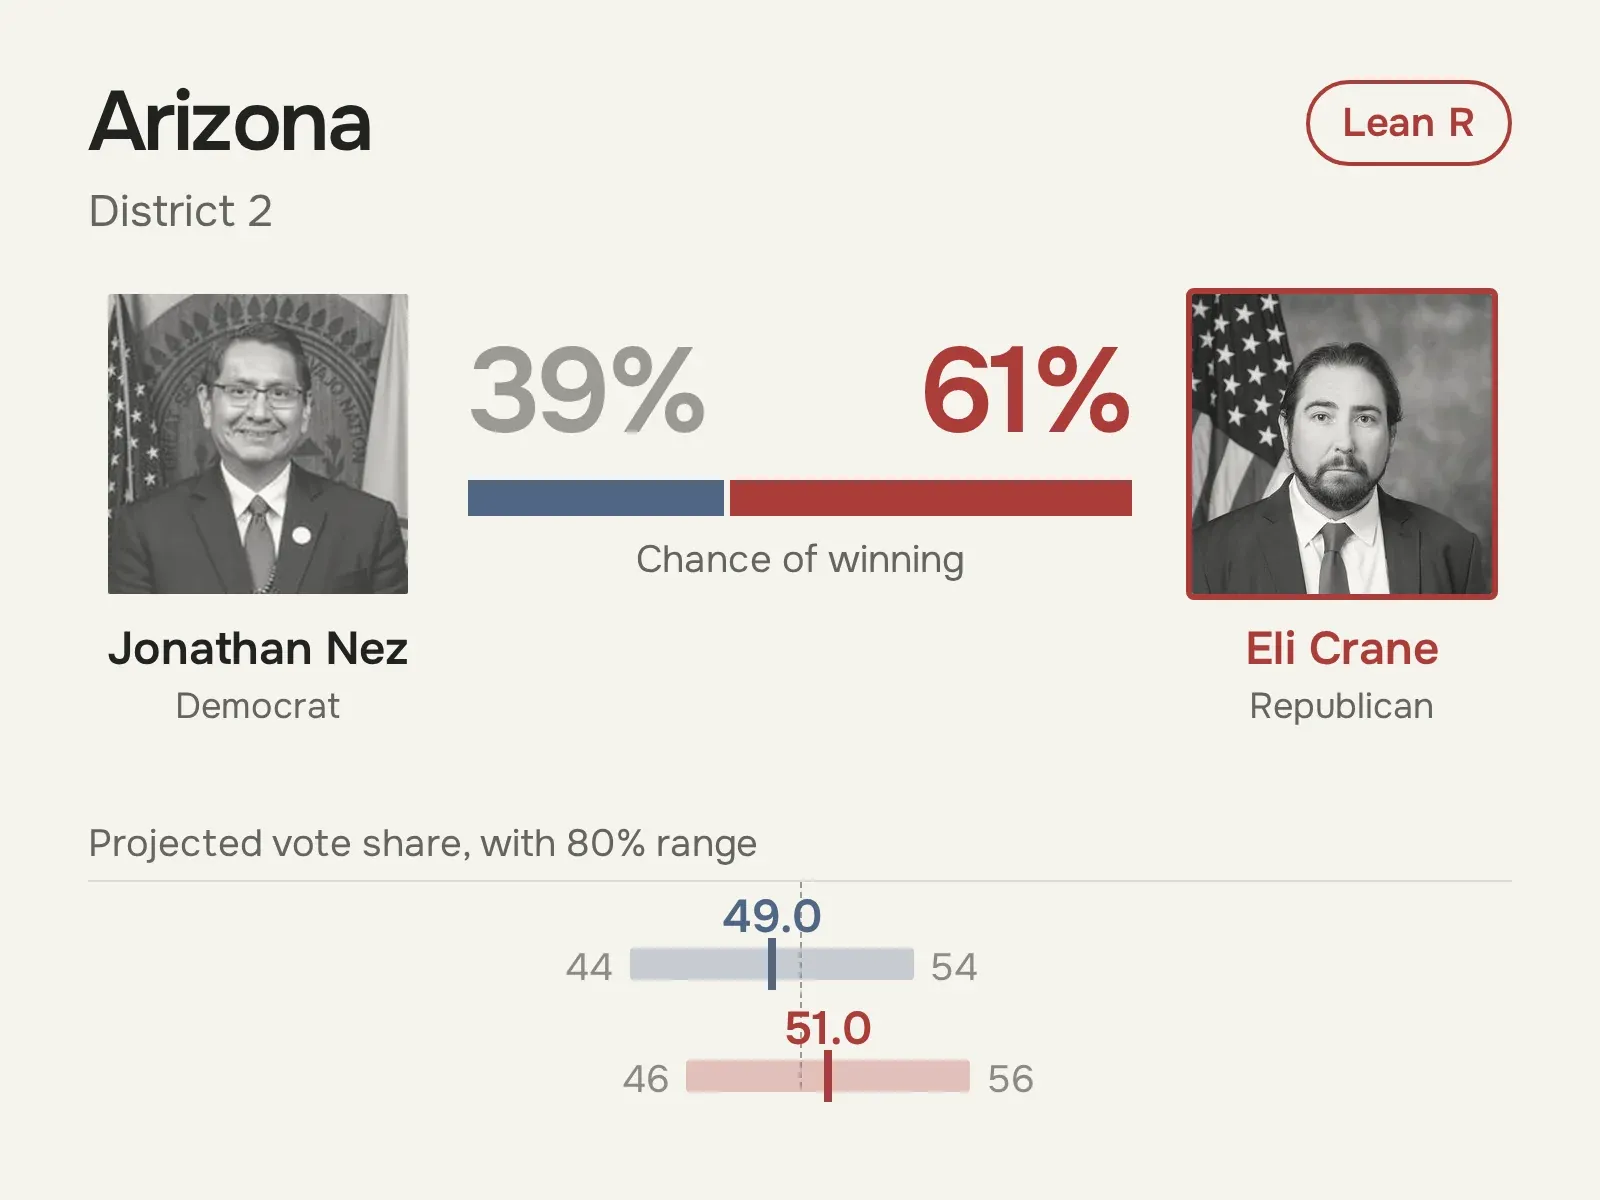
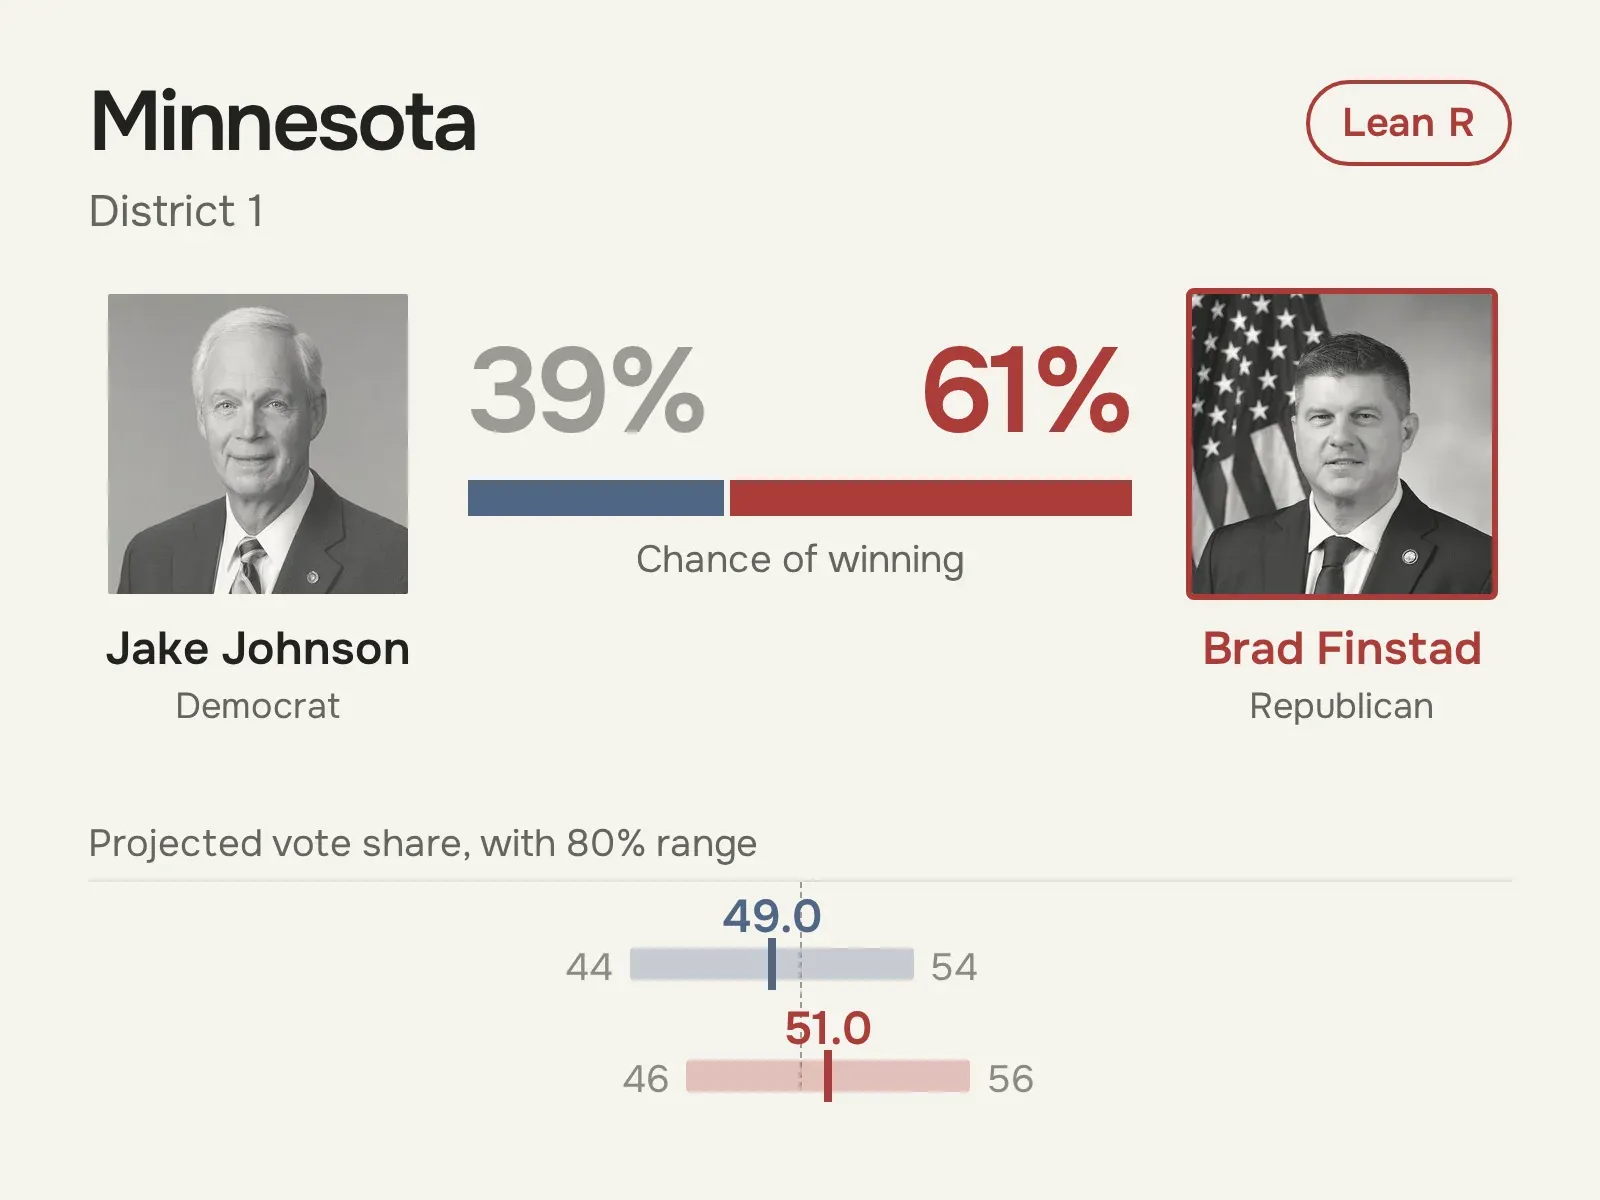
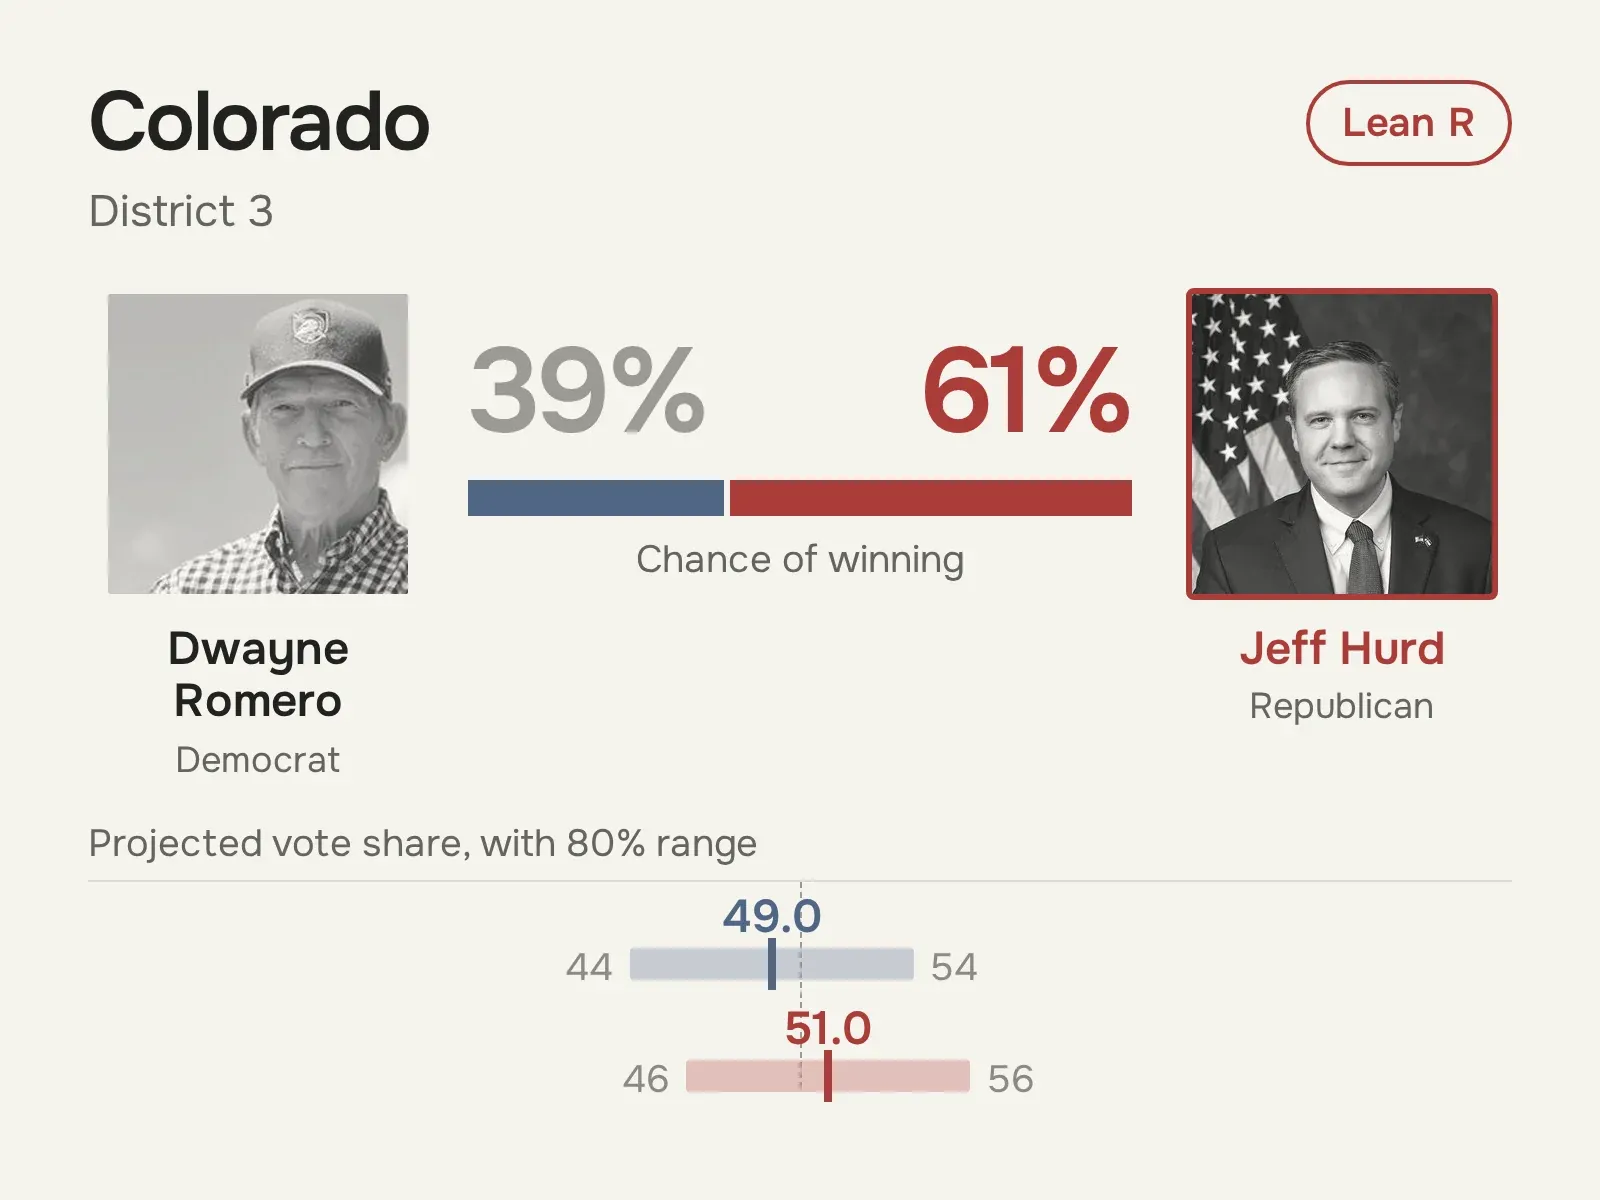
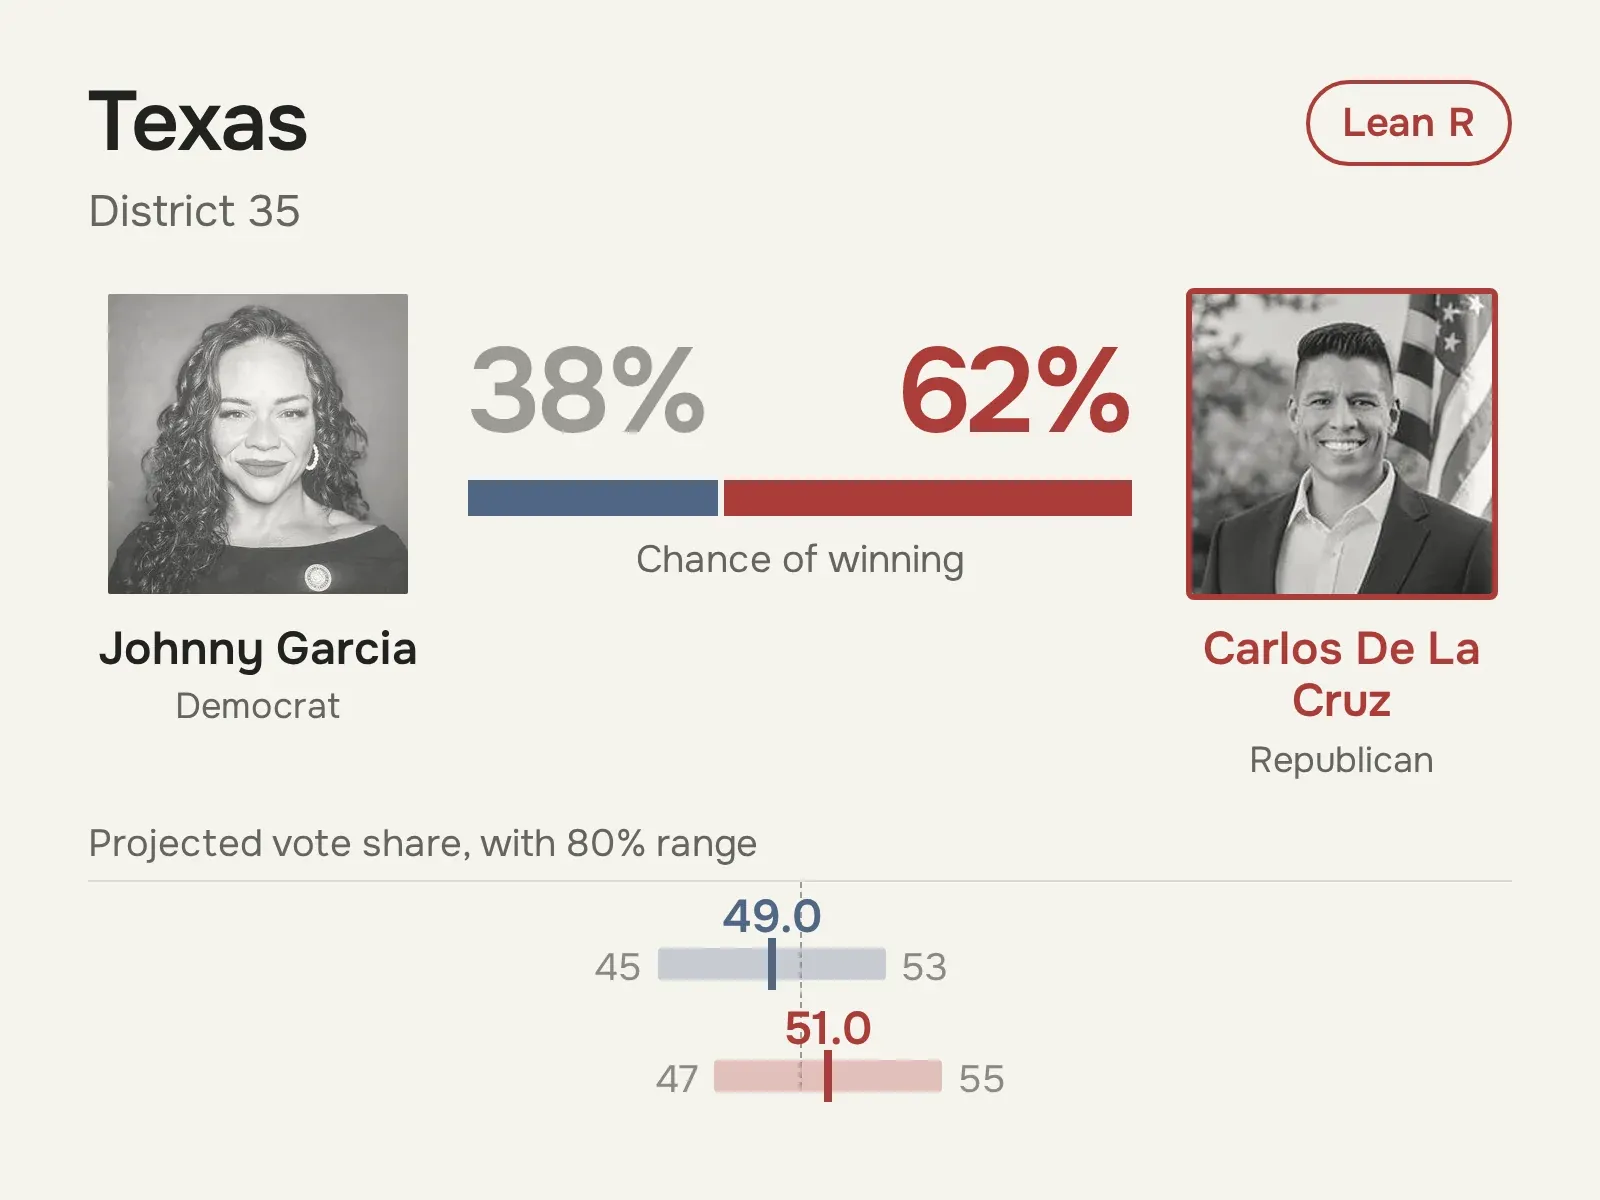
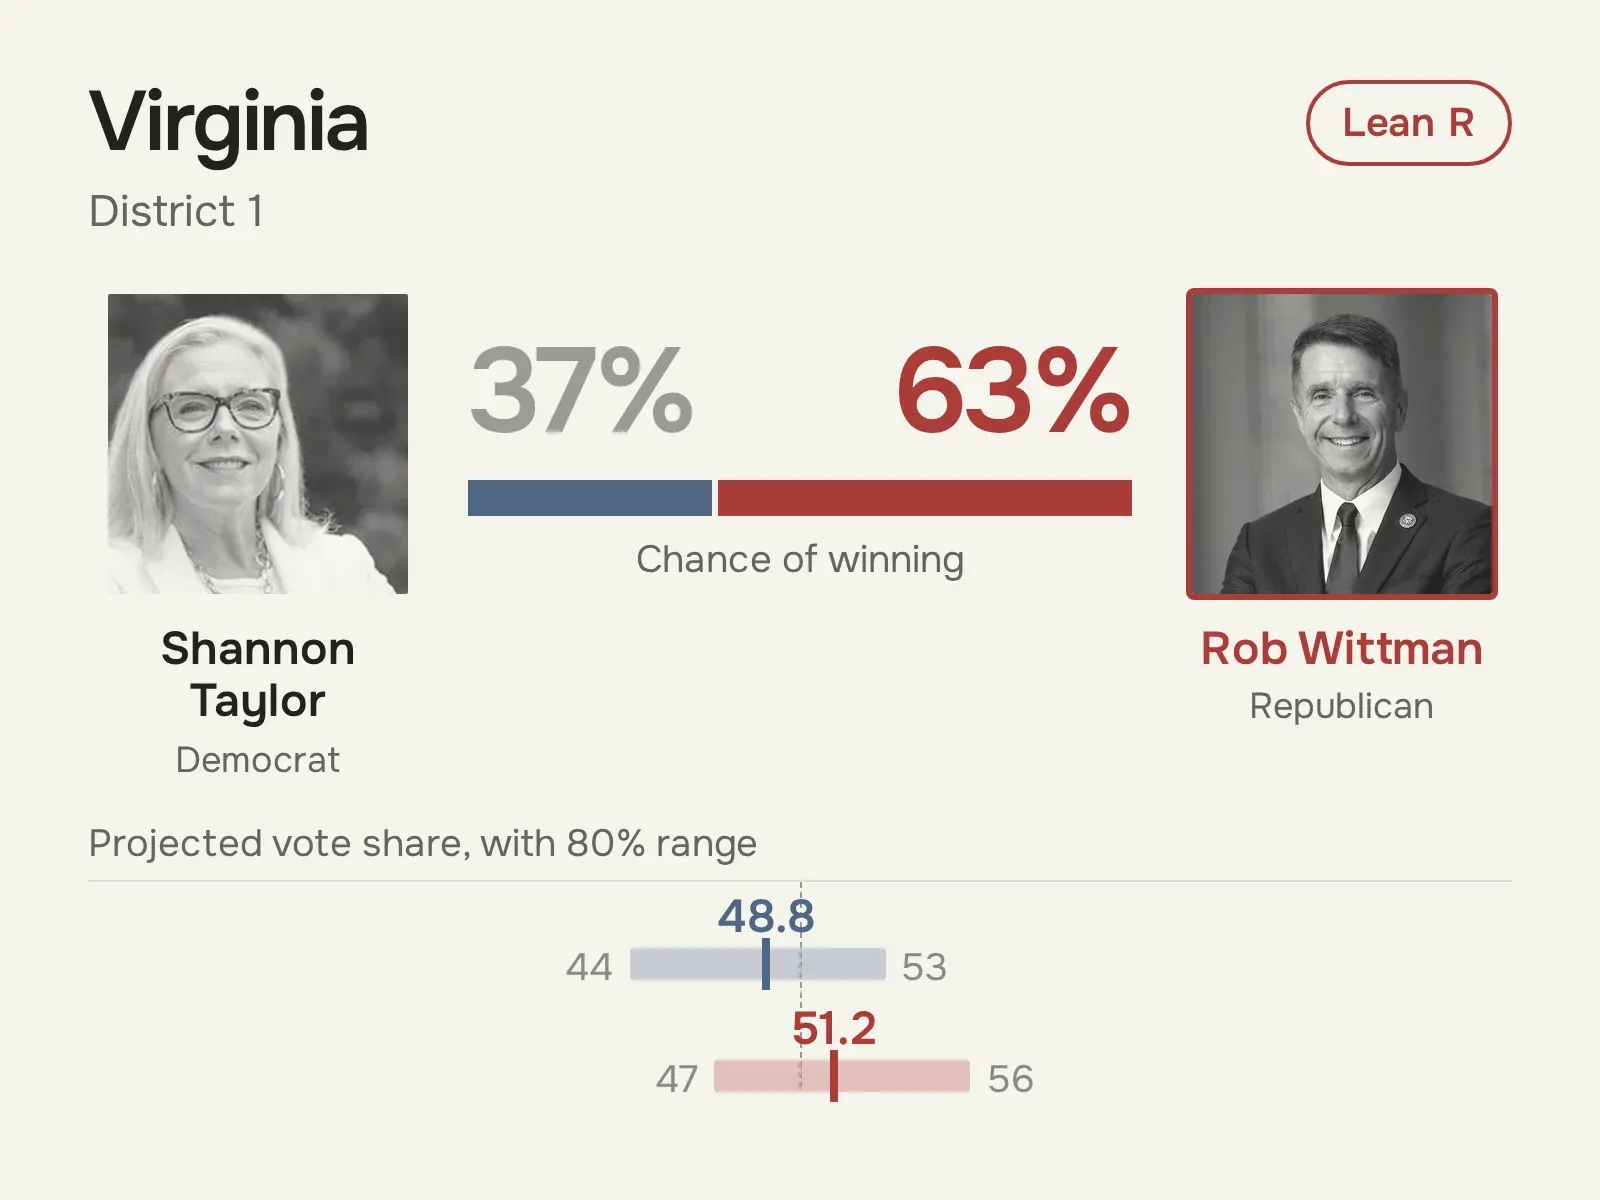
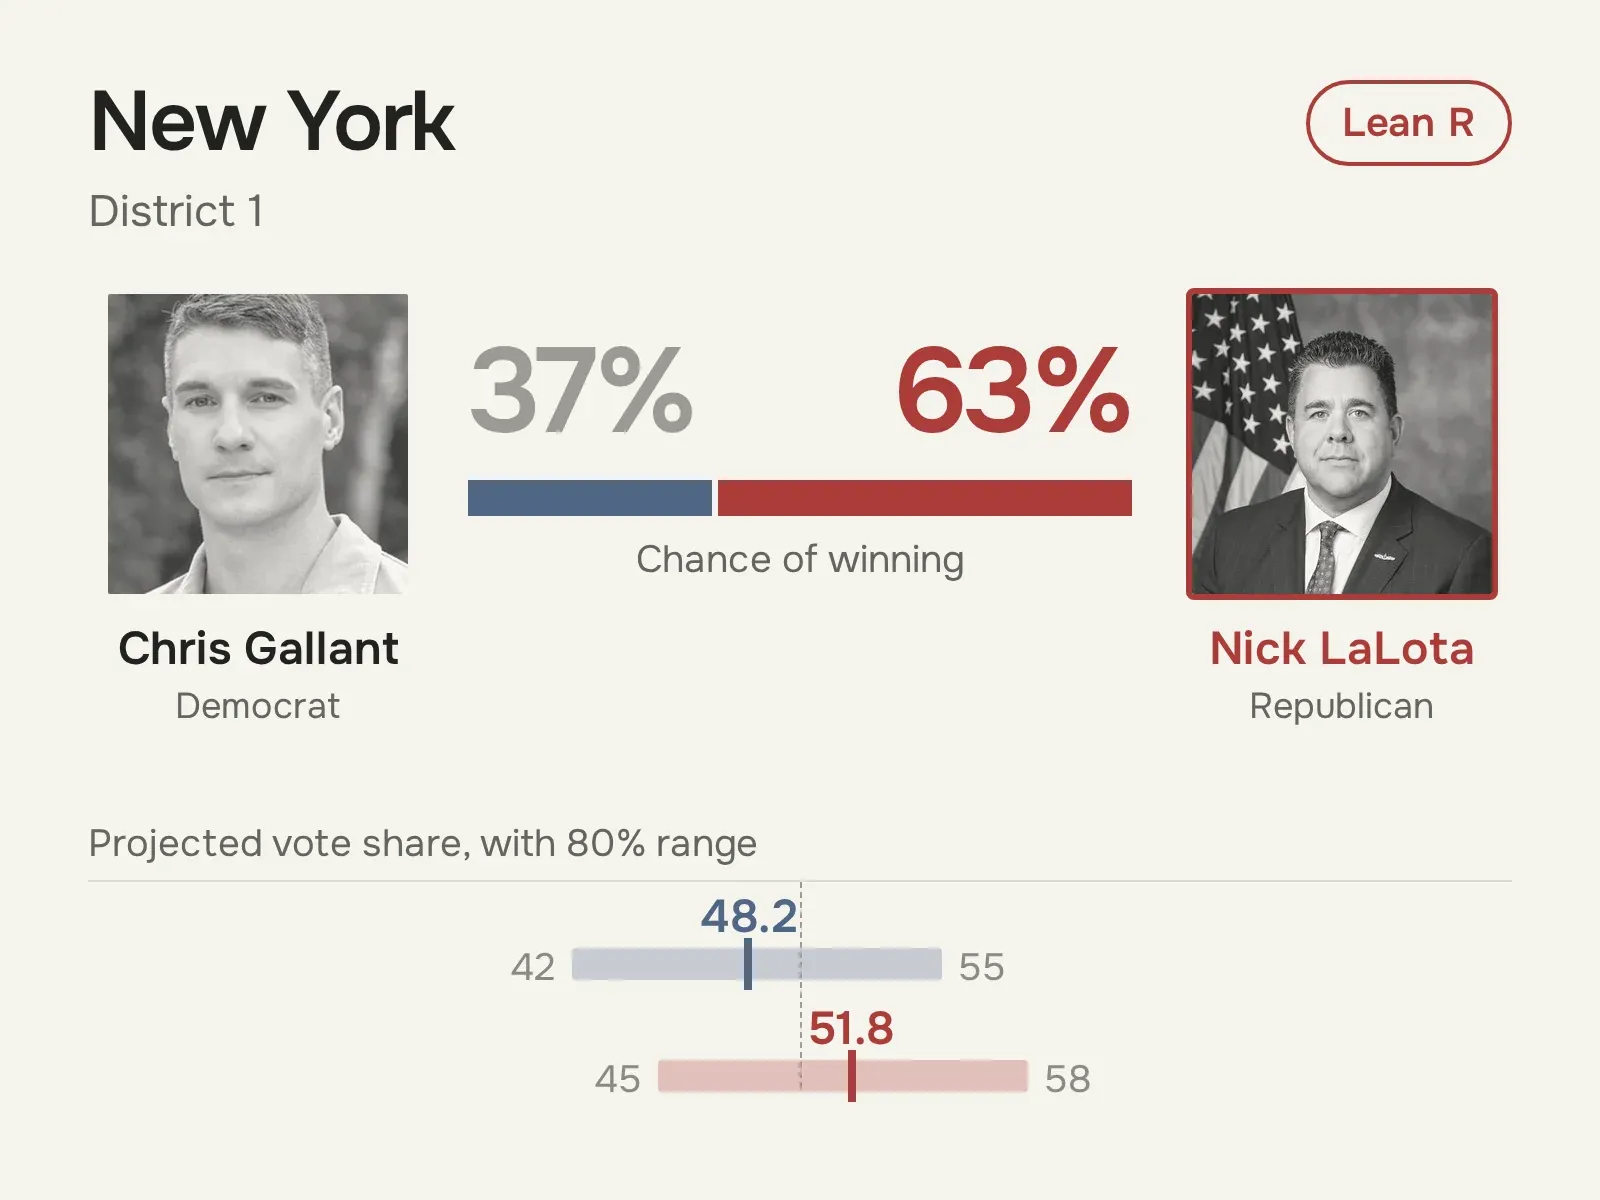
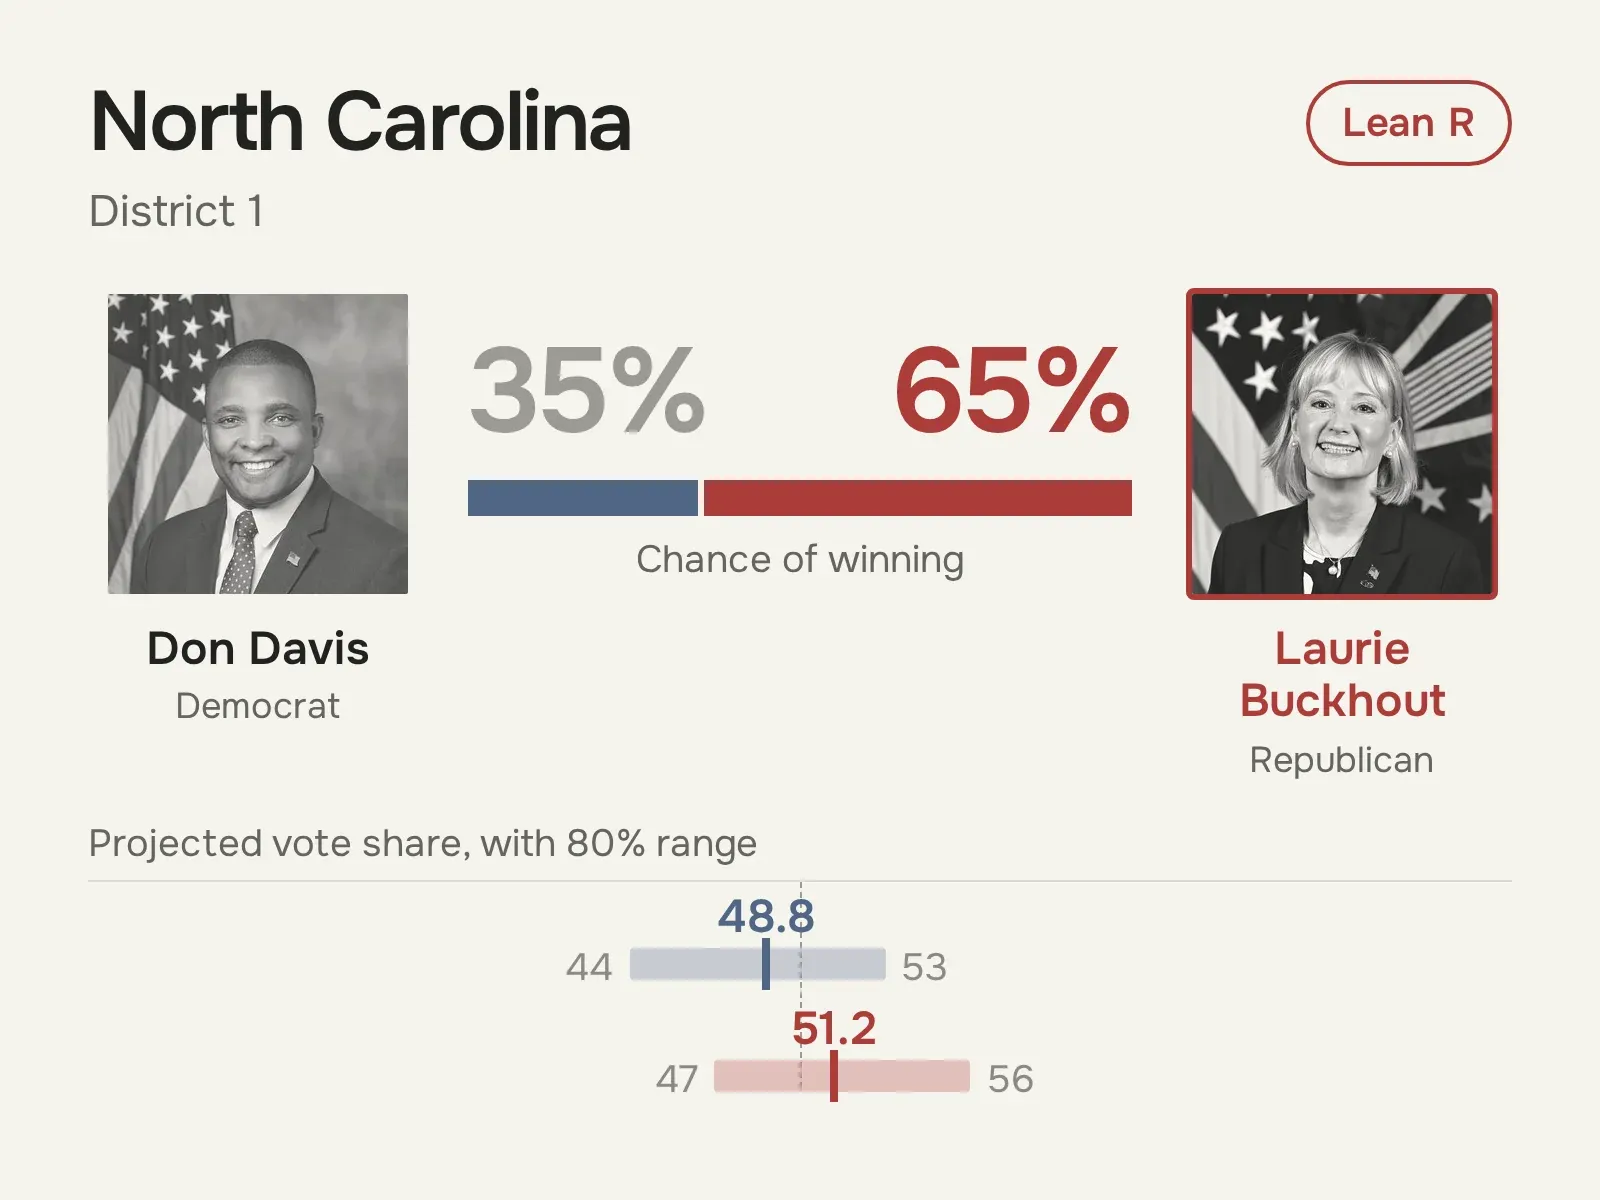
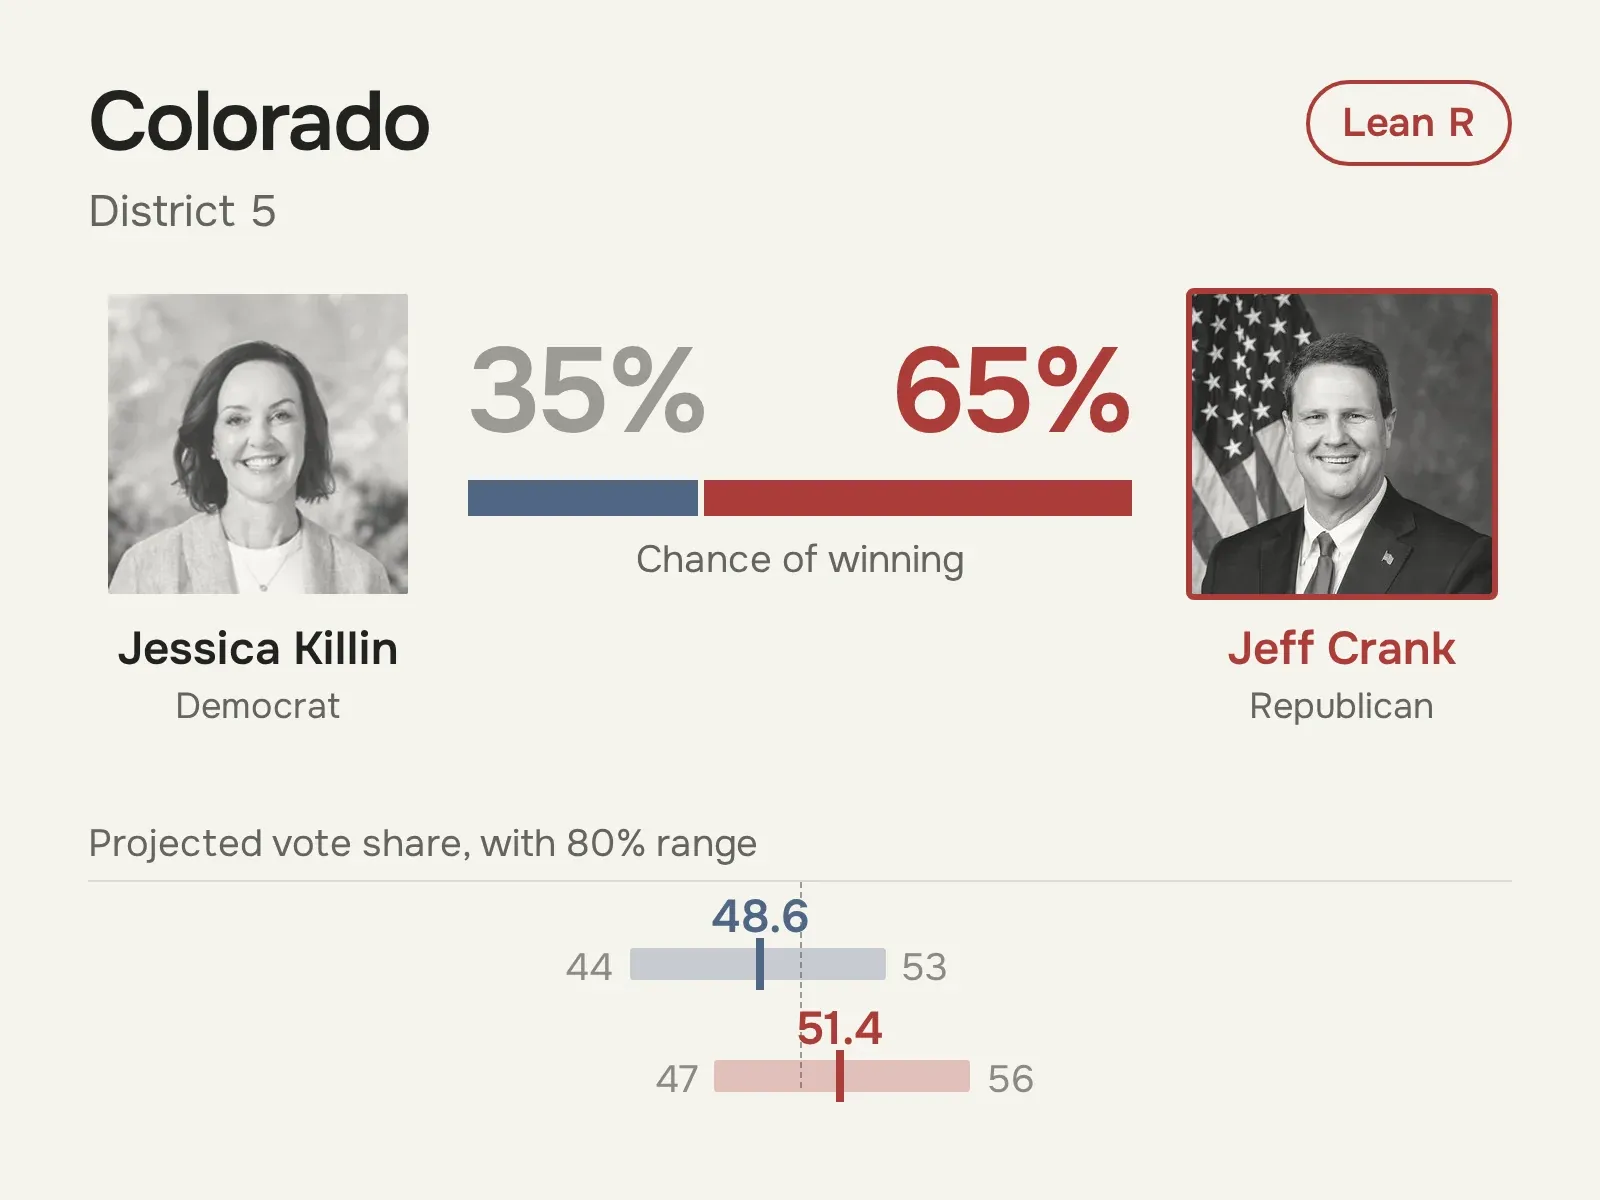
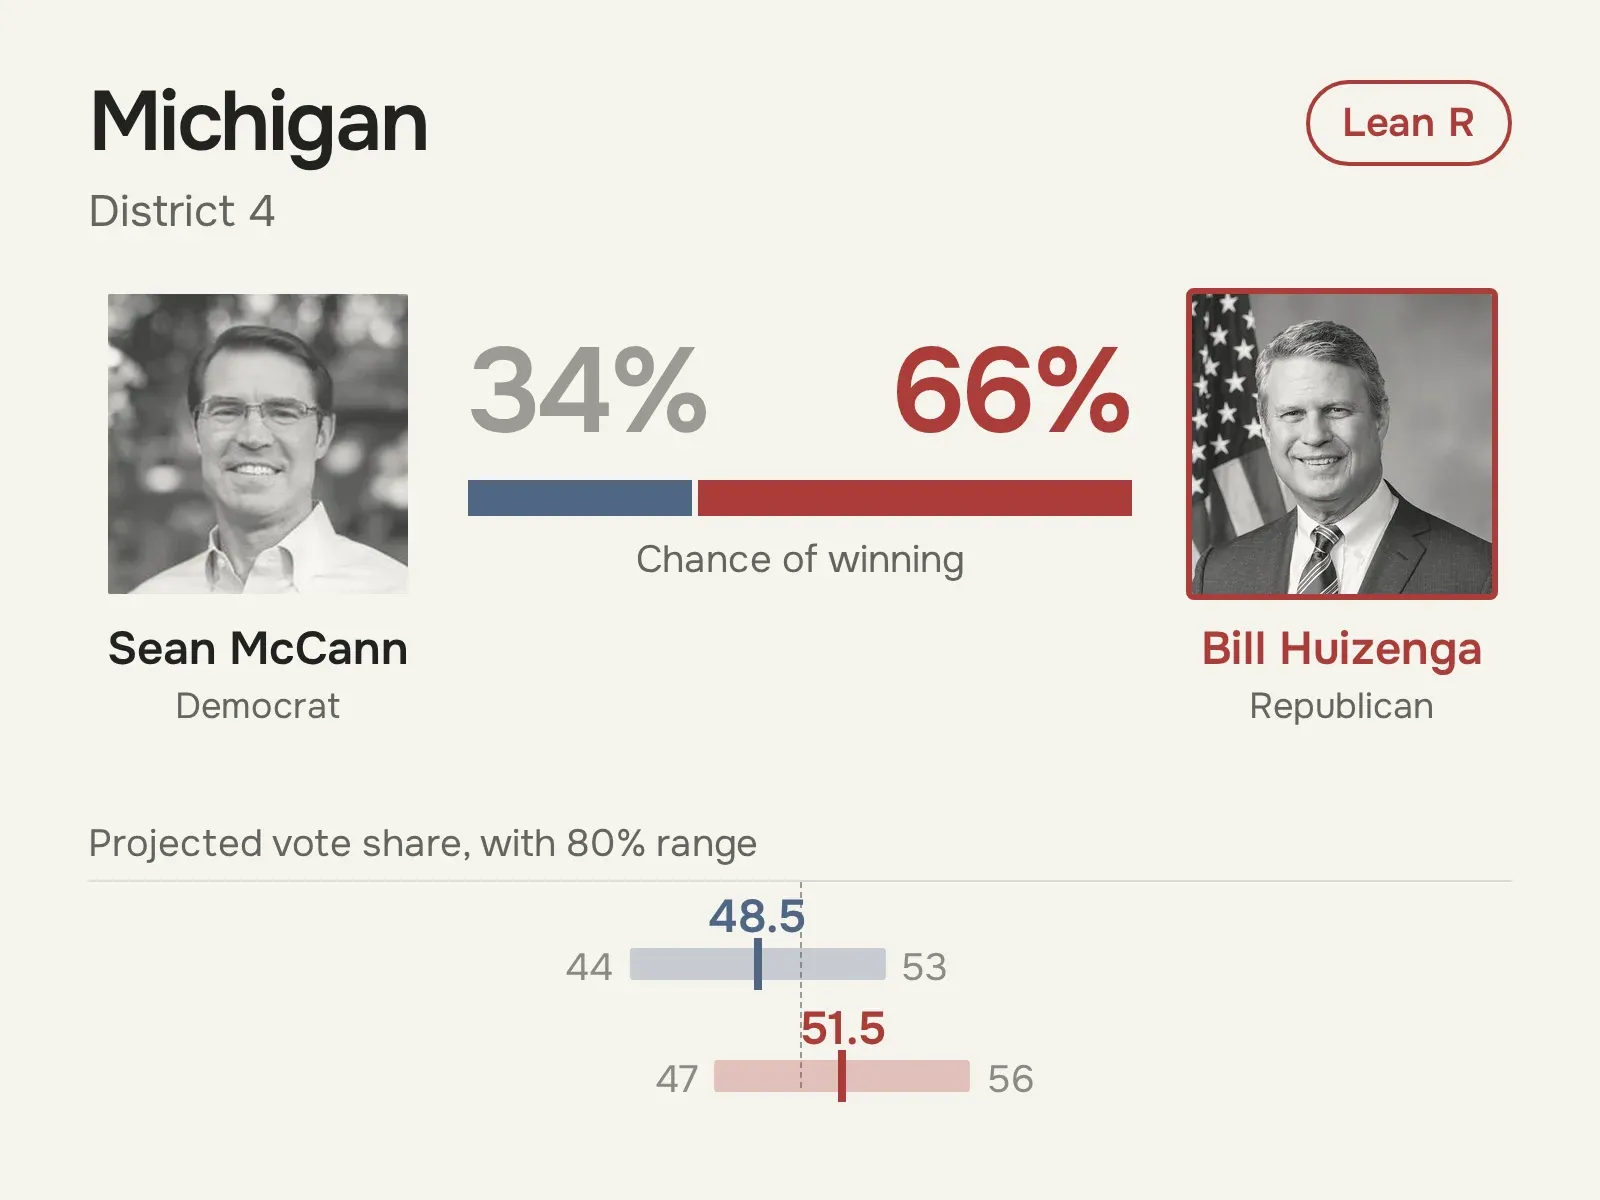
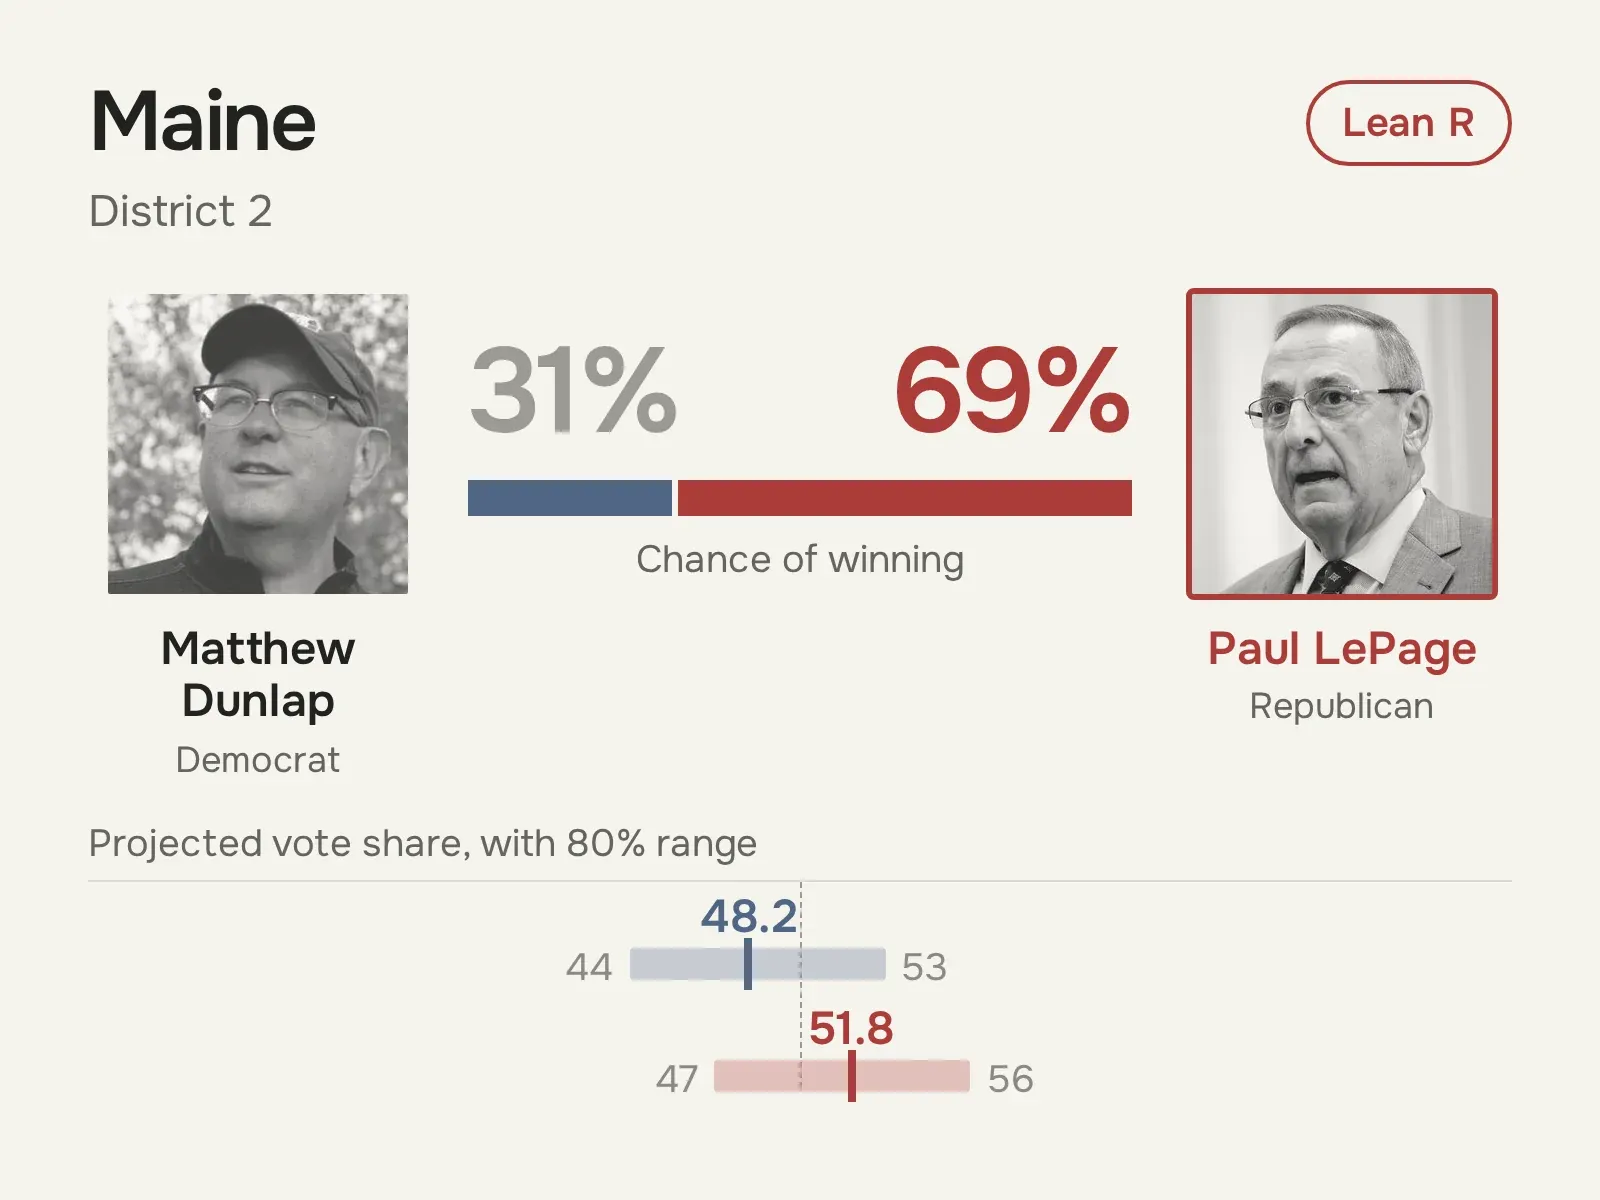
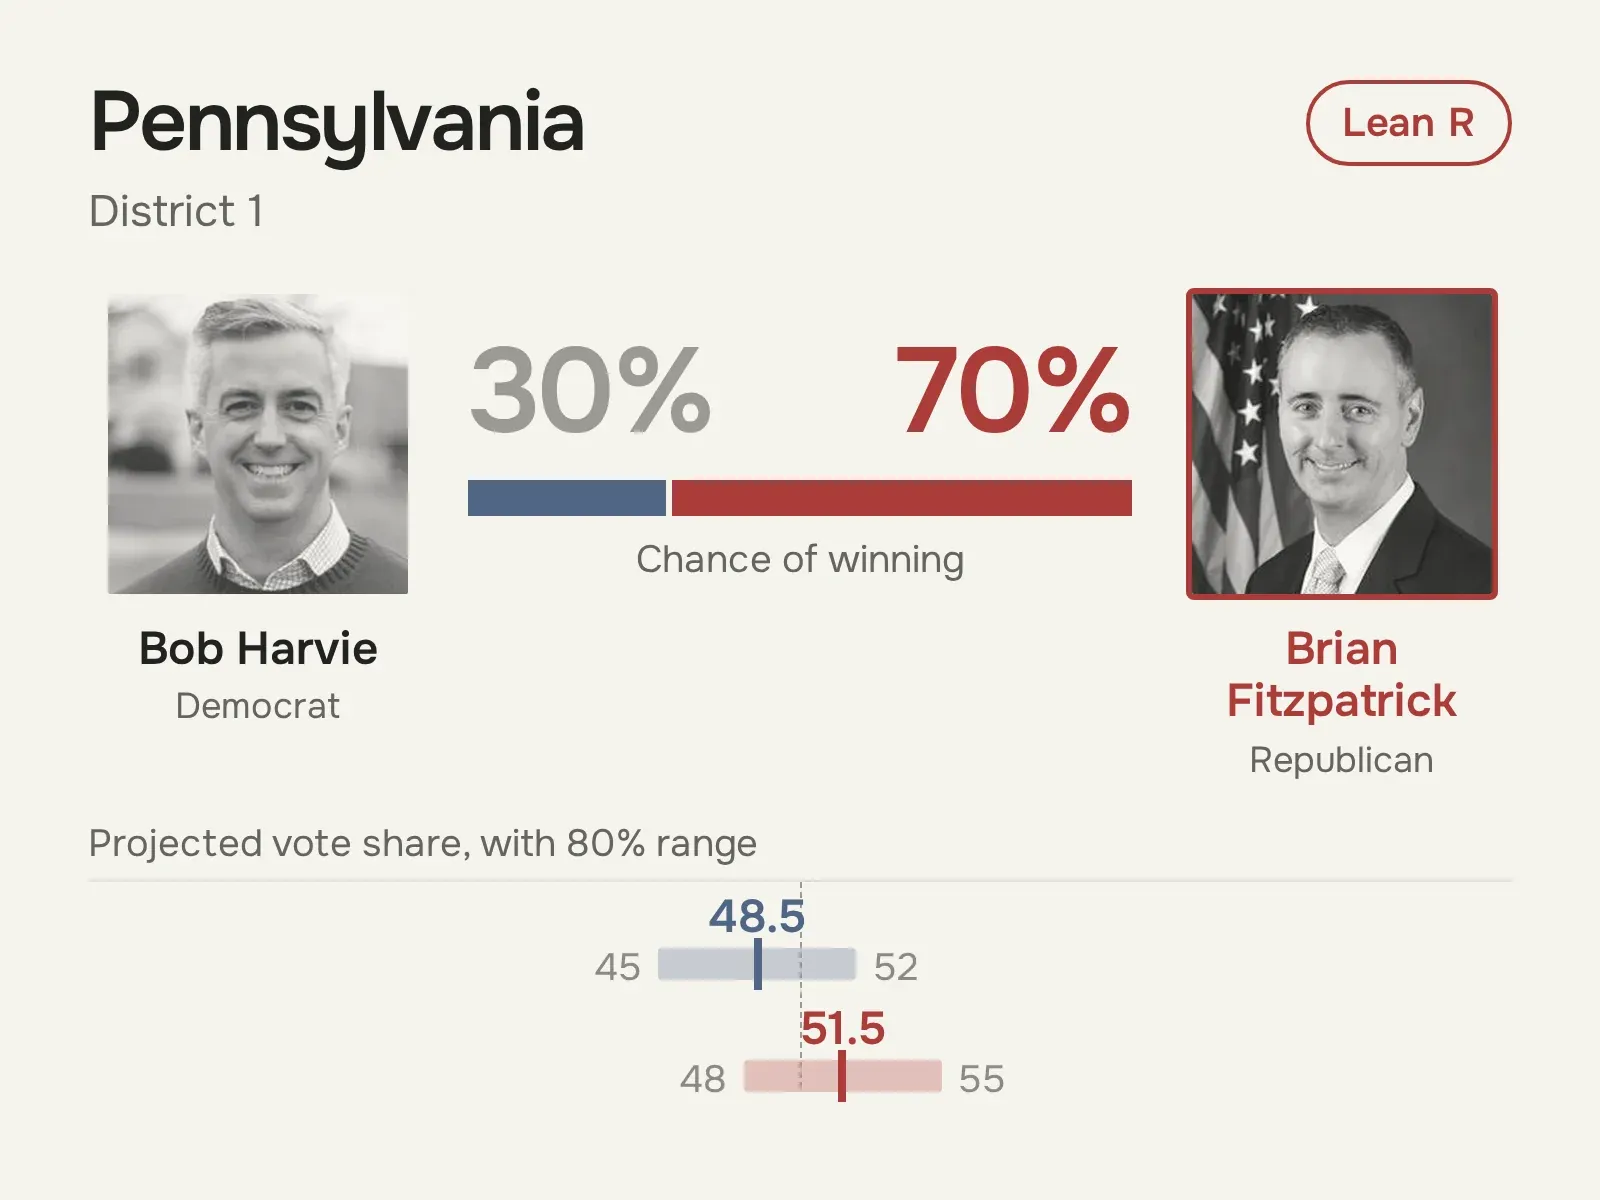
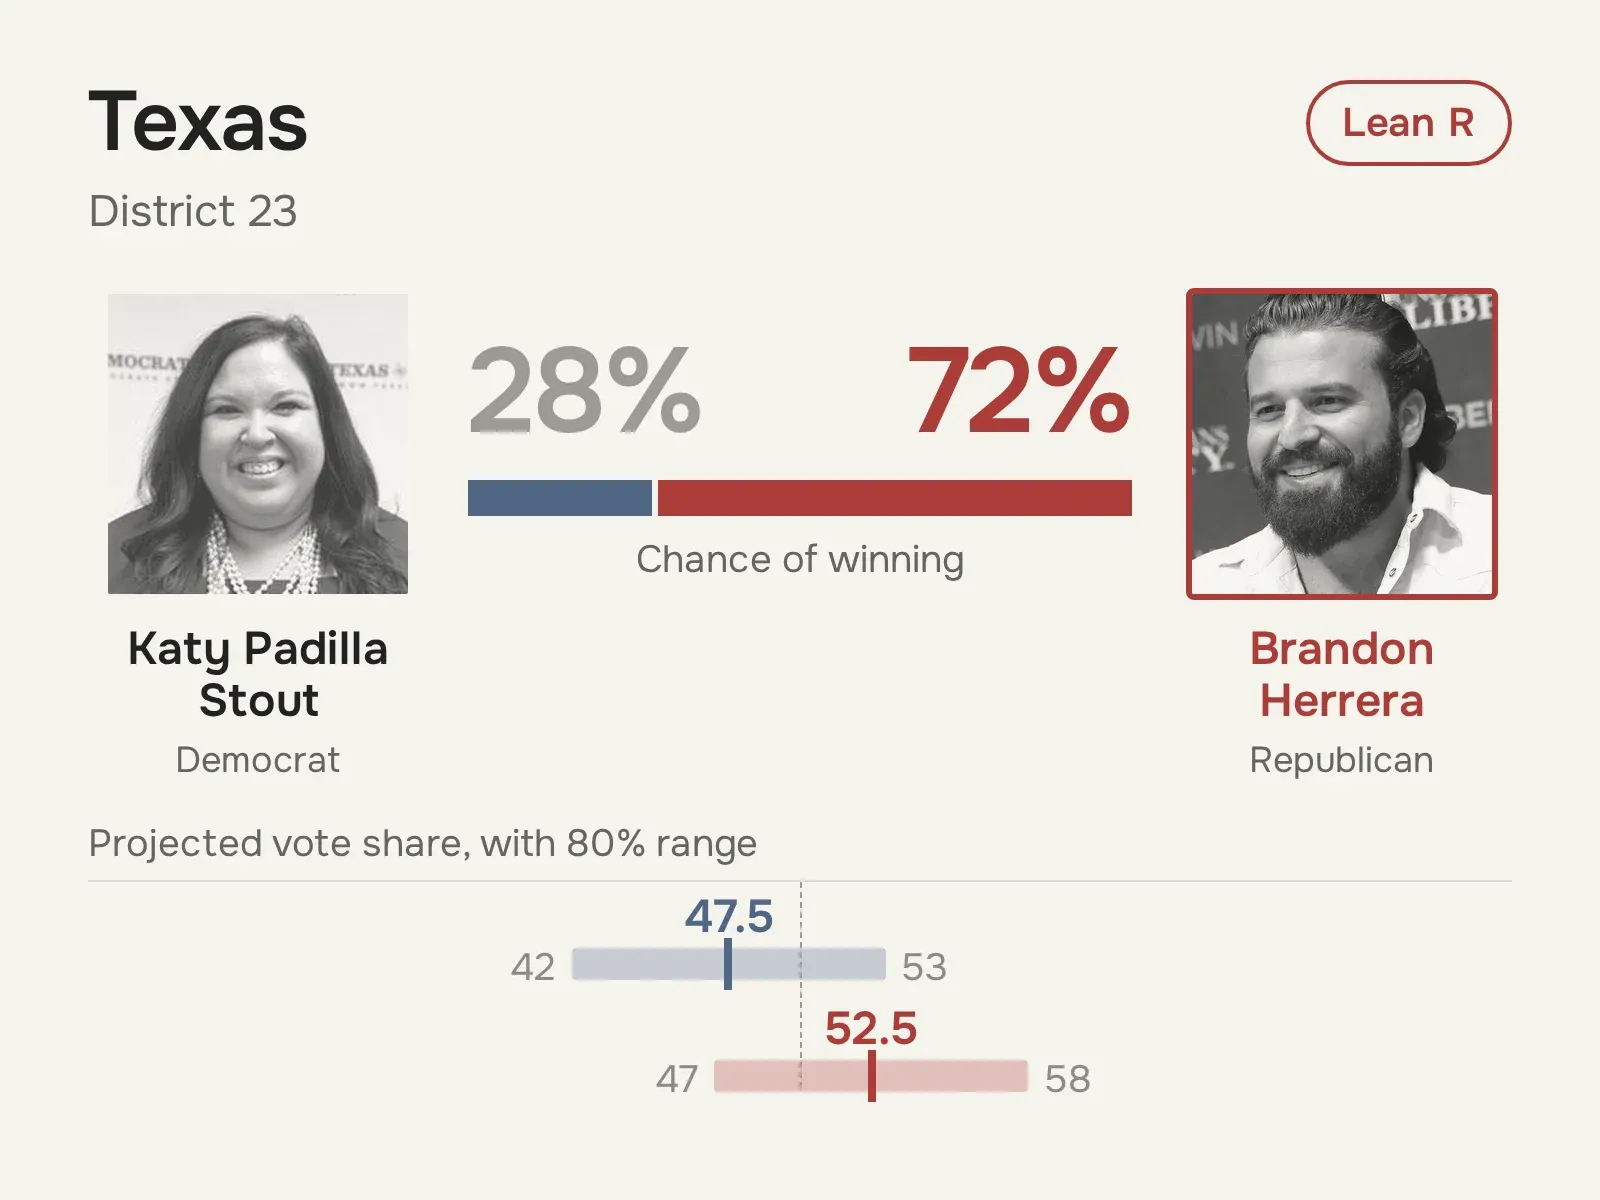
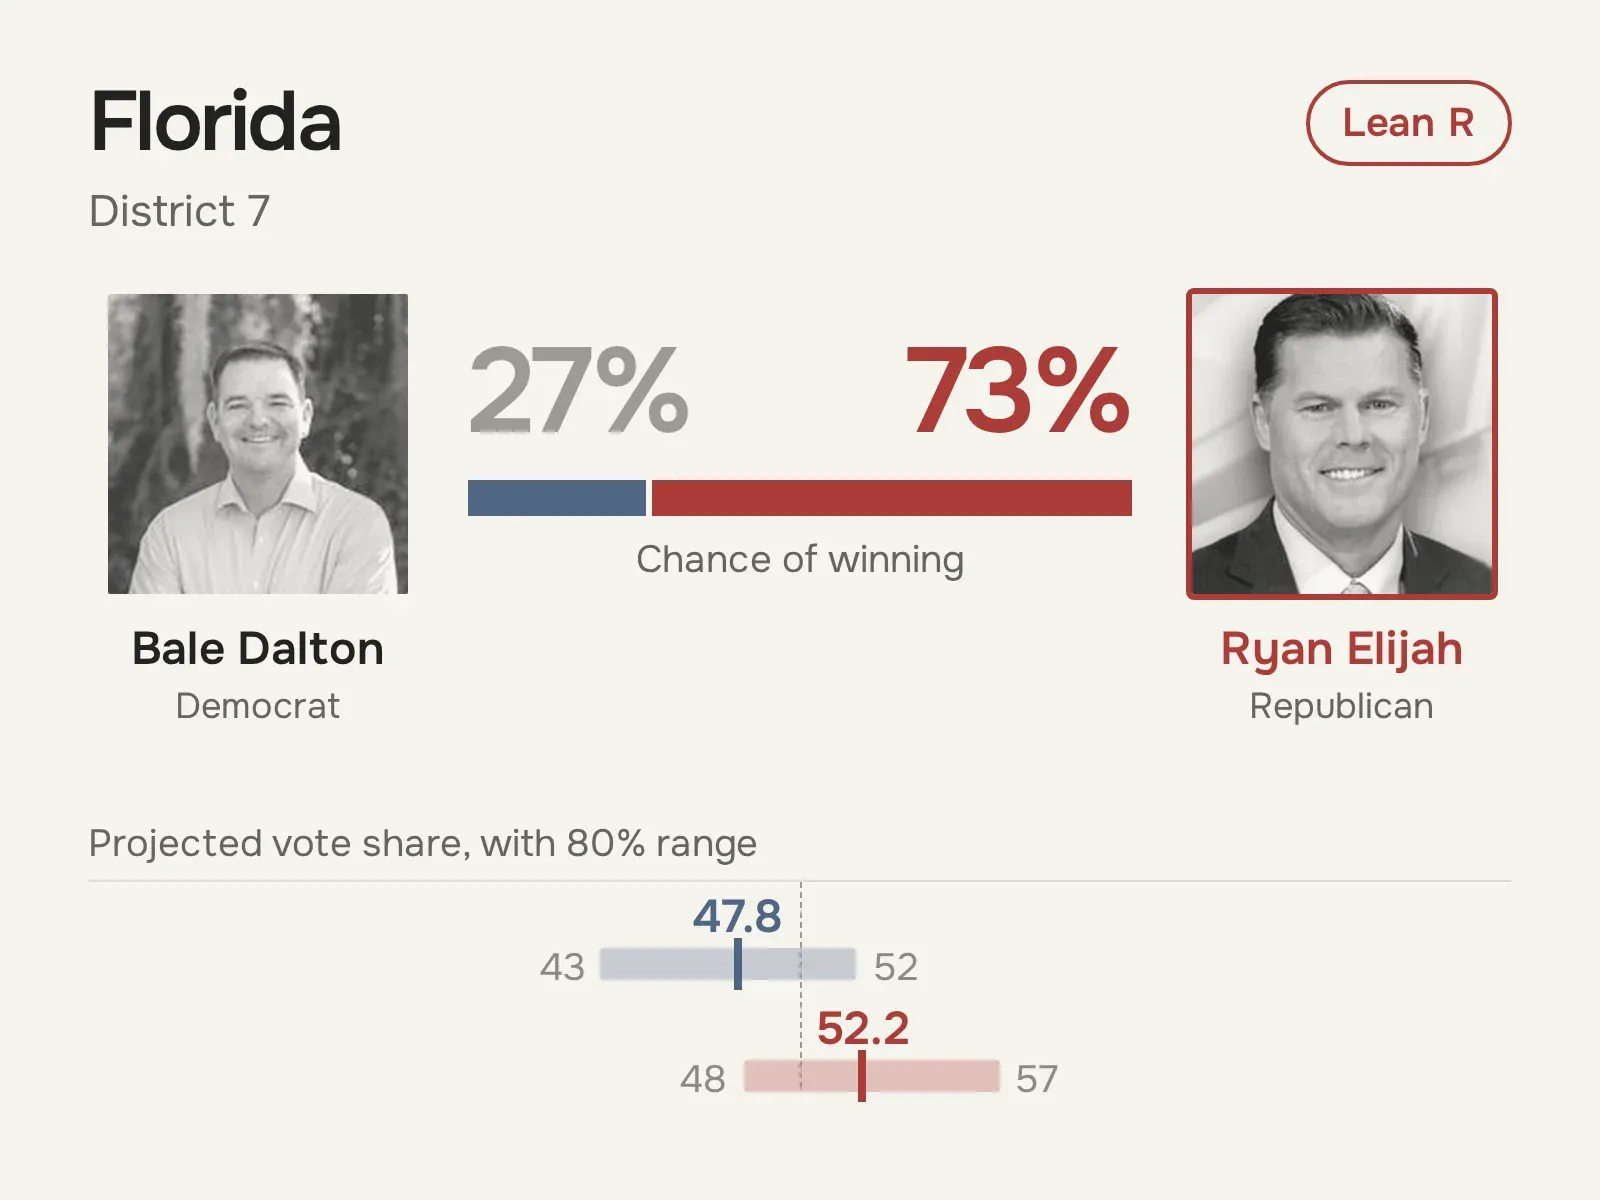
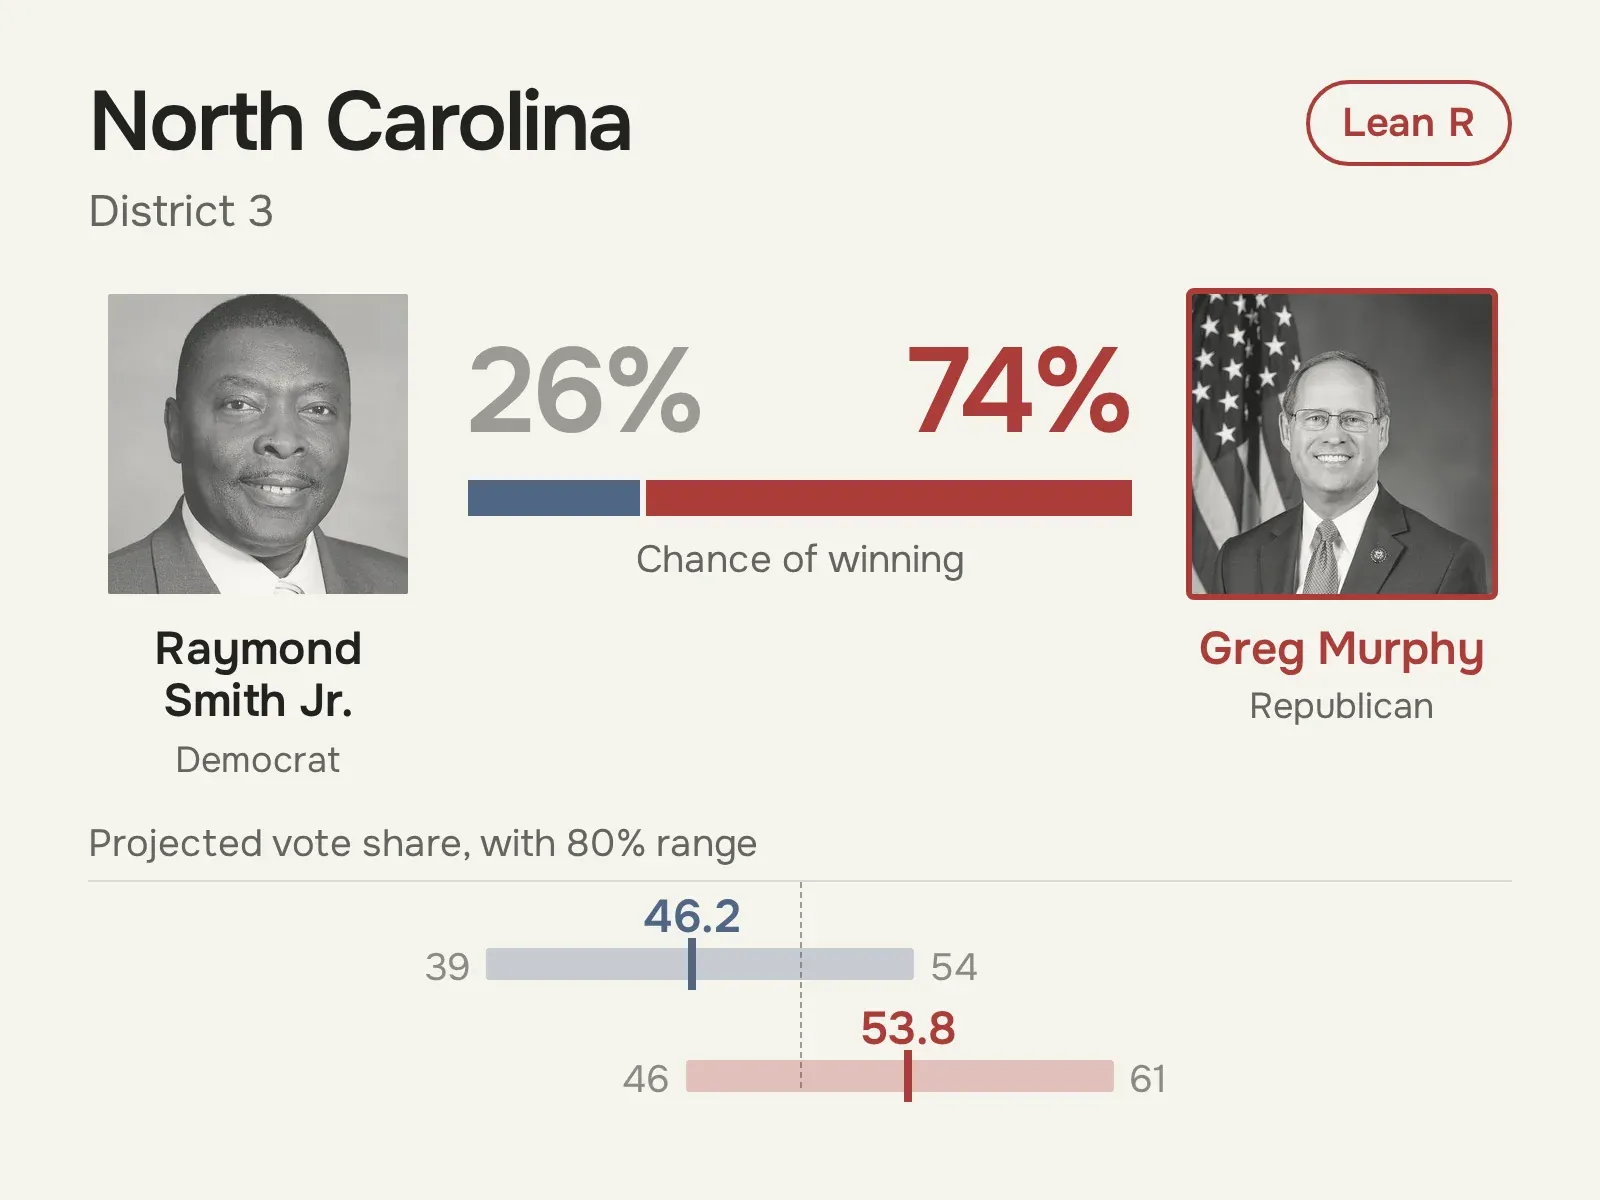
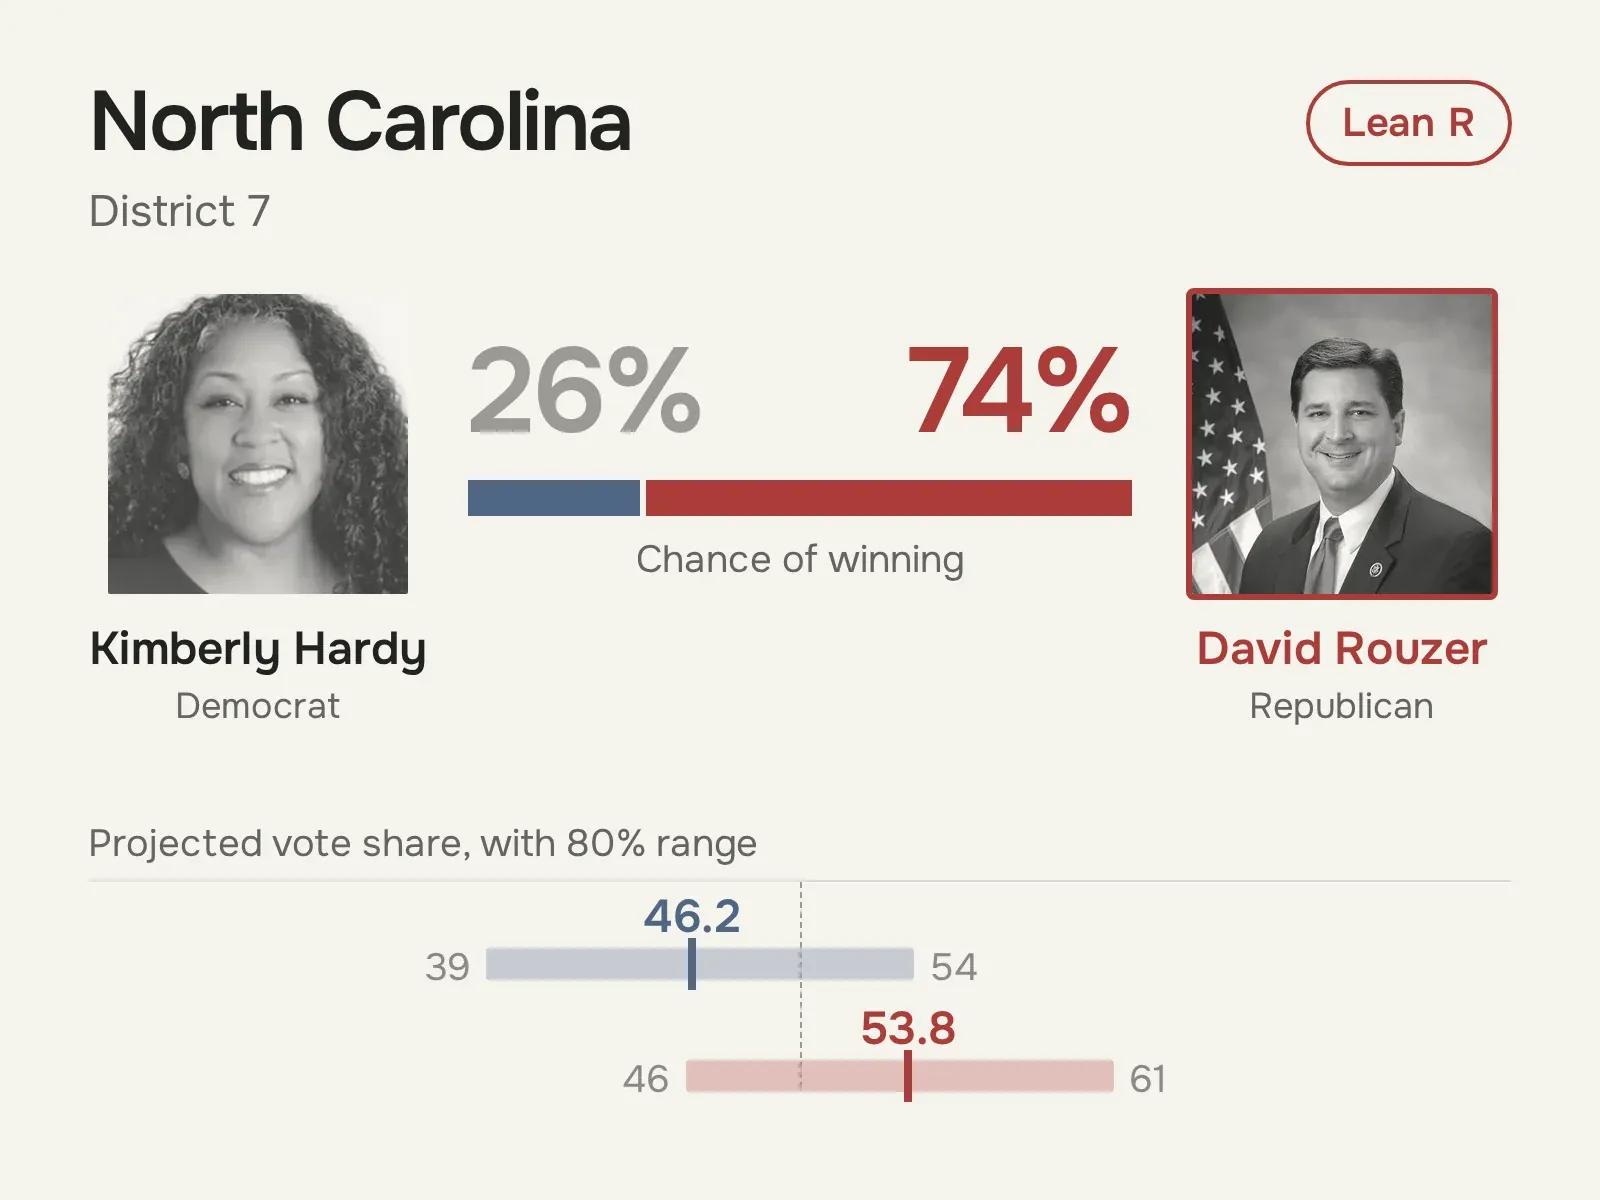
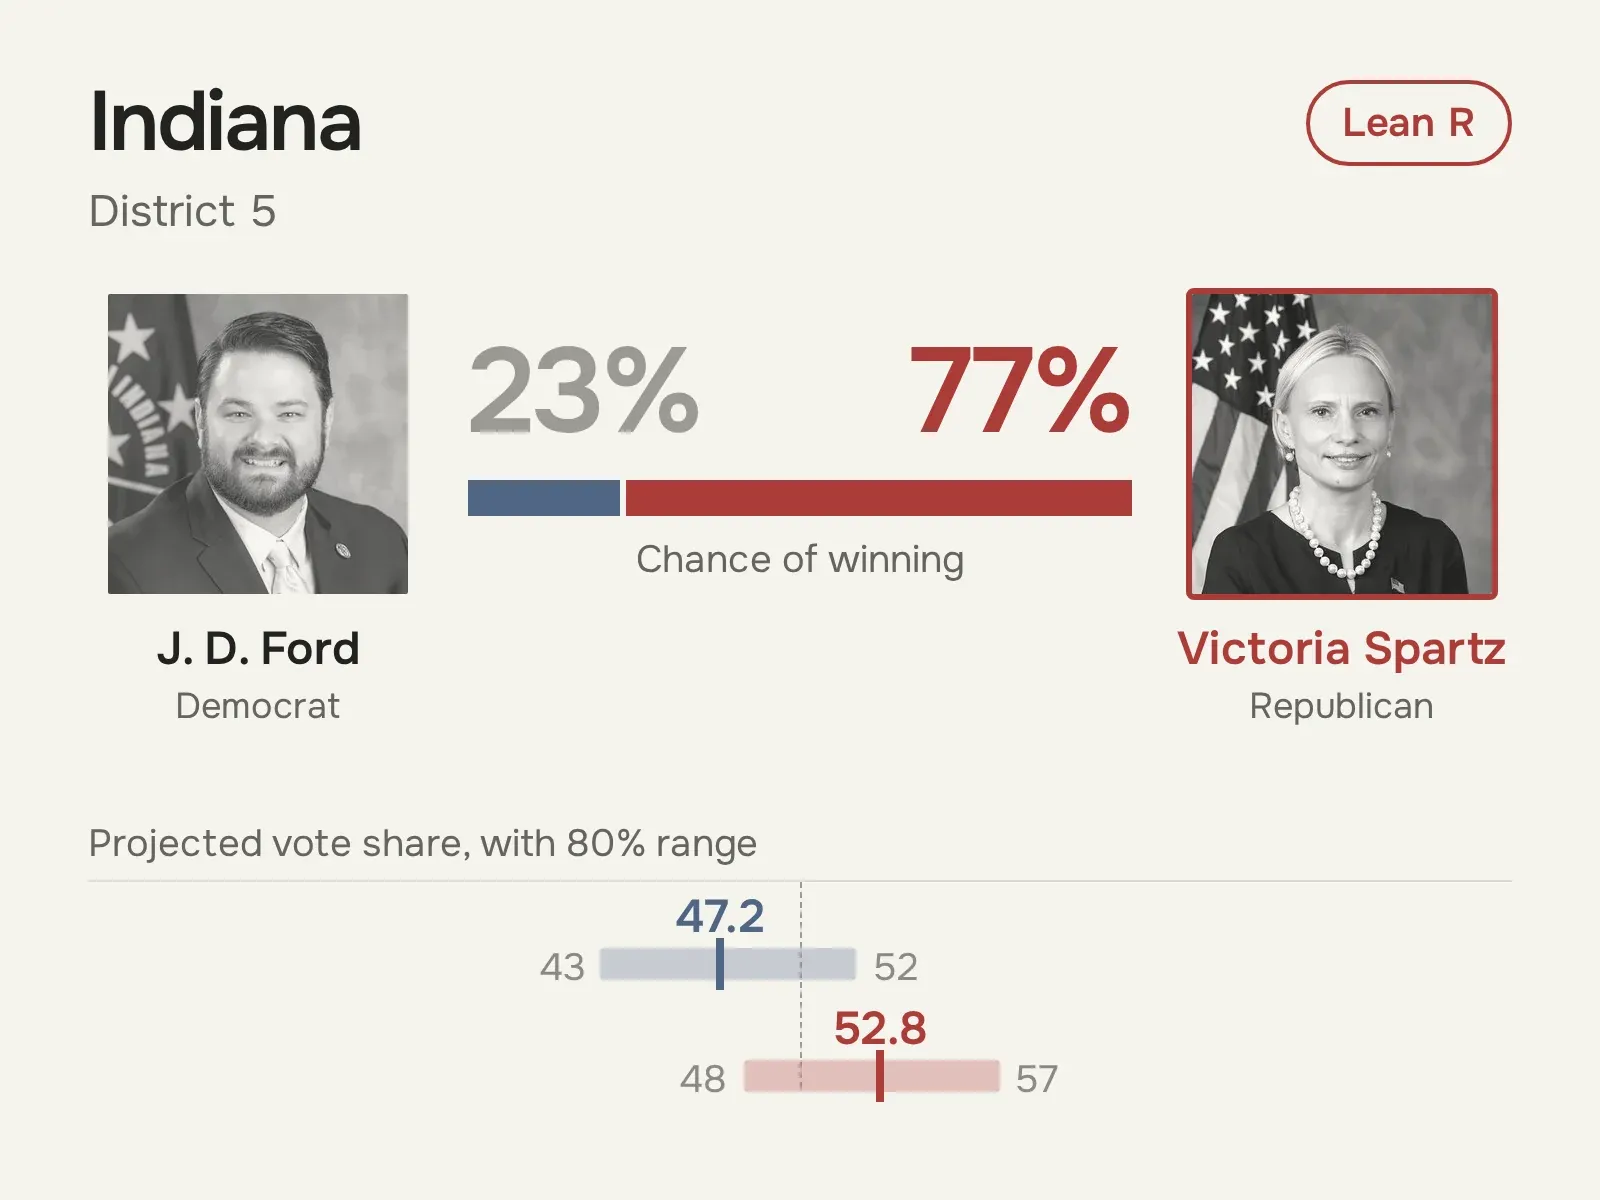
It covers all 35 Senate races, all 36 governor races and the 57 House seats where the trailing candidate has at least a 20% chance. The forecast is built from public polling and past results. Each card shows each candidate’s chance of winning, and their projected share of the two-candidate vote with an 80% range.
We’ll announce the forecast on our social channels, and once results are in we’ll share there how each call turned out.
Senate
Democrats win the Senate in 69% of outcomes, with a projected 52–48 split: they hold their 47 seats and flip five held by Republicans, in North Carolina, Maine, Texas, Kansas and Ohio. Within each group below, Democratic-favoured races come first.
Toss-up · 3 races (leader under 60%)
Lean · 4 races (leader 60–79%)
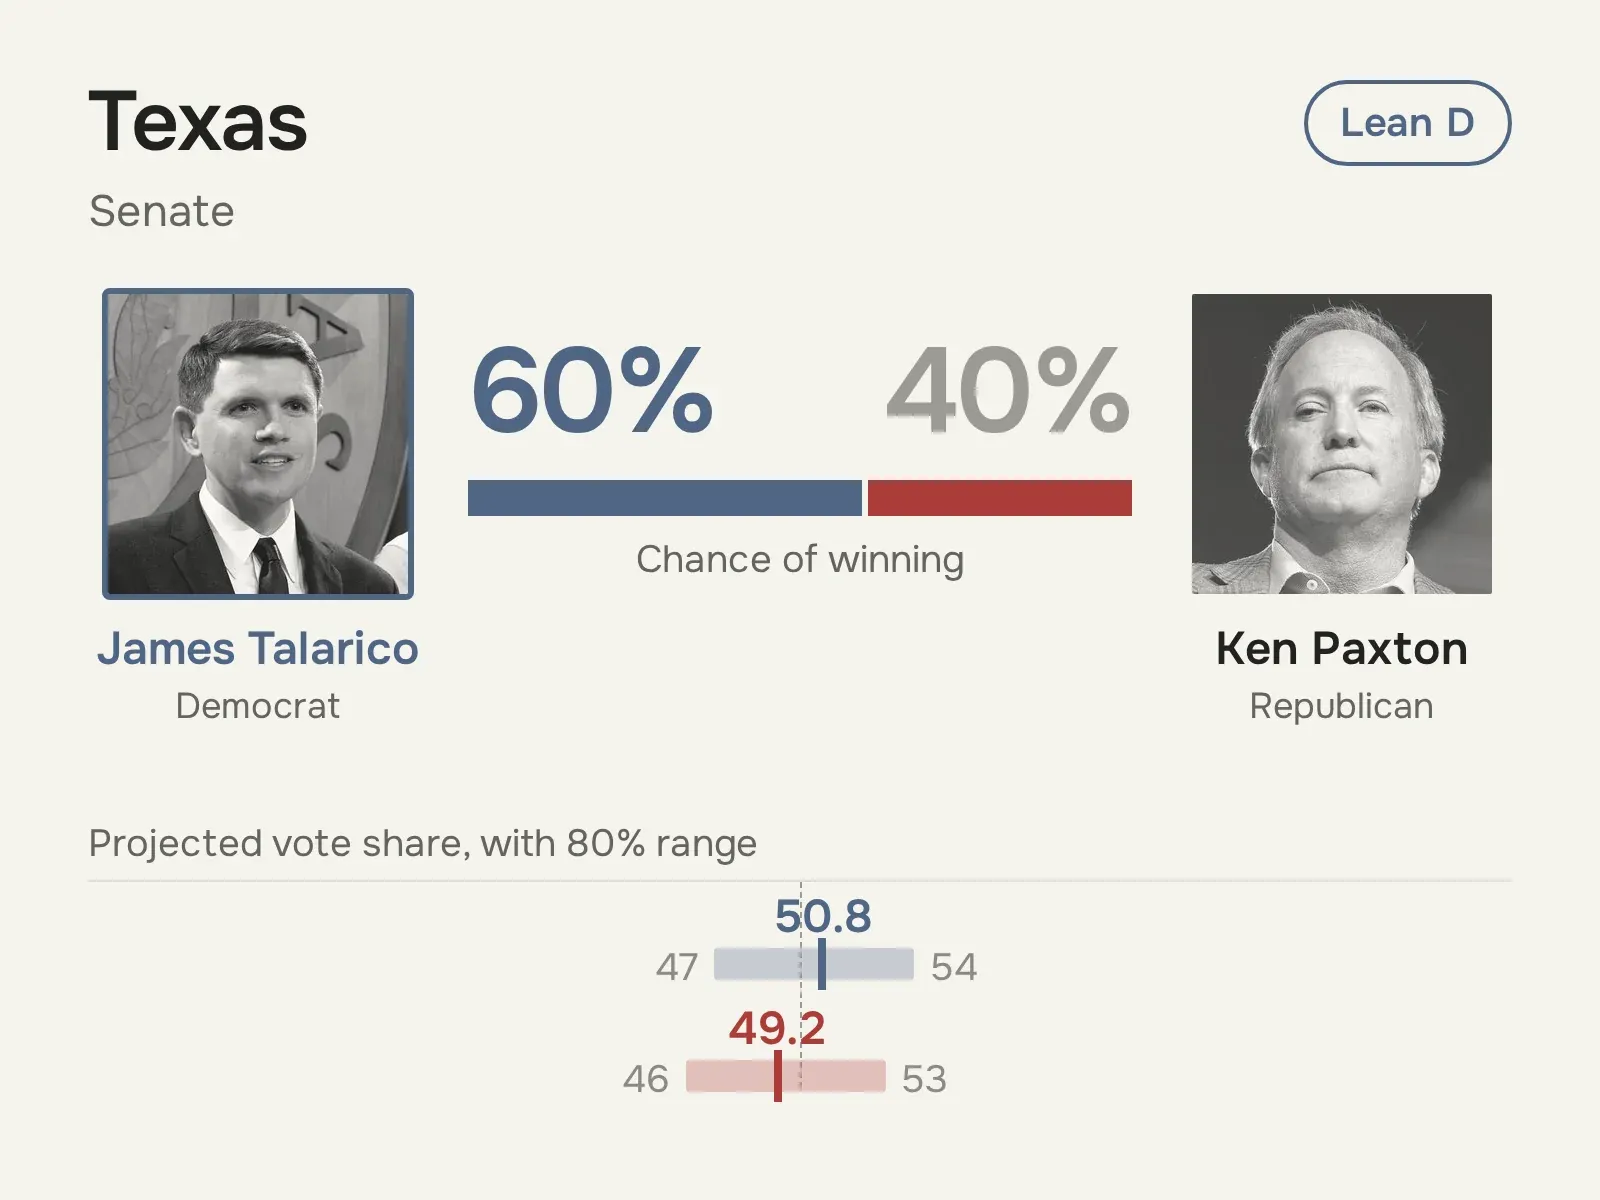
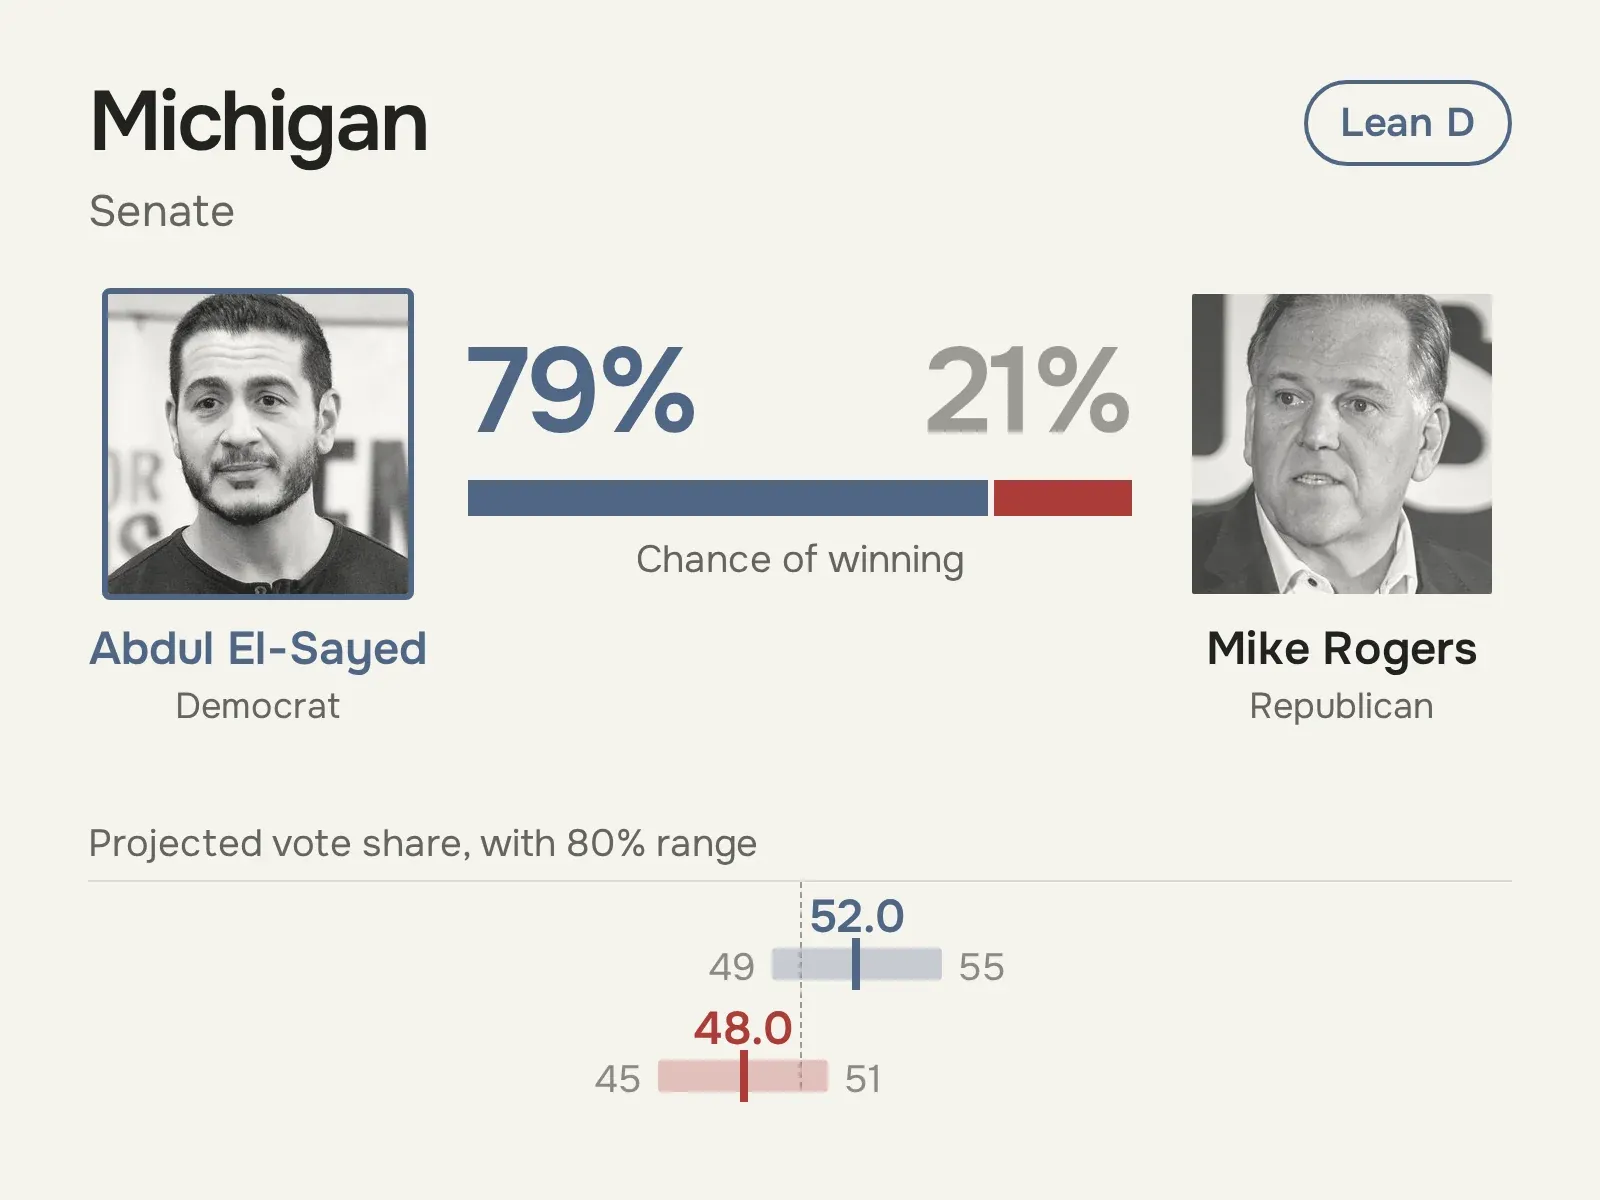
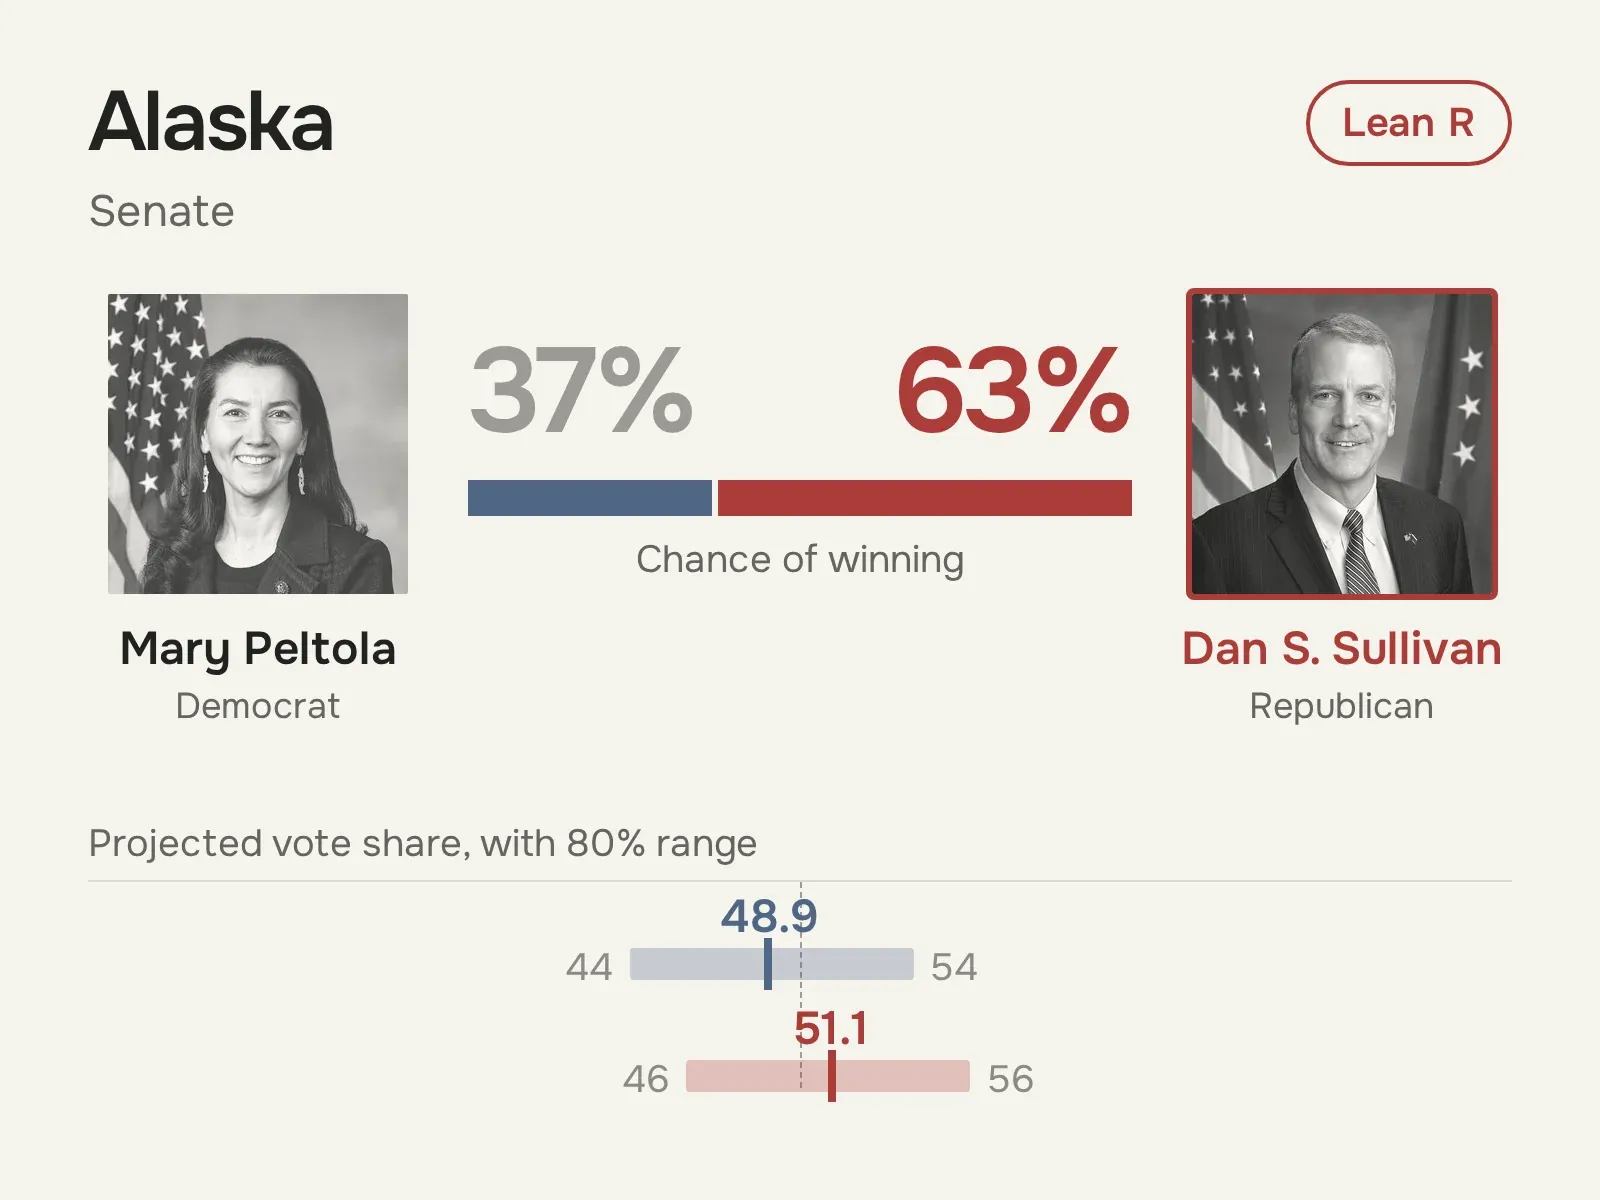
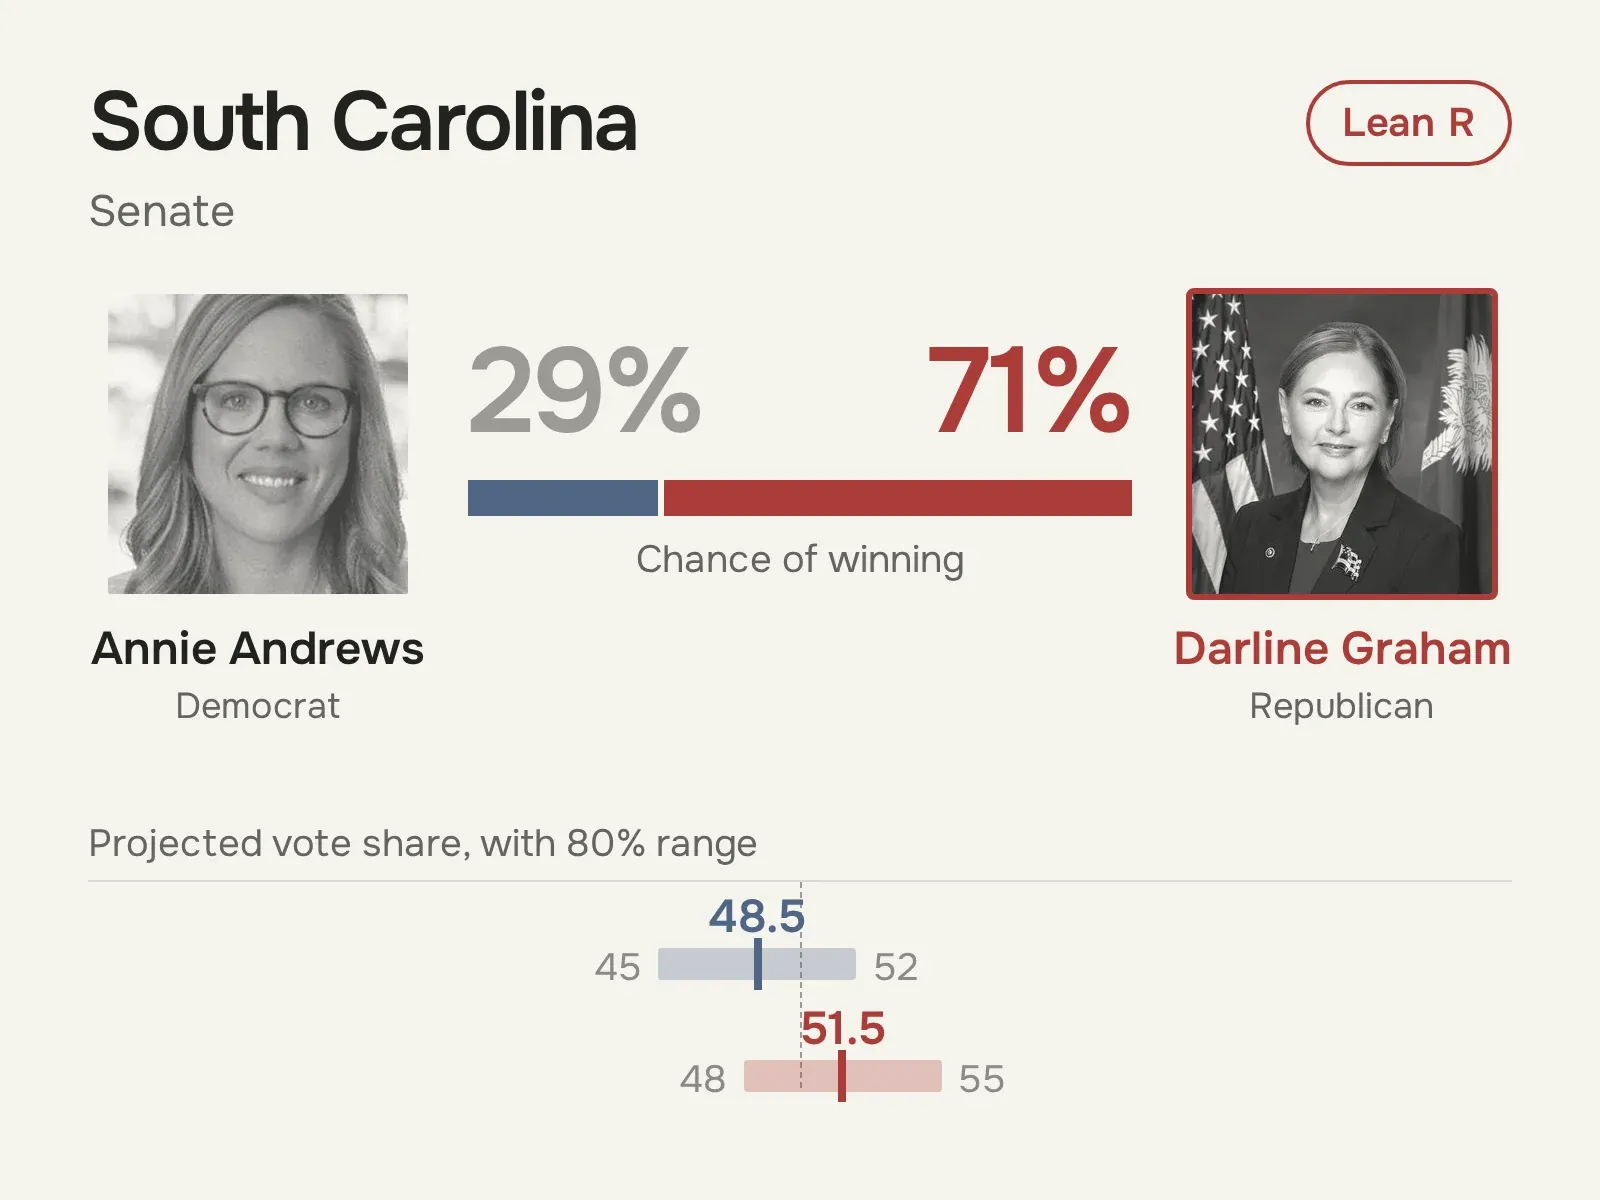
Likely · 4 races (leader 80–94%)
Safe · 24 races (leader 95% or higher)
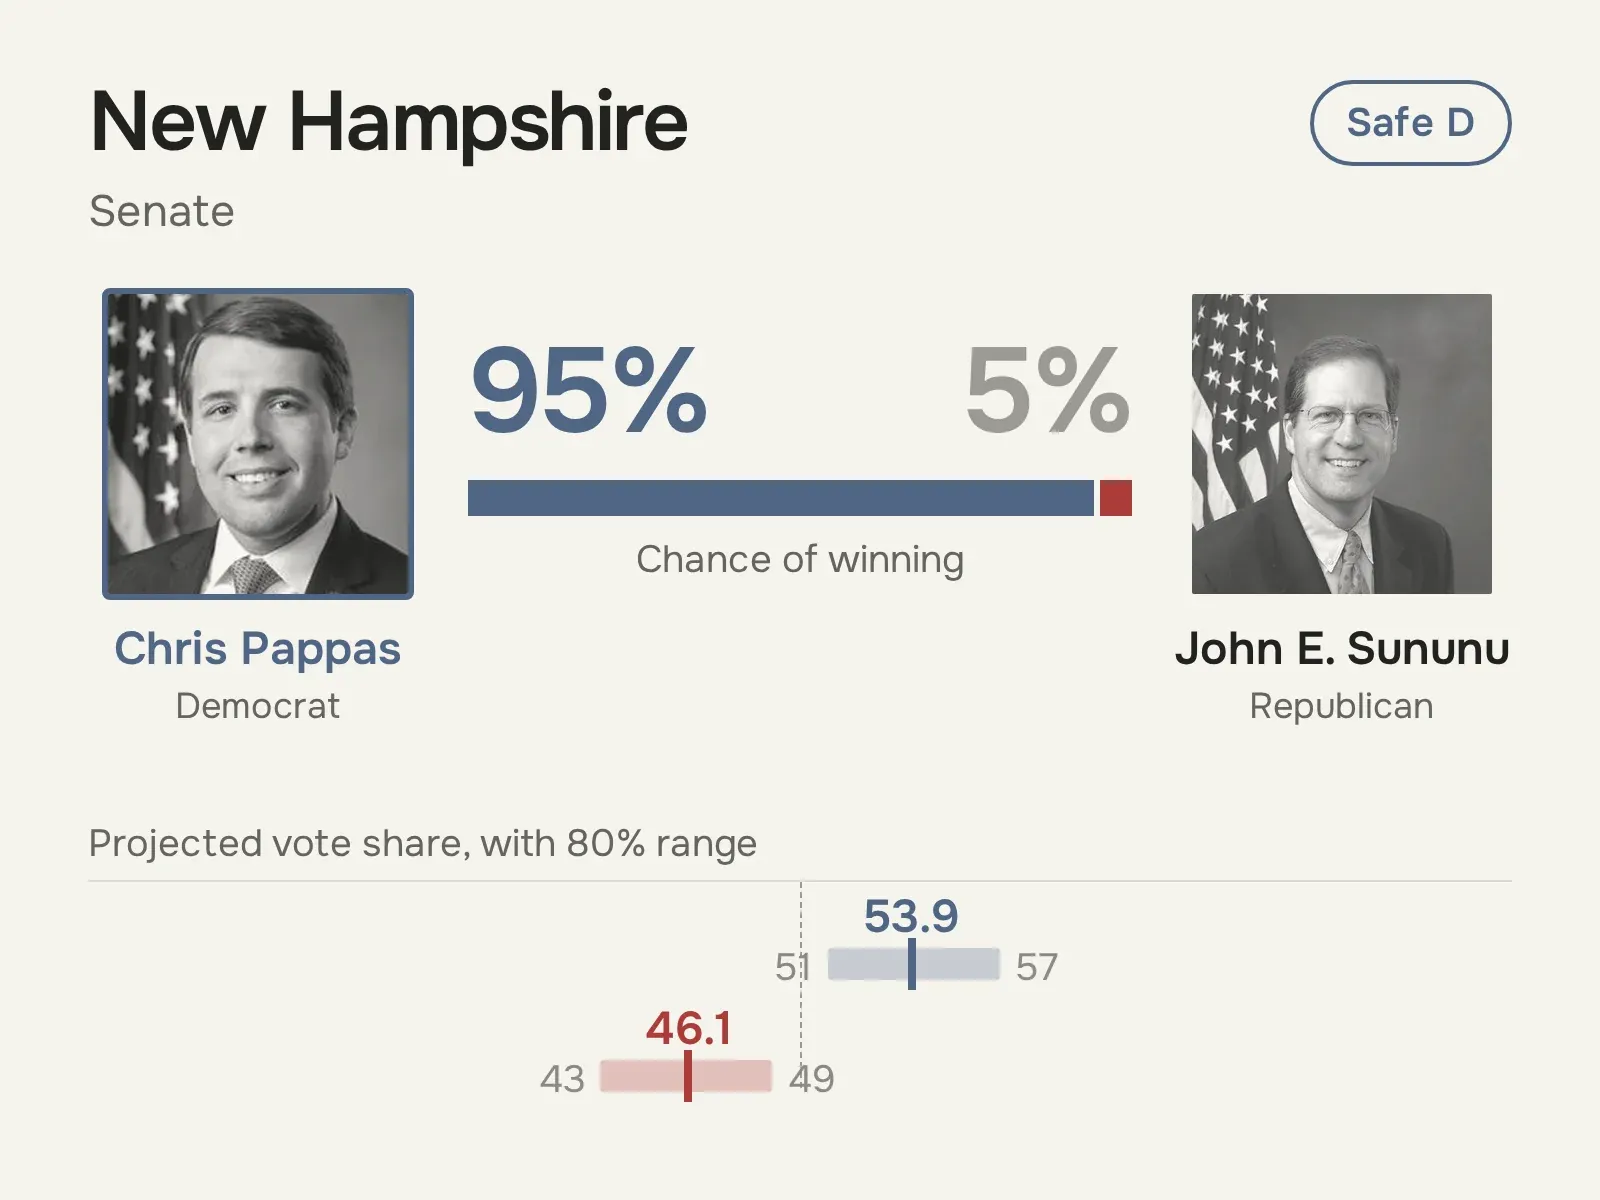 View full size ↗
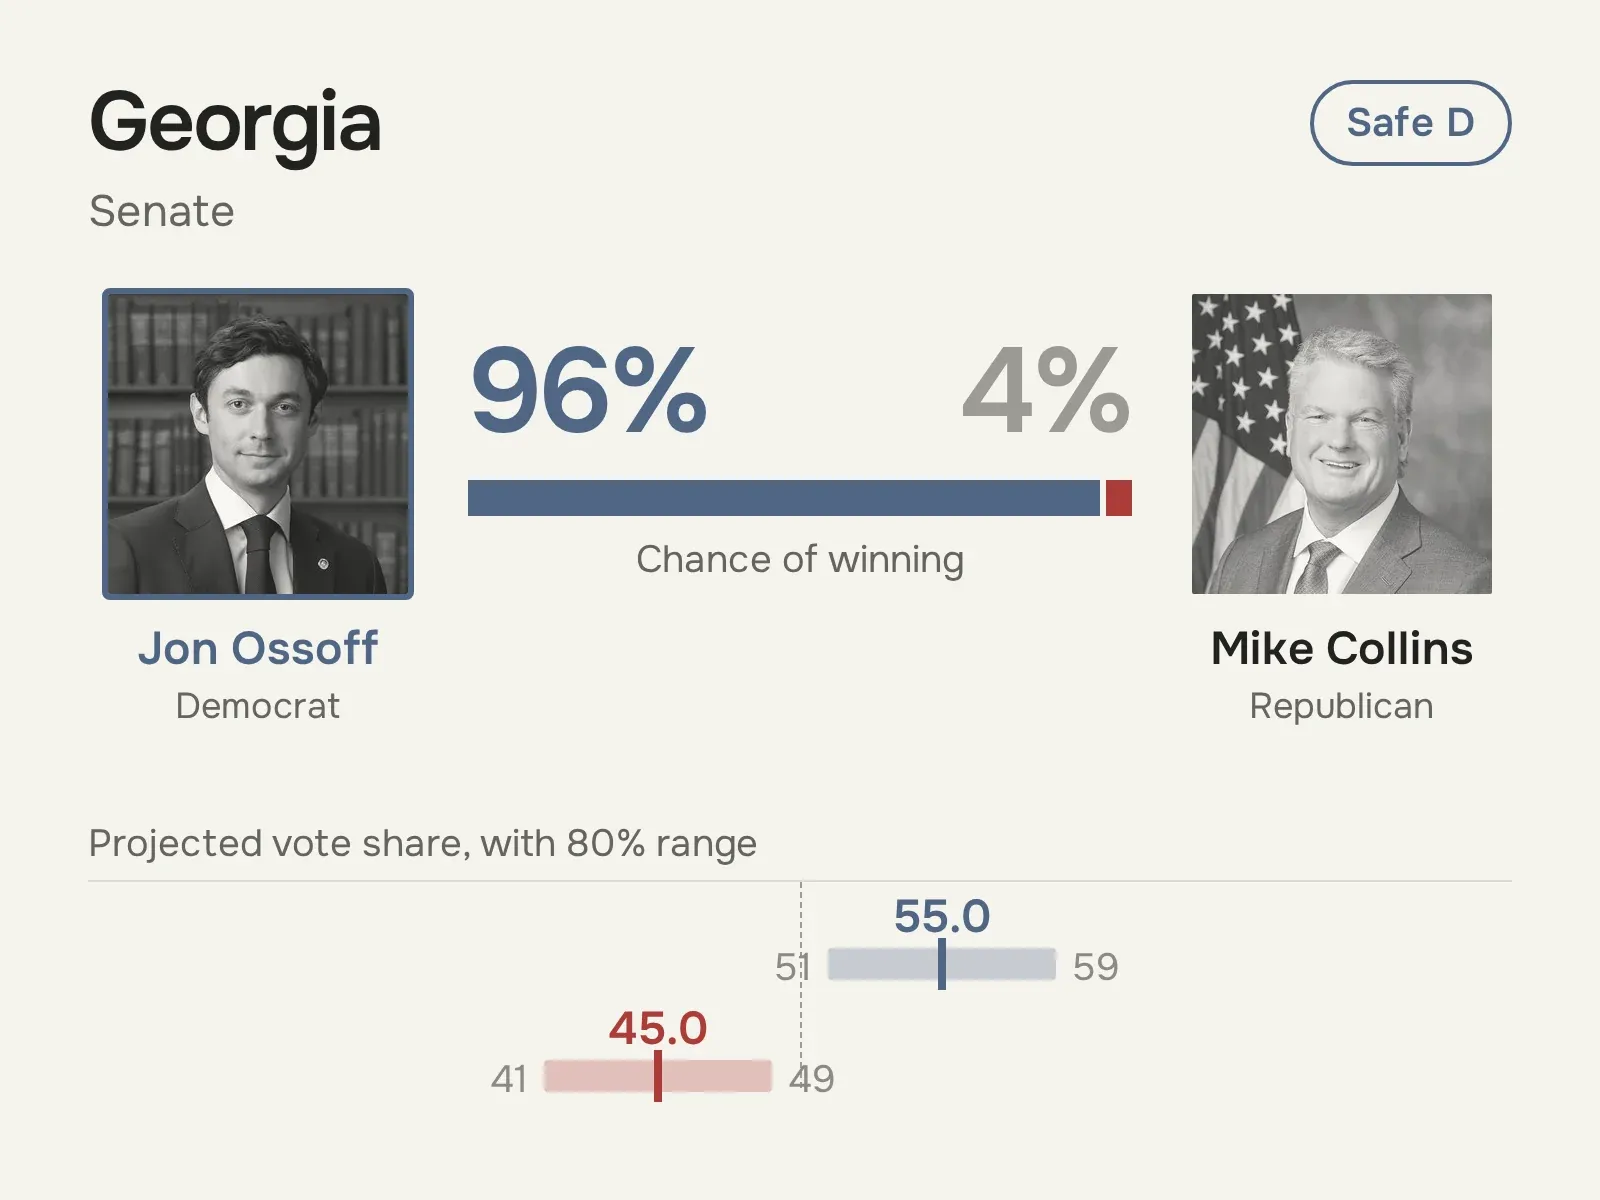 View full size ↗
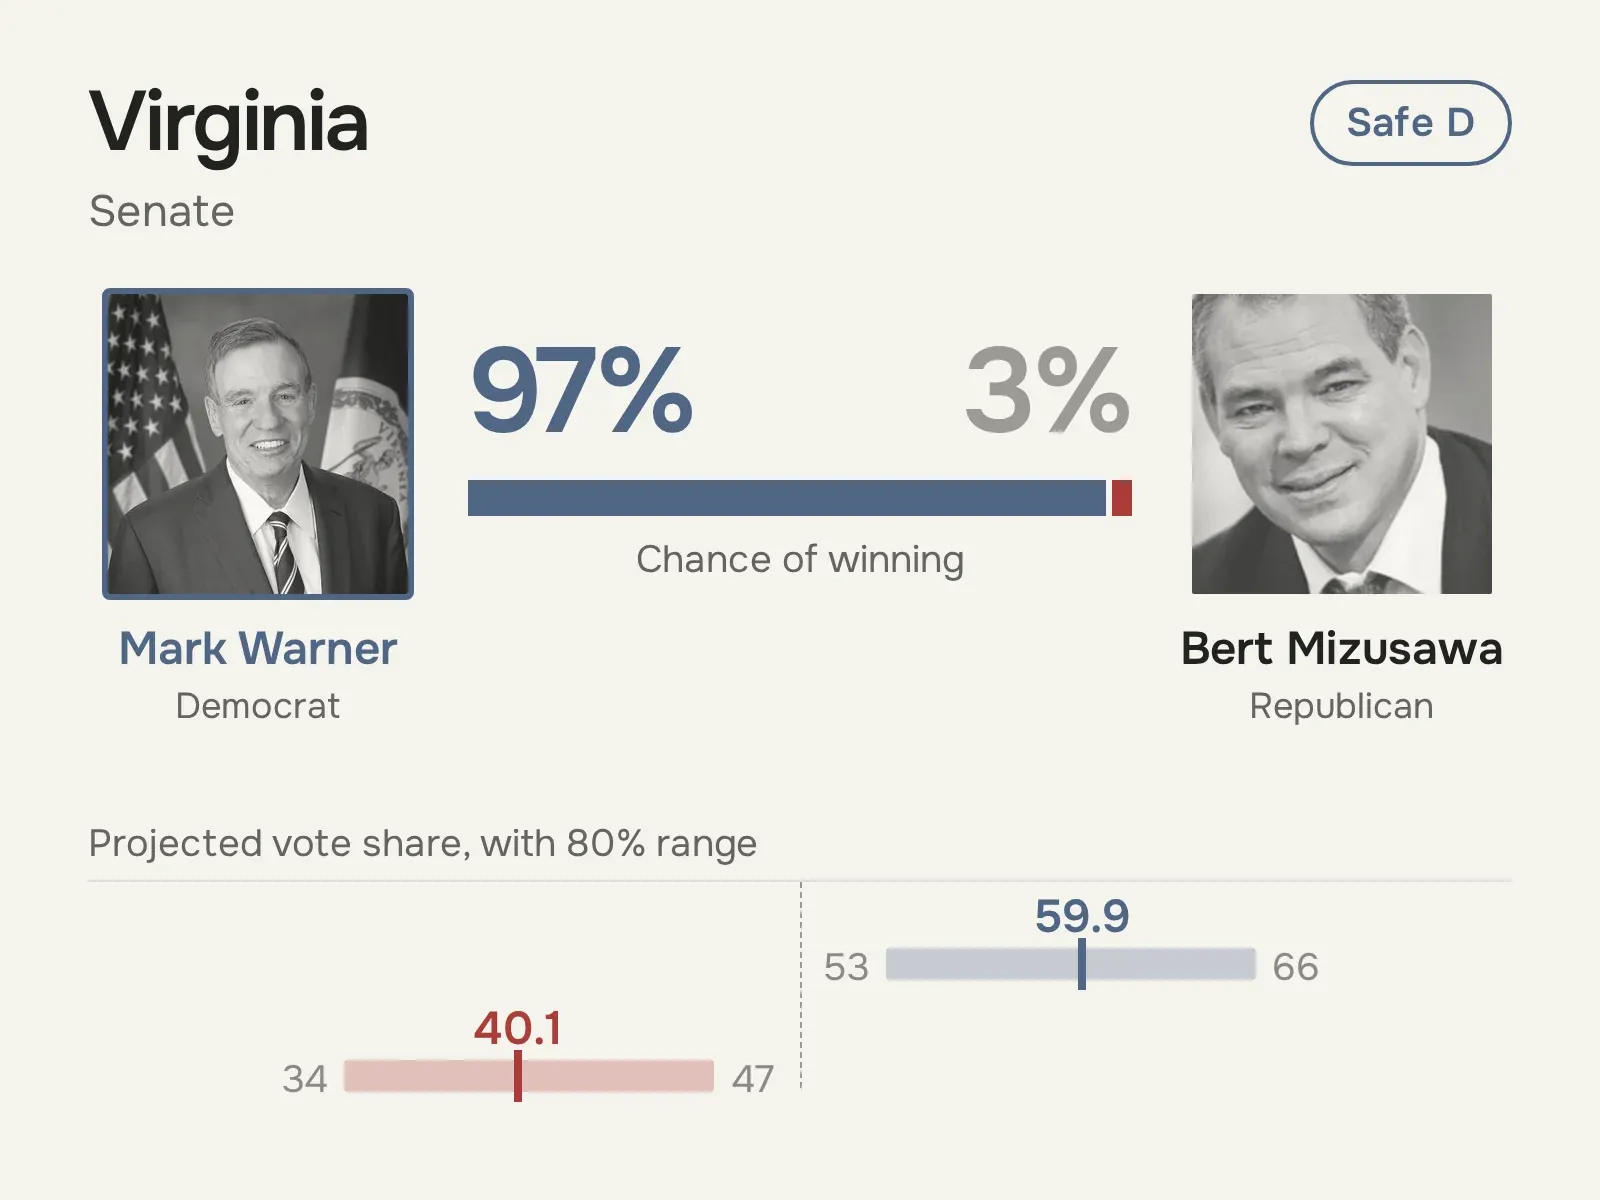 View full size ↗
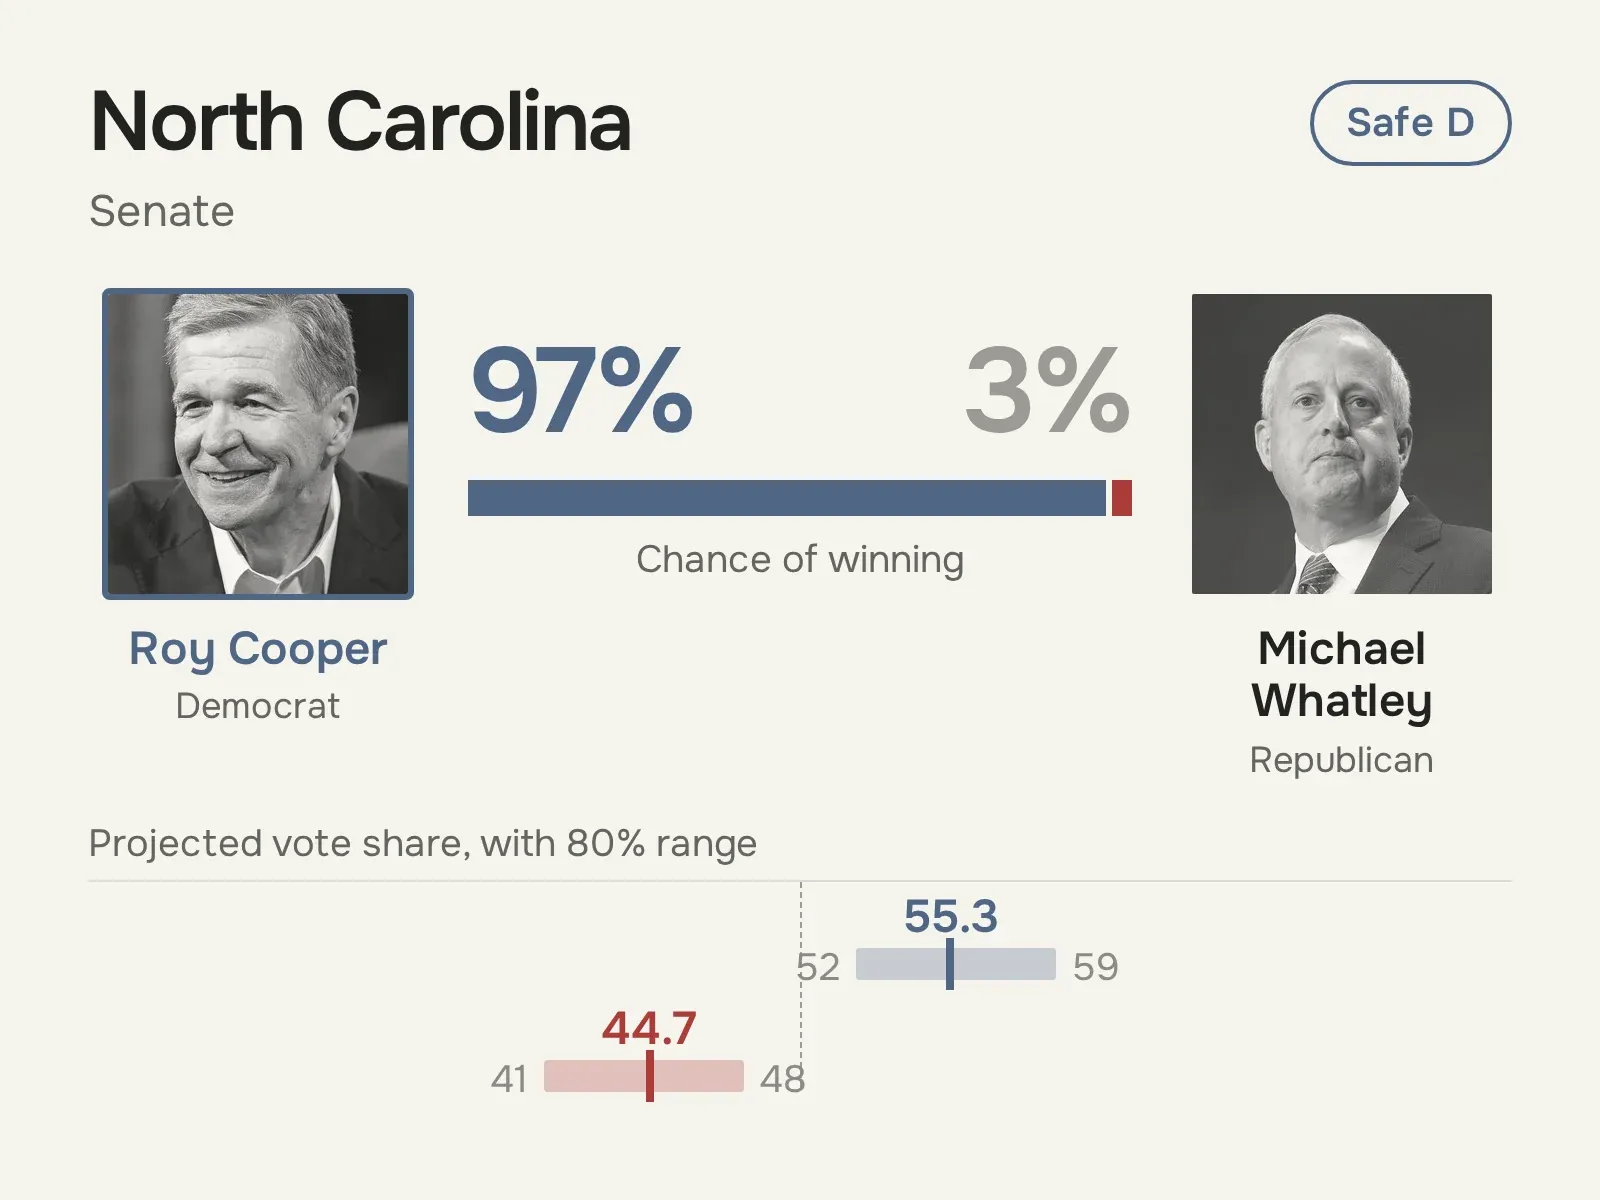 View full size ↗
 View full size ↗
 View full size ↗
 View full size ↗
 View full size ↗
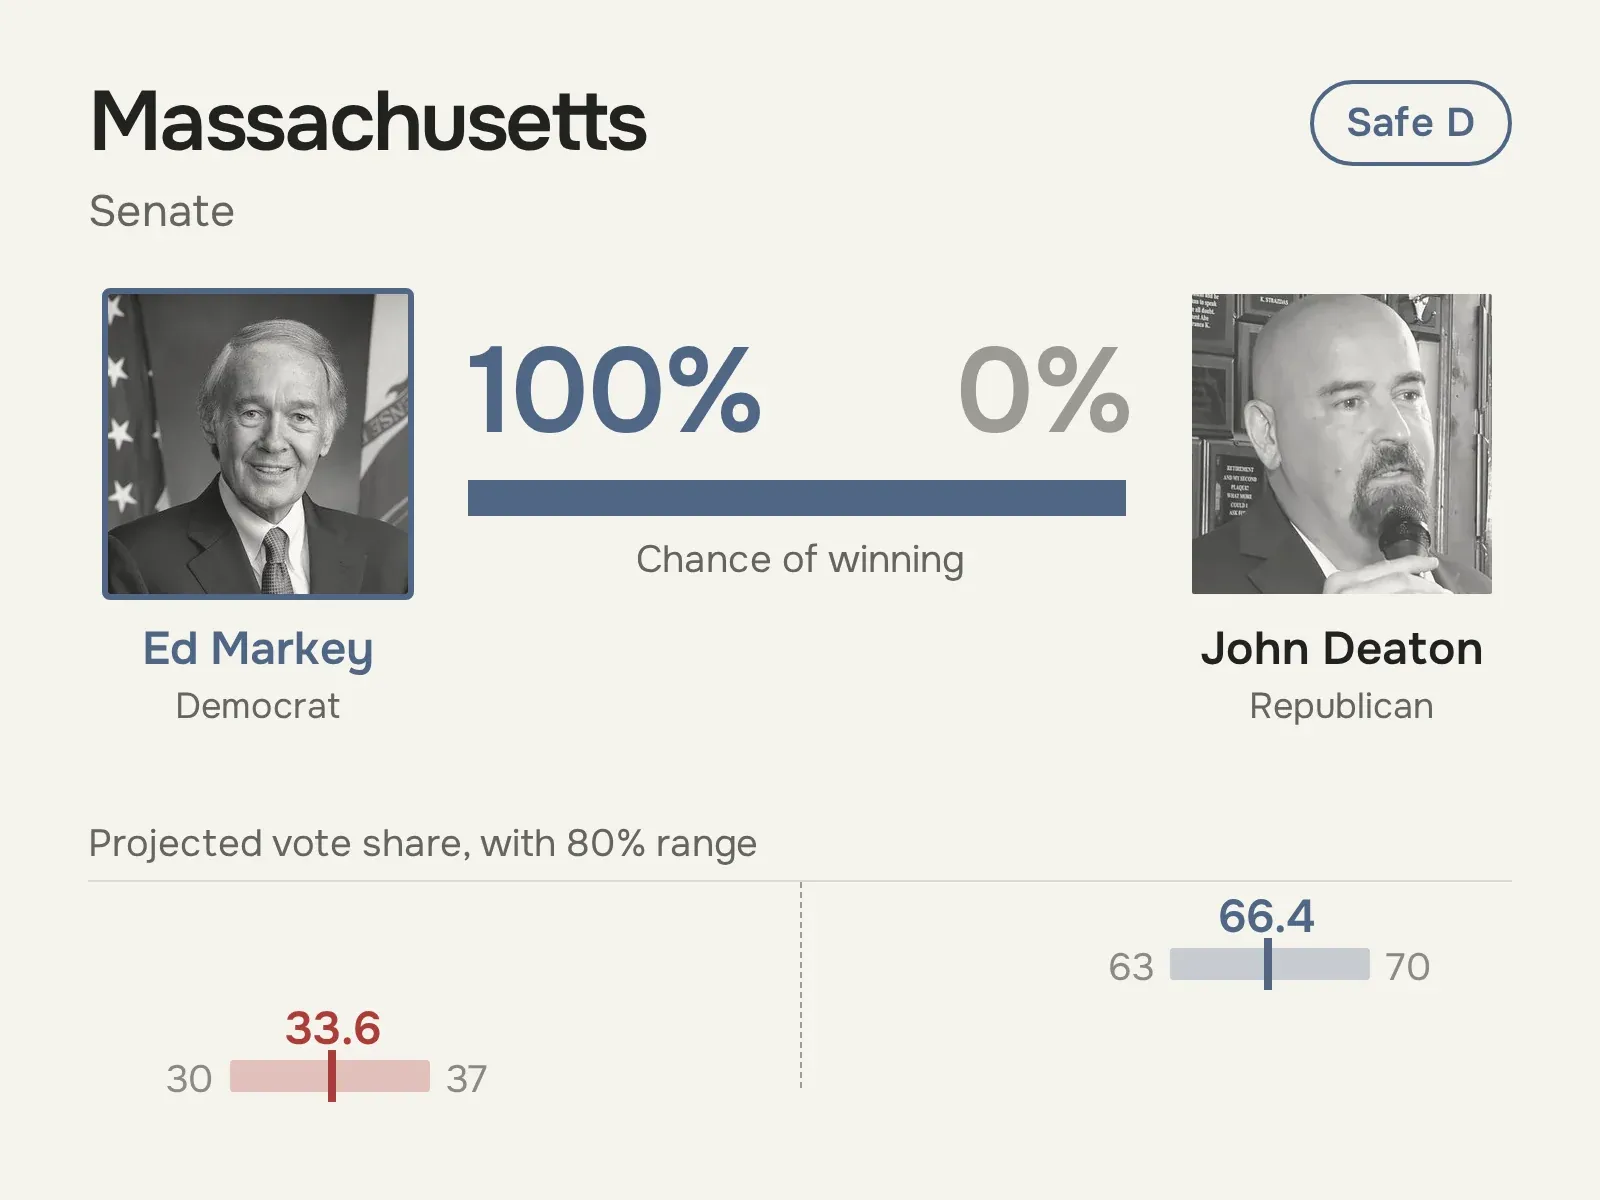 View full size ↗
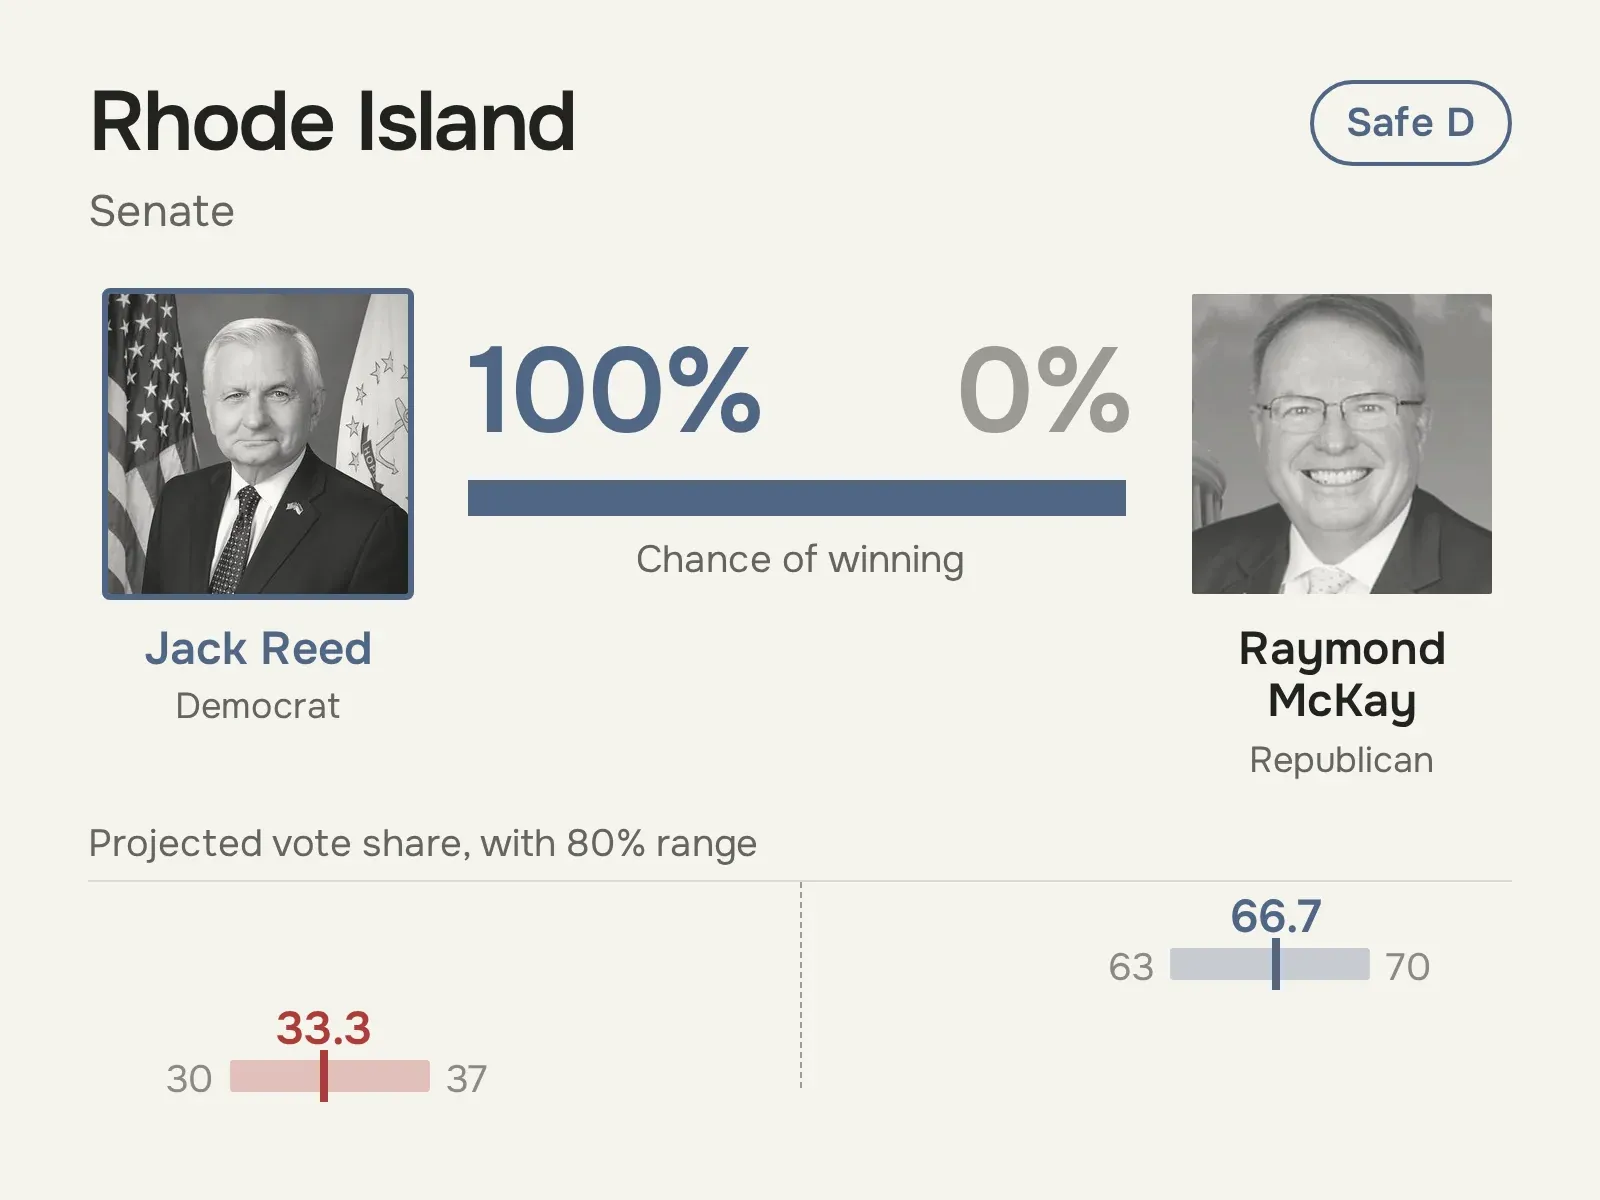 View full size ↗
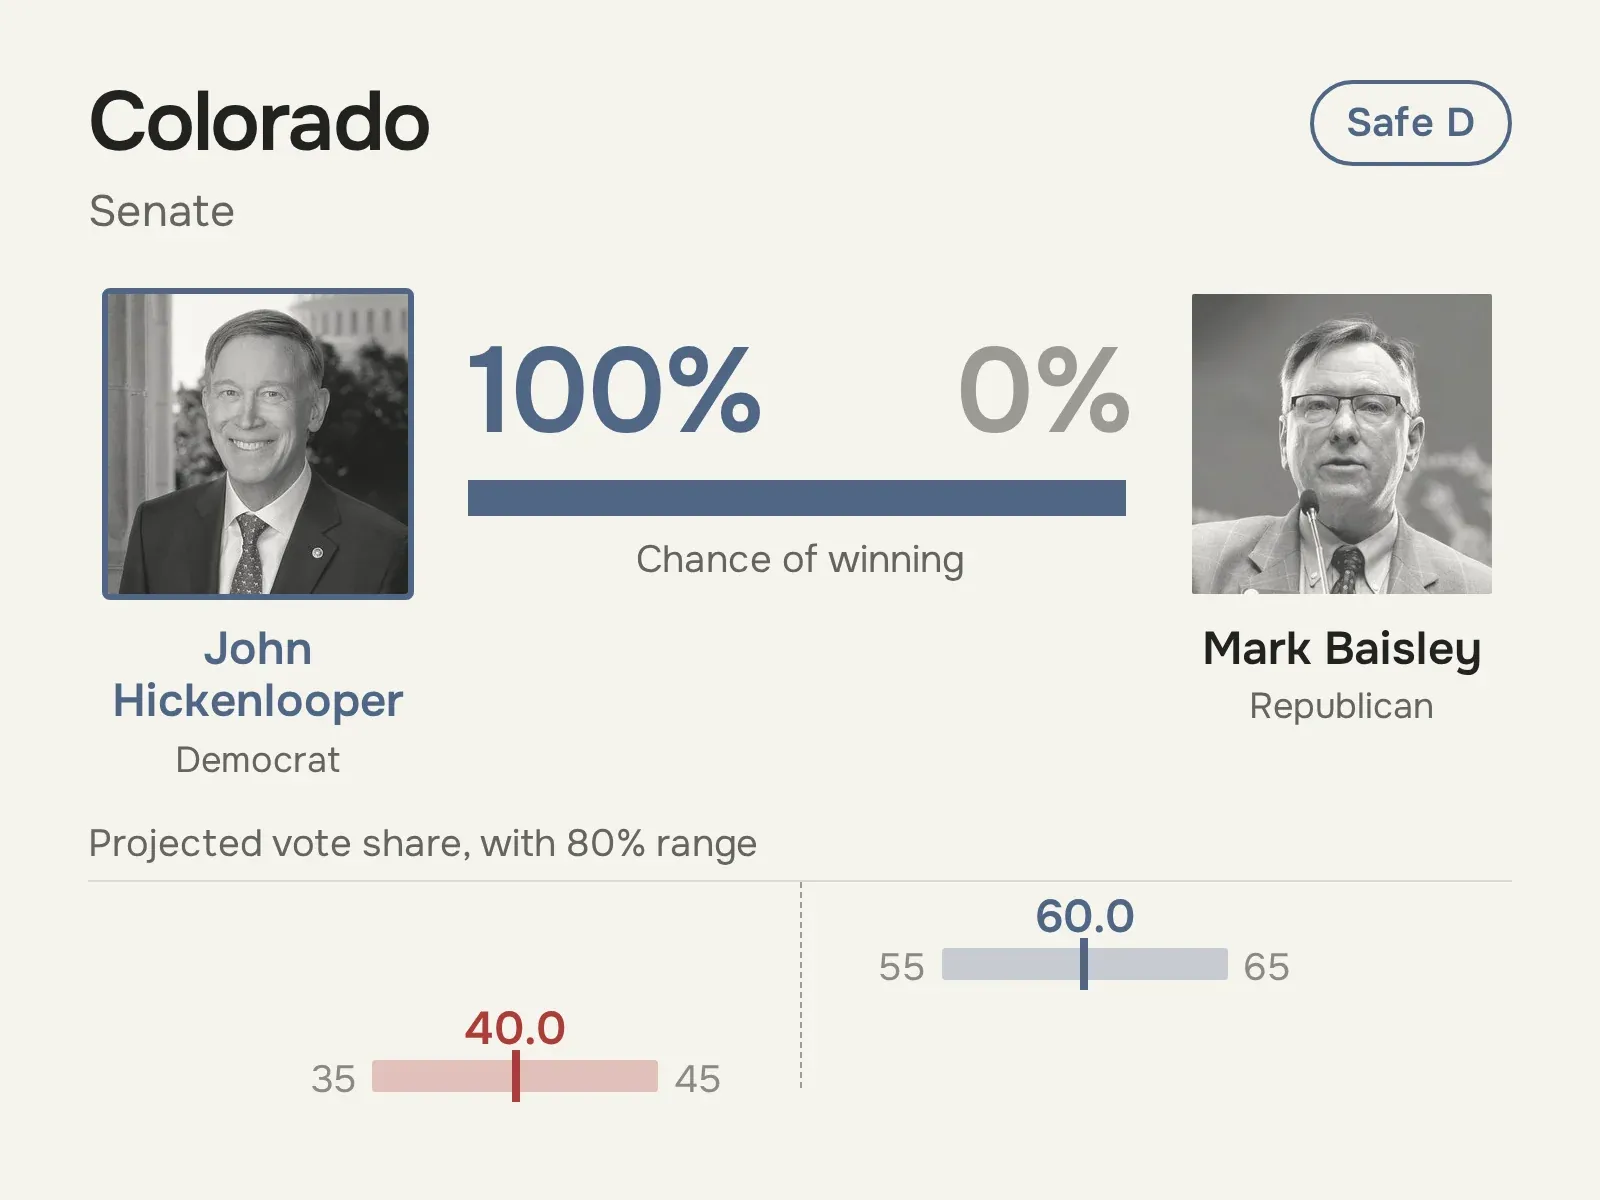 View full size ↗
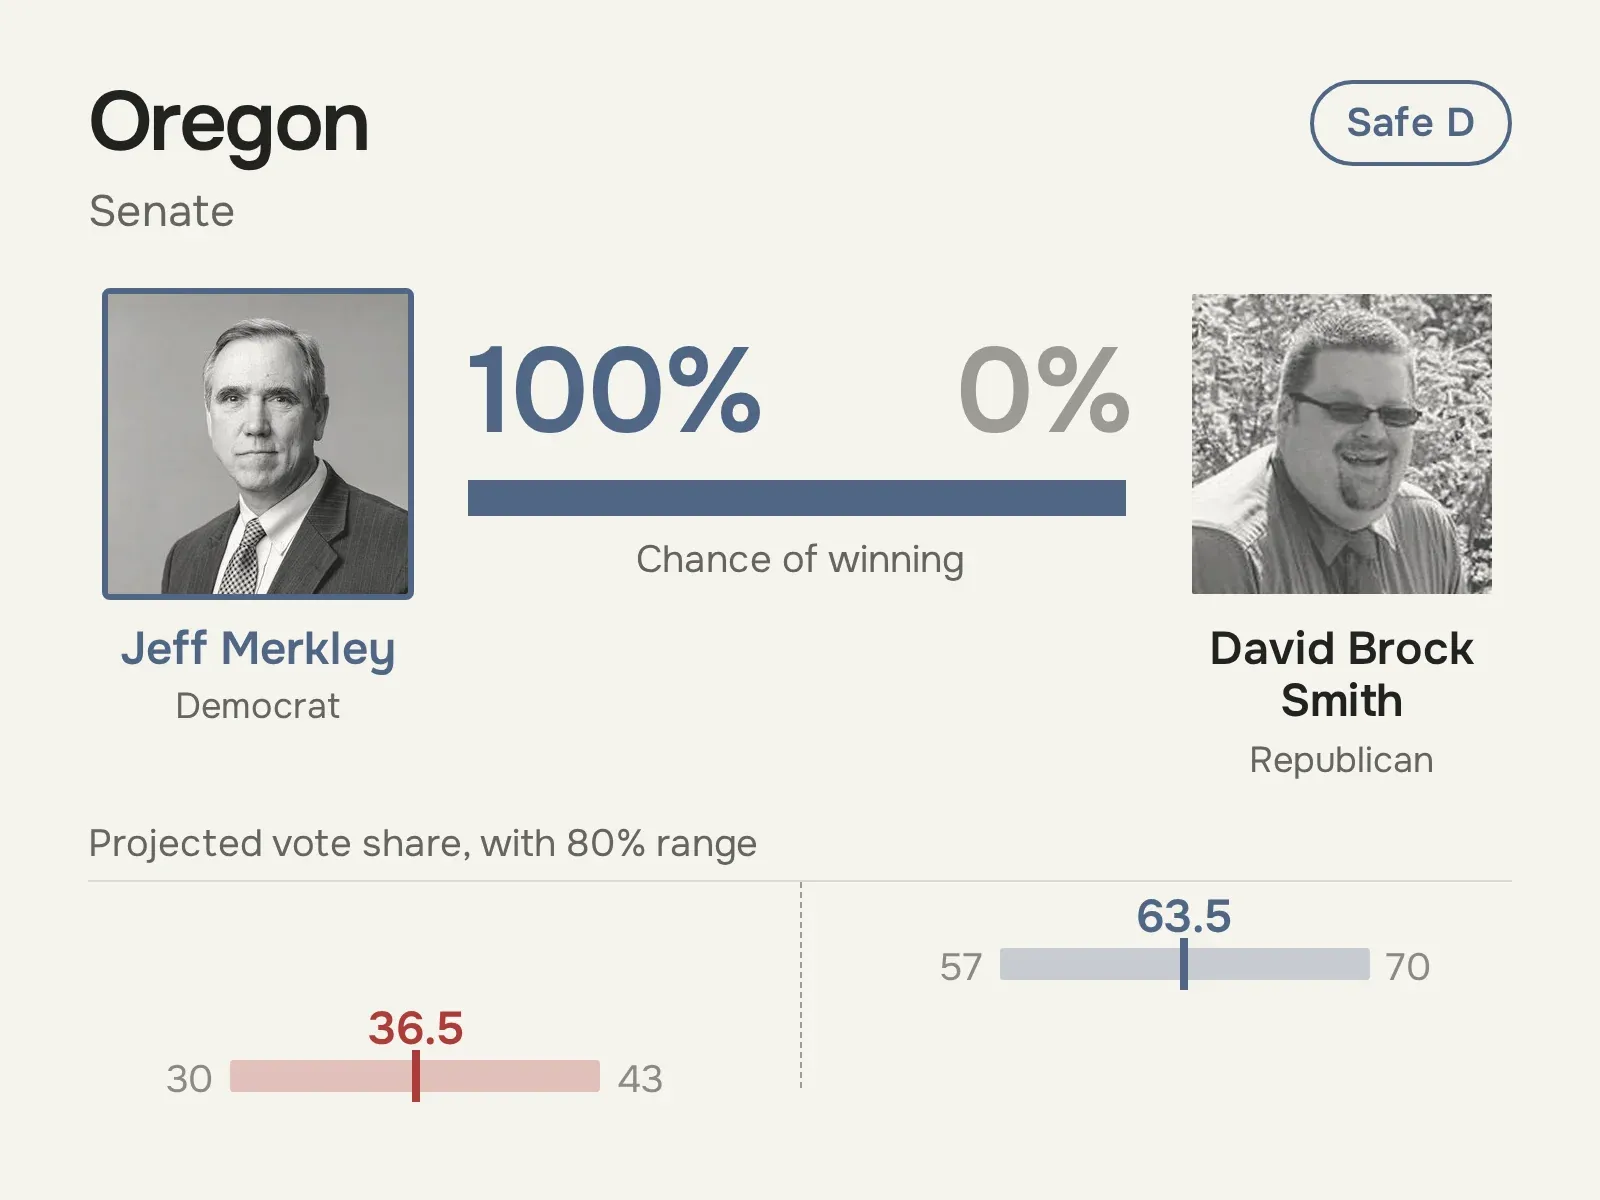 View full size ↗
 View full size ↗
 View full size ↗
 View full size ↗
 View full size ↗
 View full size ↗
 View full size ↗
 View full size ↗
 View full size ↗
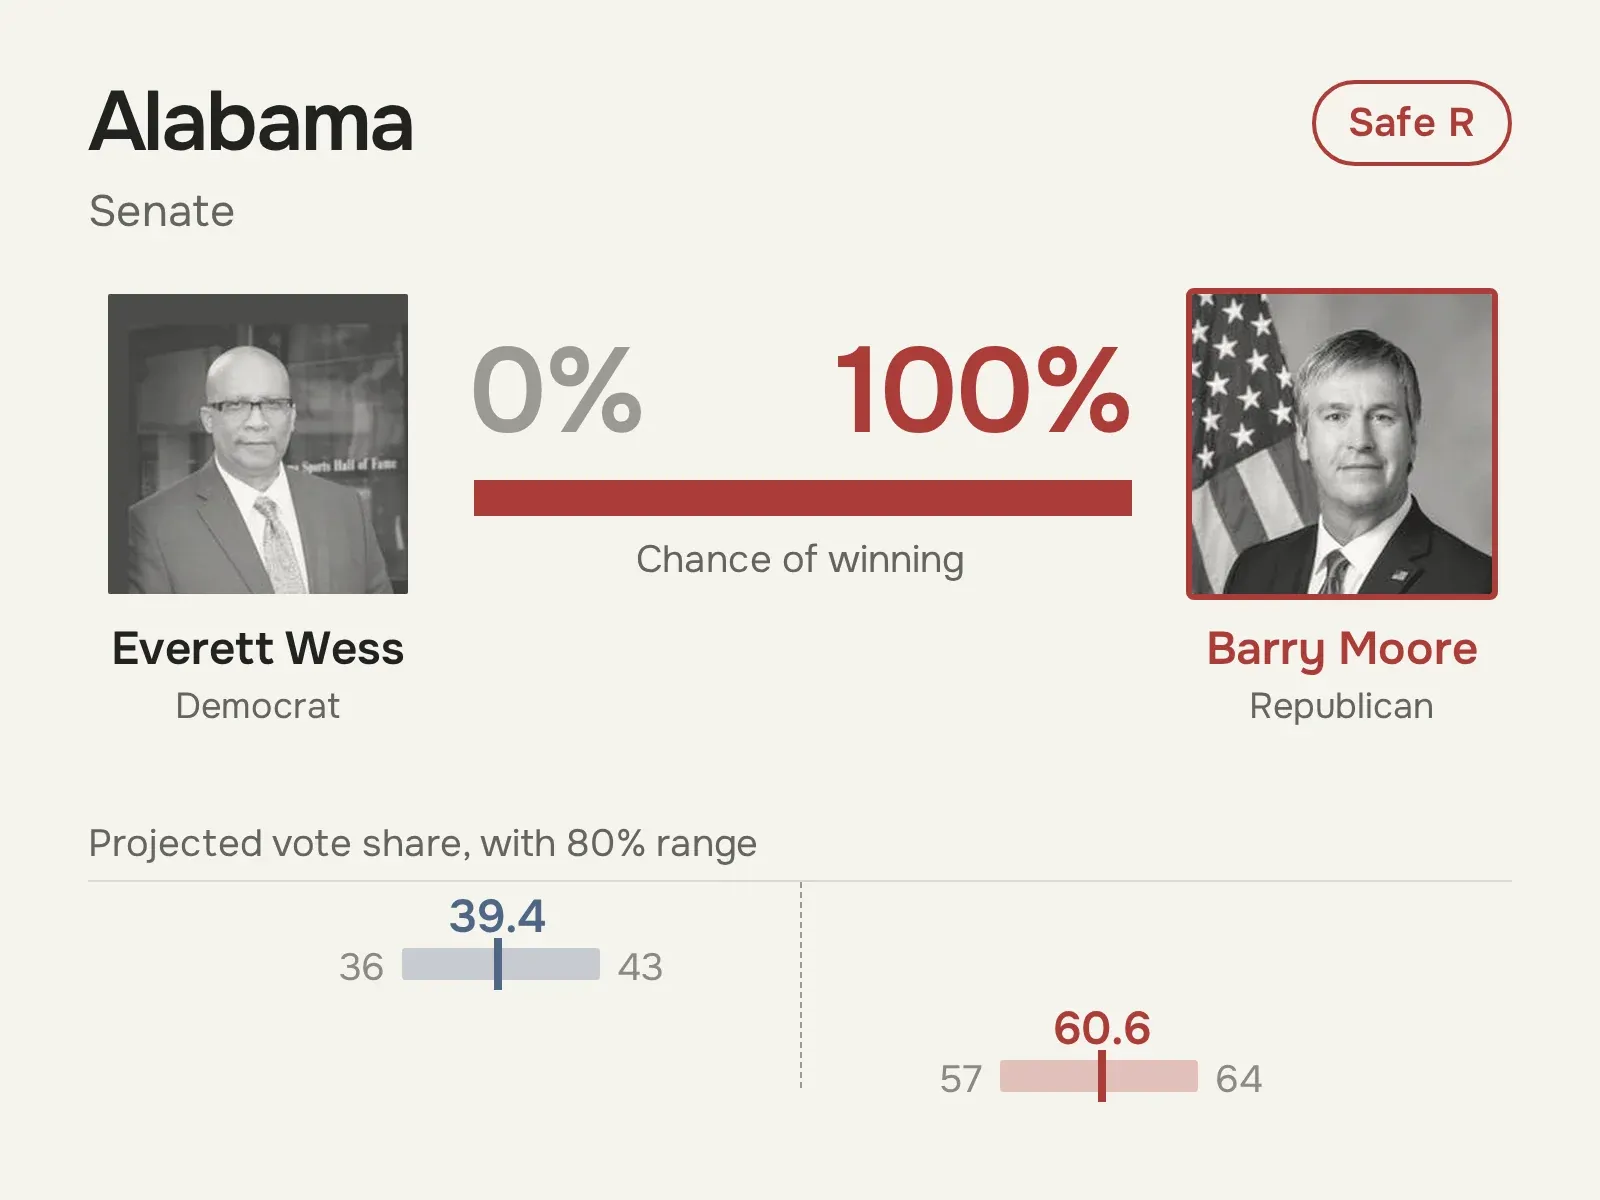 View full size ↗
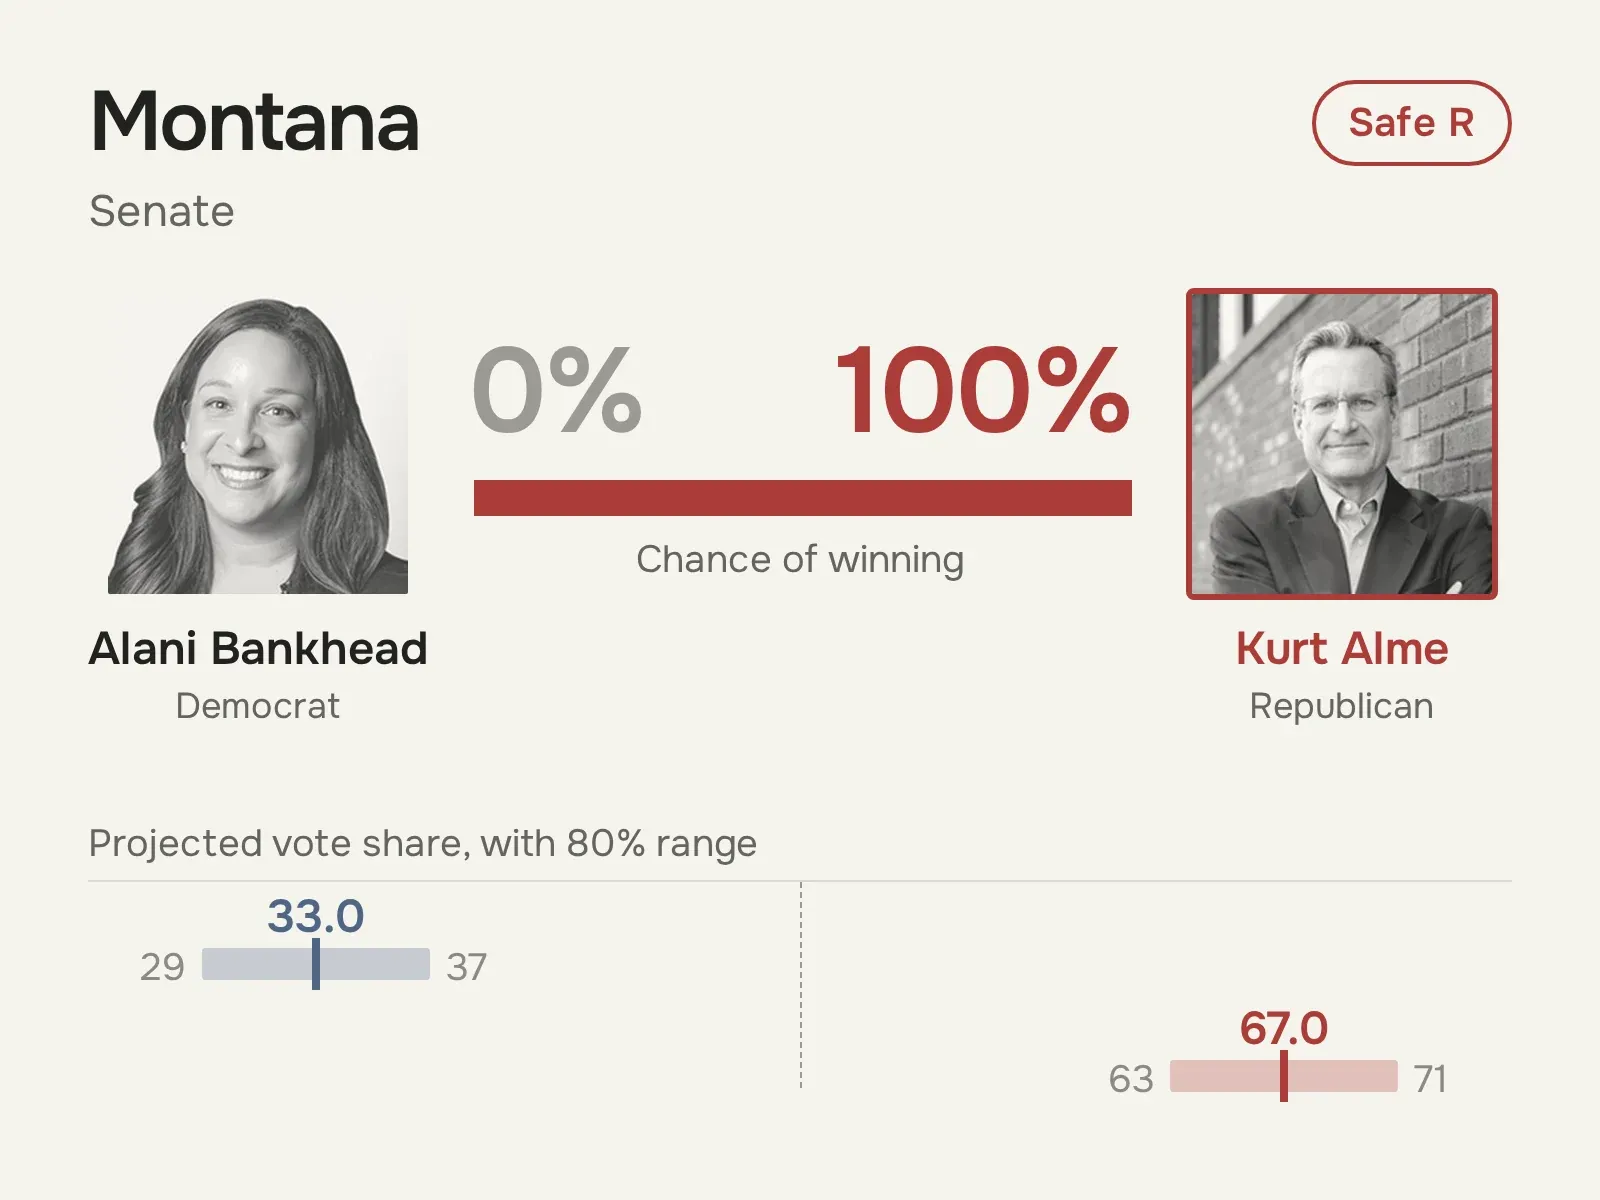 View full size ↗
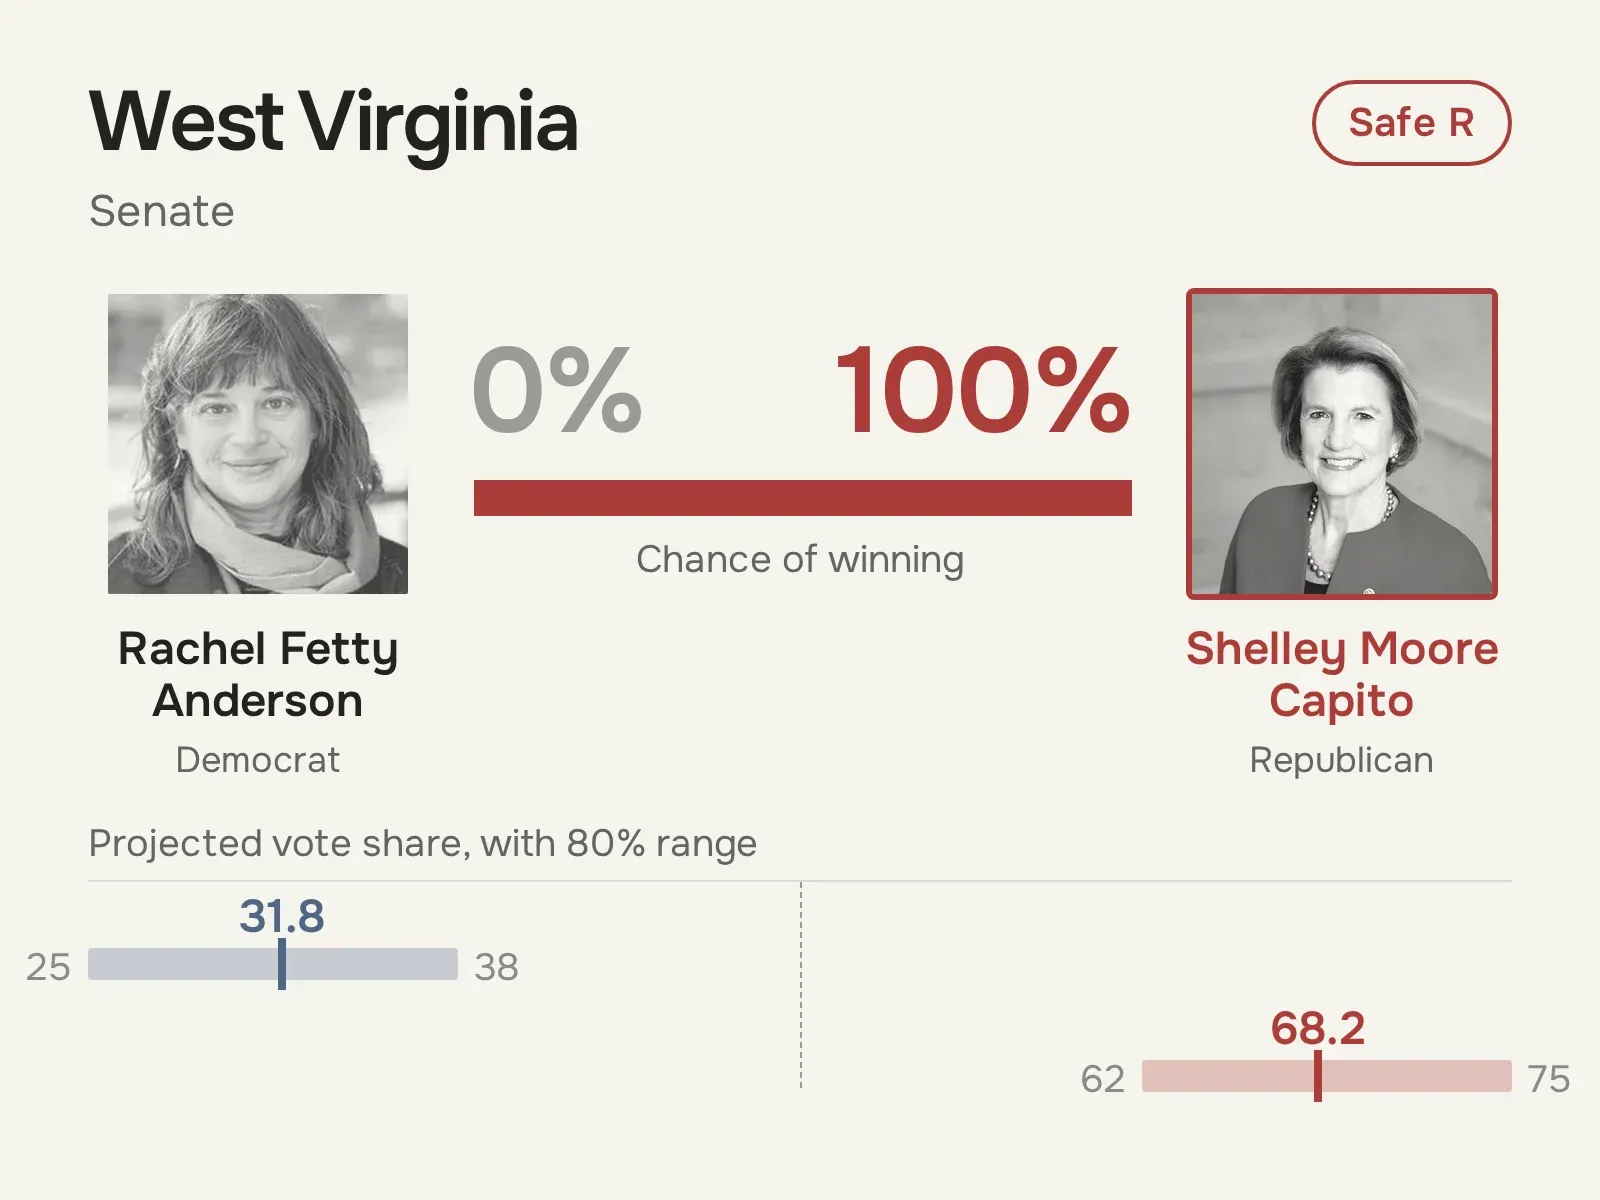 View full size ↗
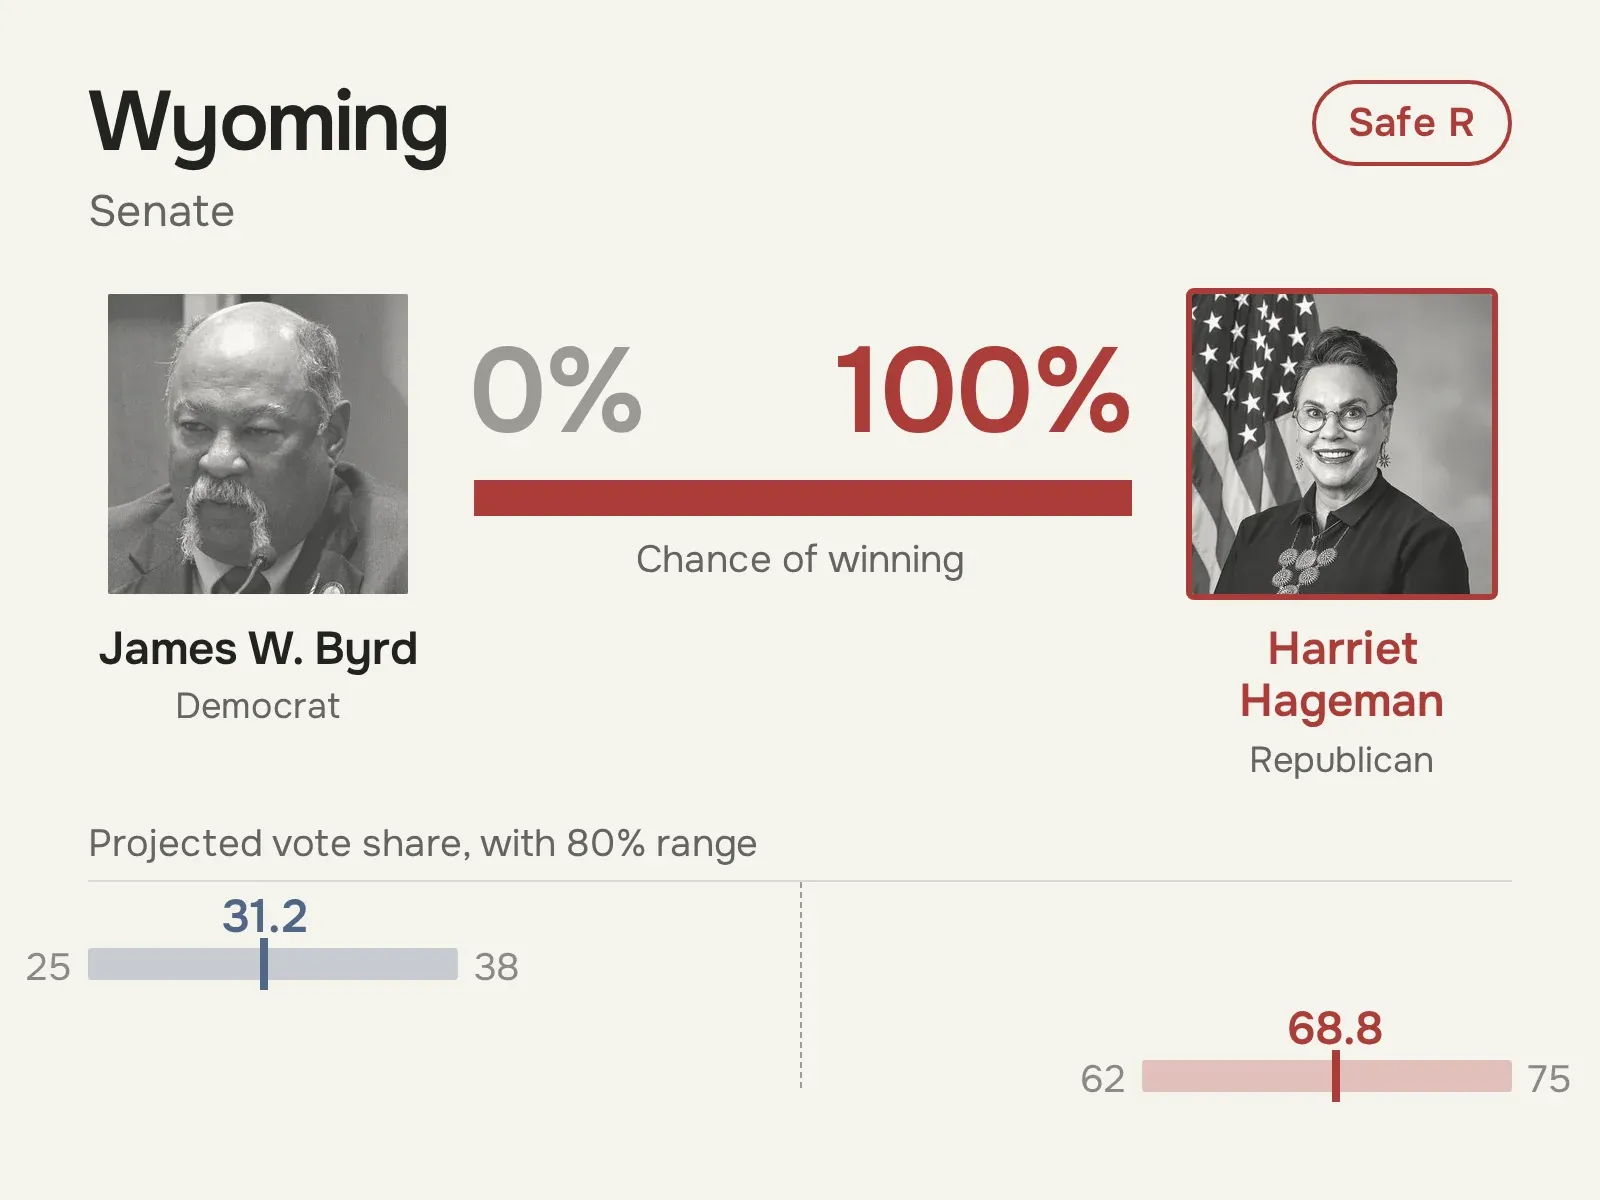 View full size ↗
Governors
Of the 36 governor races, we project 22 Democratic and 14 Republican winners.
Toss-up · 2 races (leader under 60%)
Lean · 4 races (leader 60–79%)
Likely · 10 races (leader 80–94%)
Safe · 20 races (leader 95% or higher)
 View full size ↗
 View full size ↗
 View full size ↗
 View full size ↗
 View full size ↗
 View full size ↗
 View full size ↗
 View full size ↗
 View full size ↗
 View full size ↗
 View full size ↗
 View full size ↗
 View full size ↗
 View full size ↗
 View full size ↗
 View full size ↗
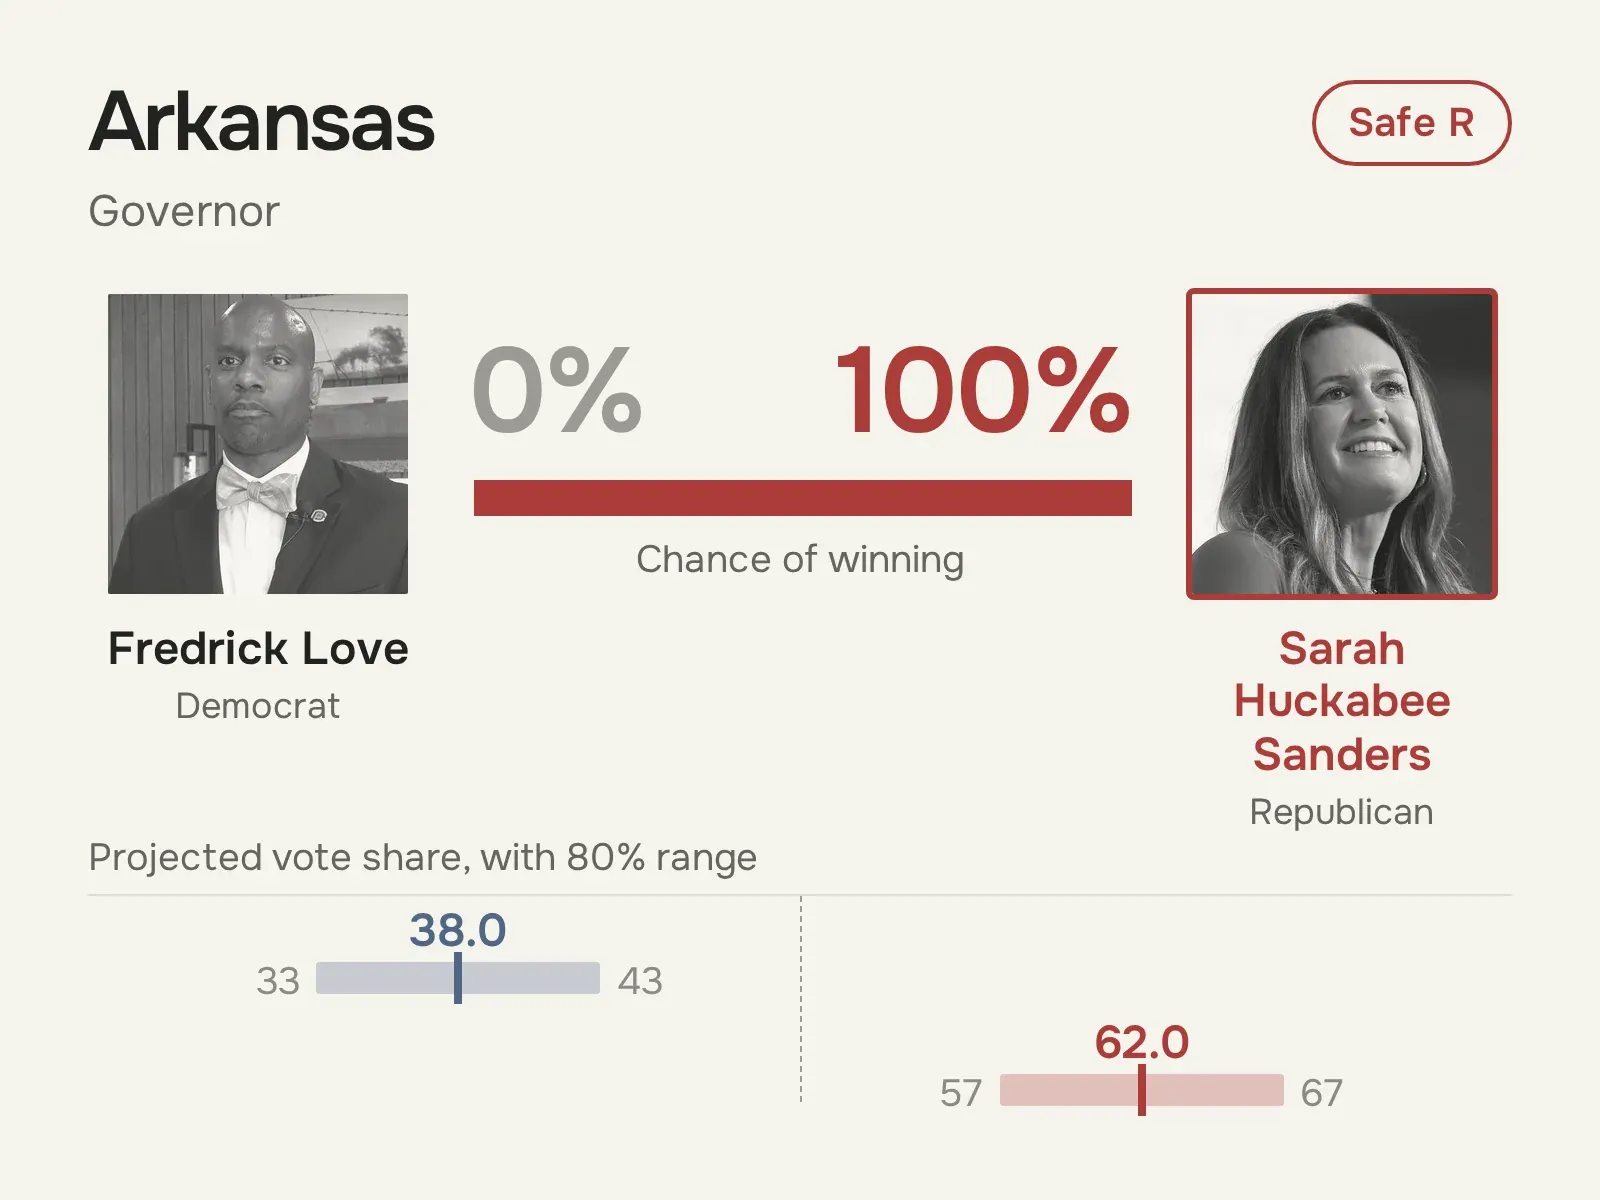 View full size ↗
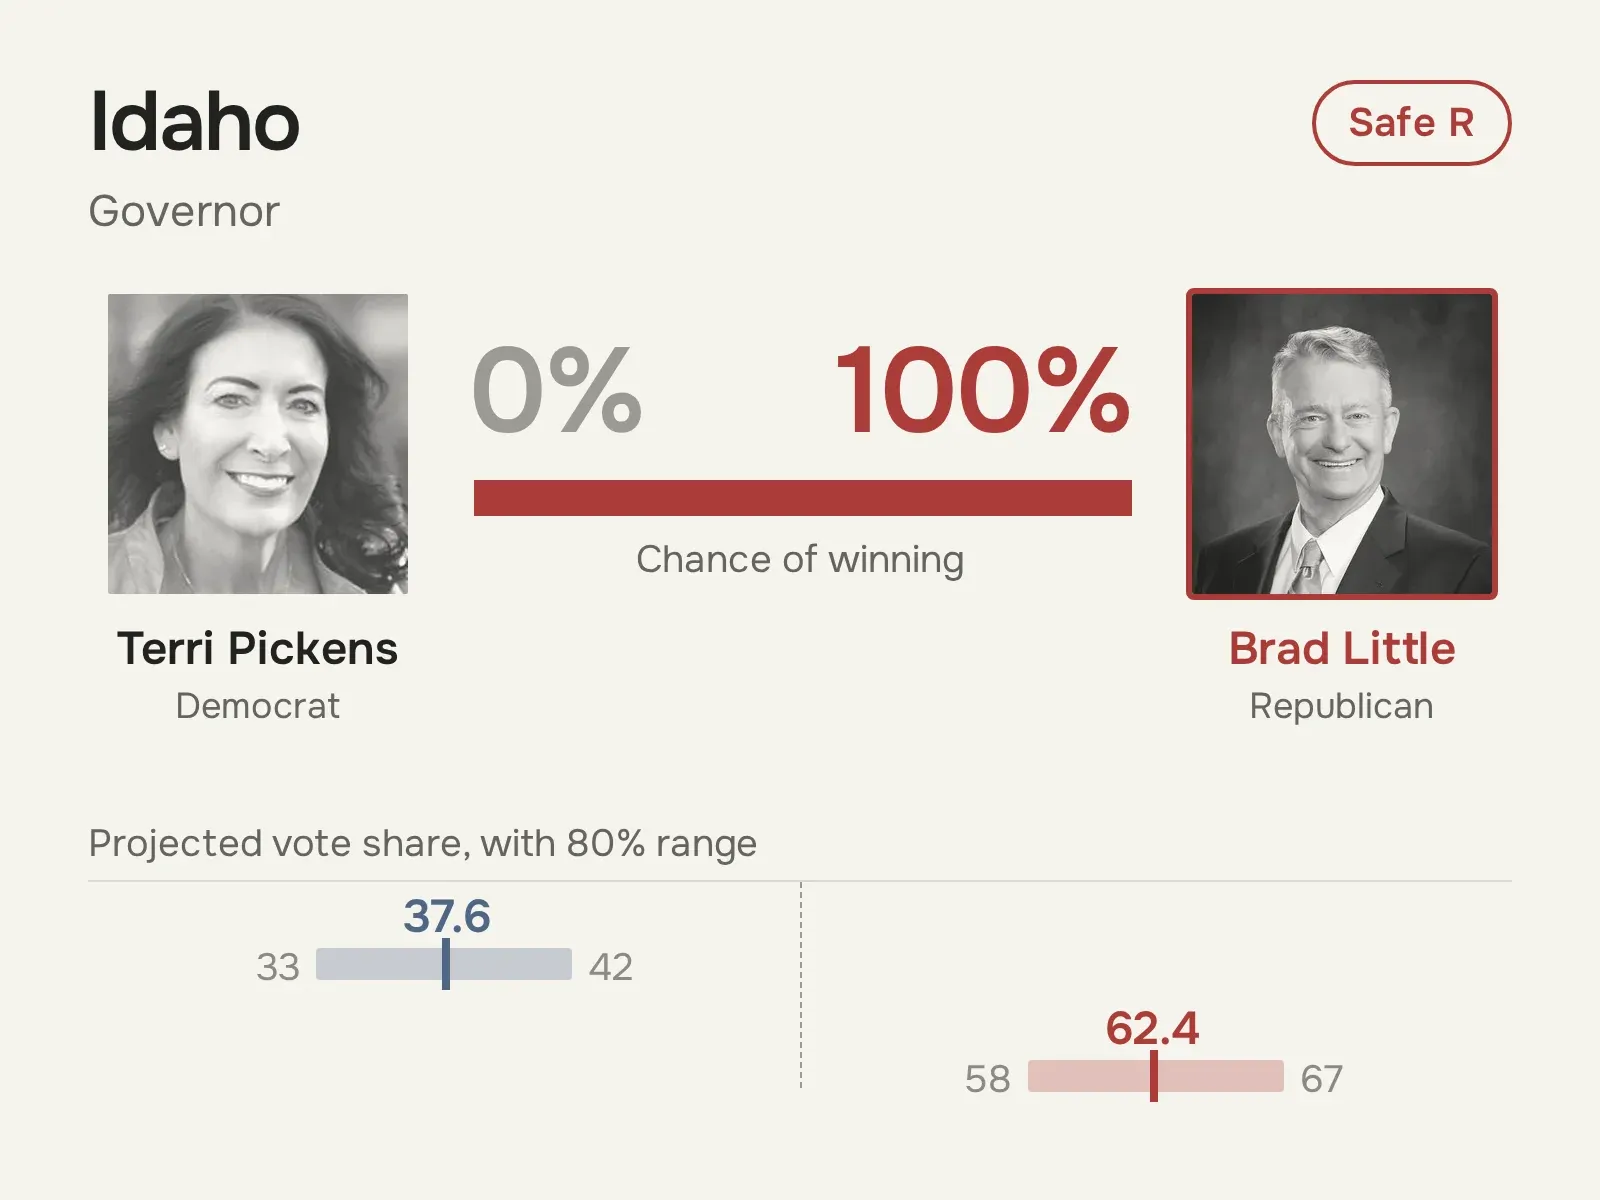 View full size ↗
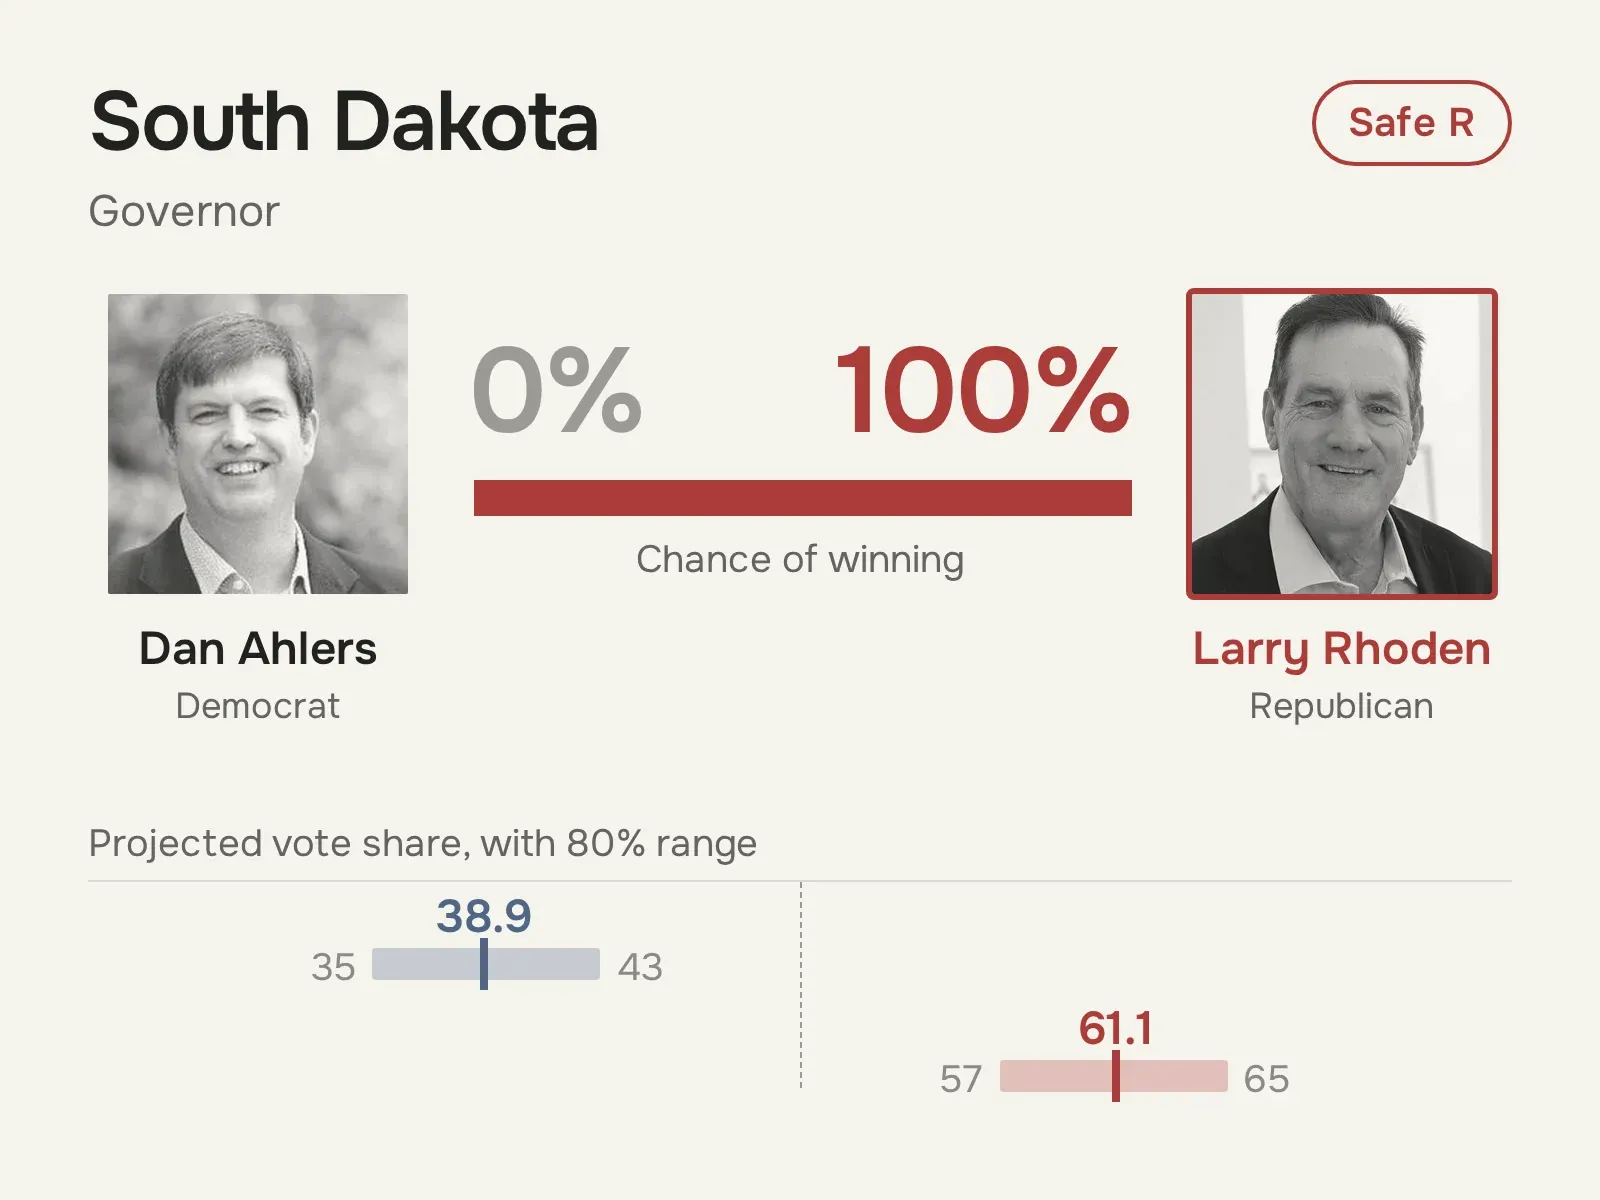 View full size ↗
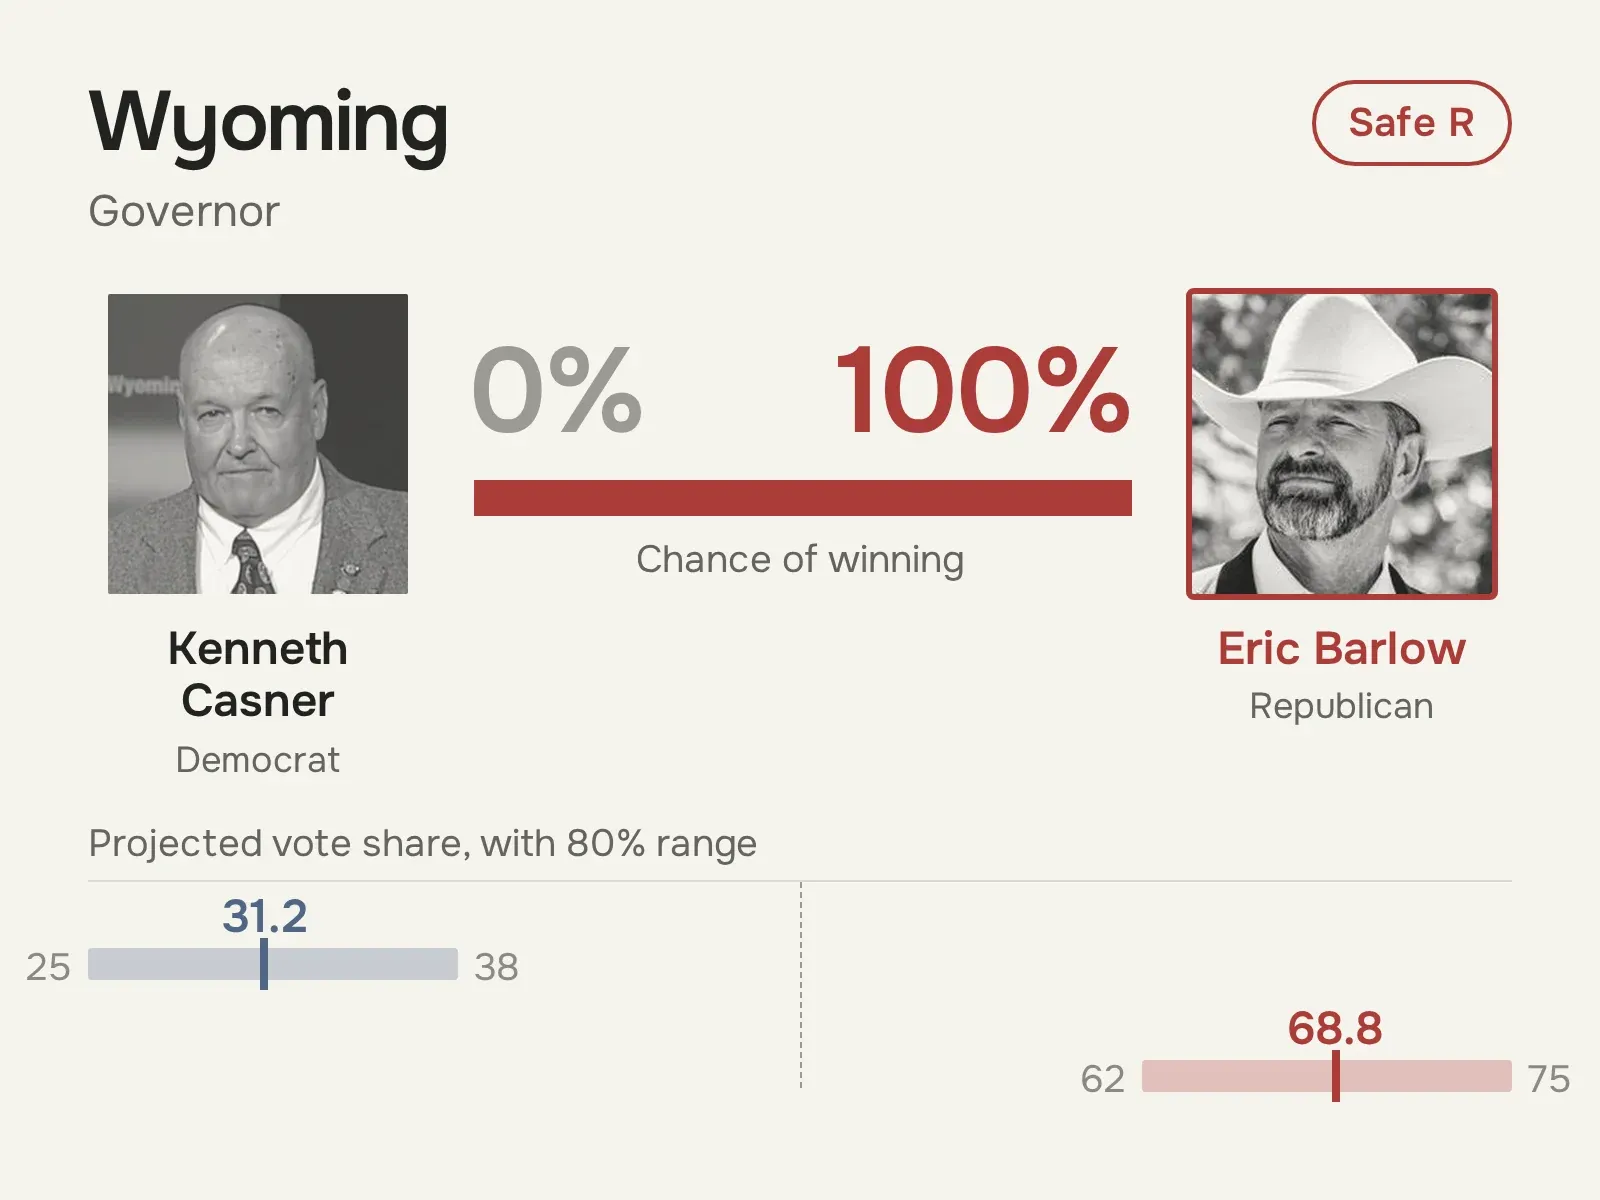 View full size ↗
House
Democrats win the House in 94% of outcomes, with a projected 237–198 split. These are the 57 closest seats.
Toss-up · 14 races (leader under 60%)
Lean D · 15 races (leader 60–79%)
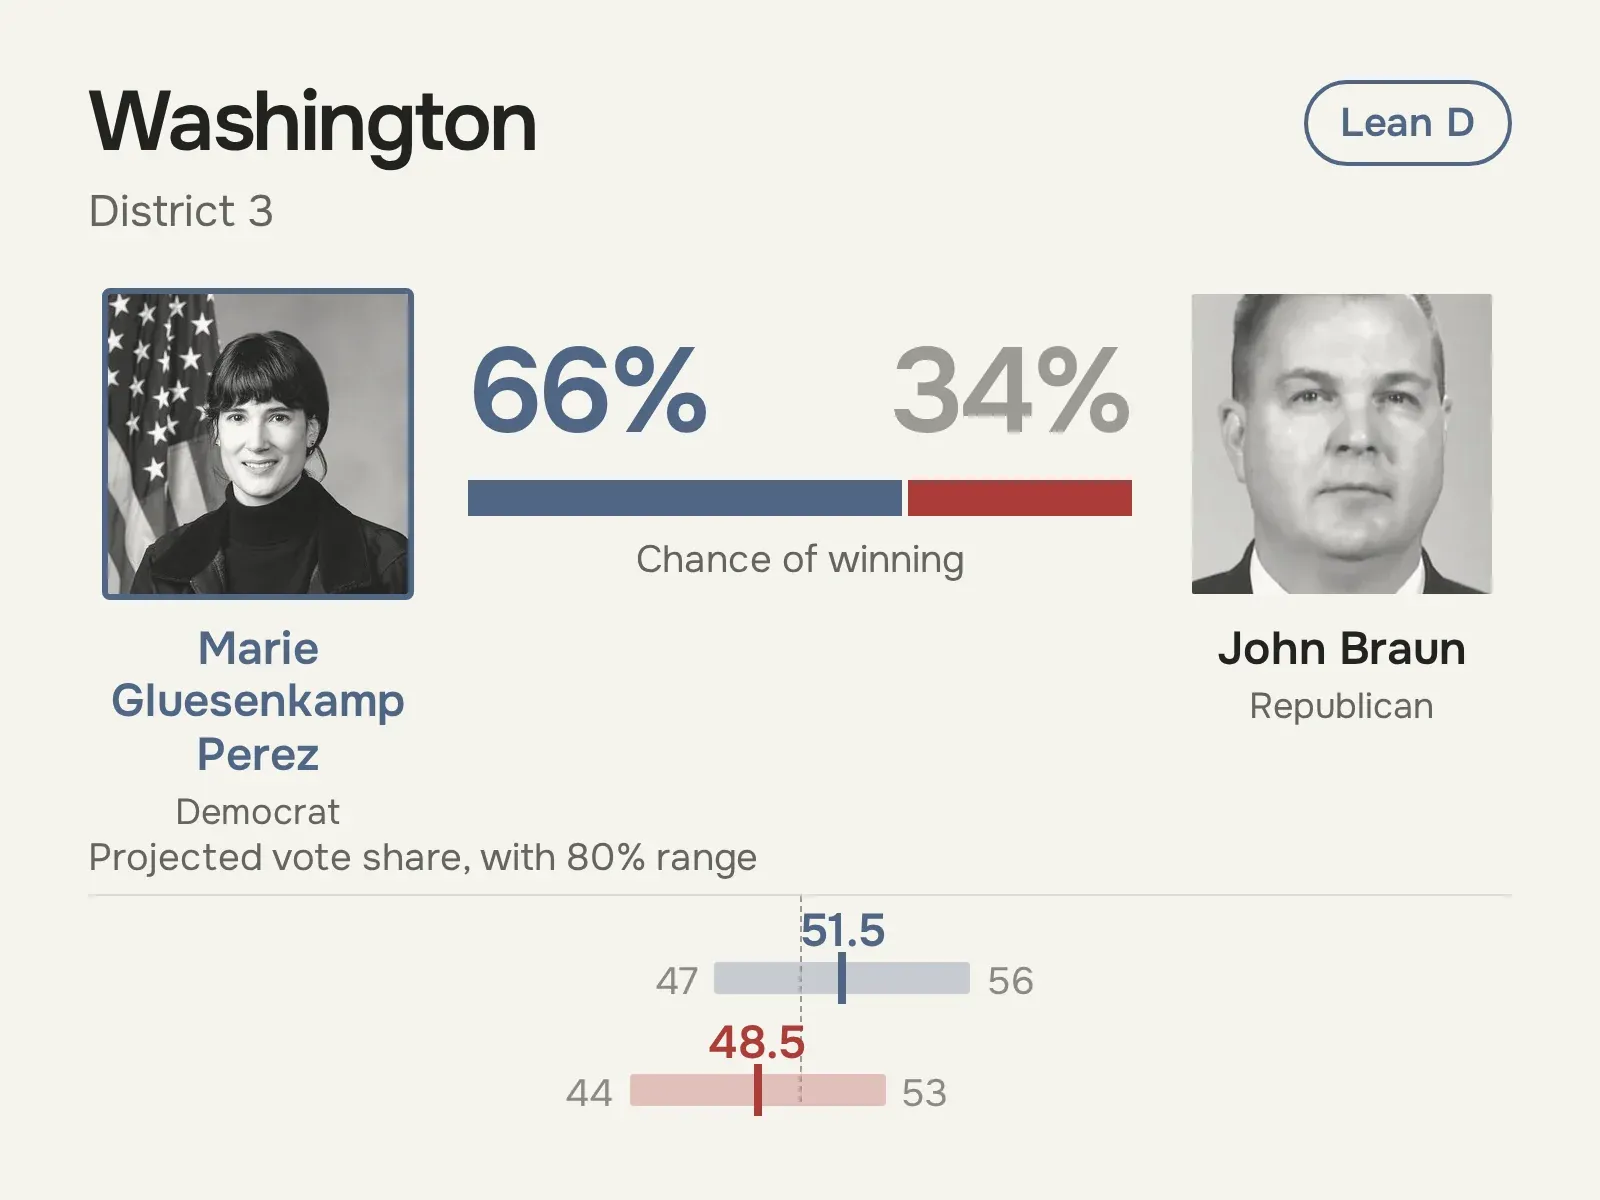
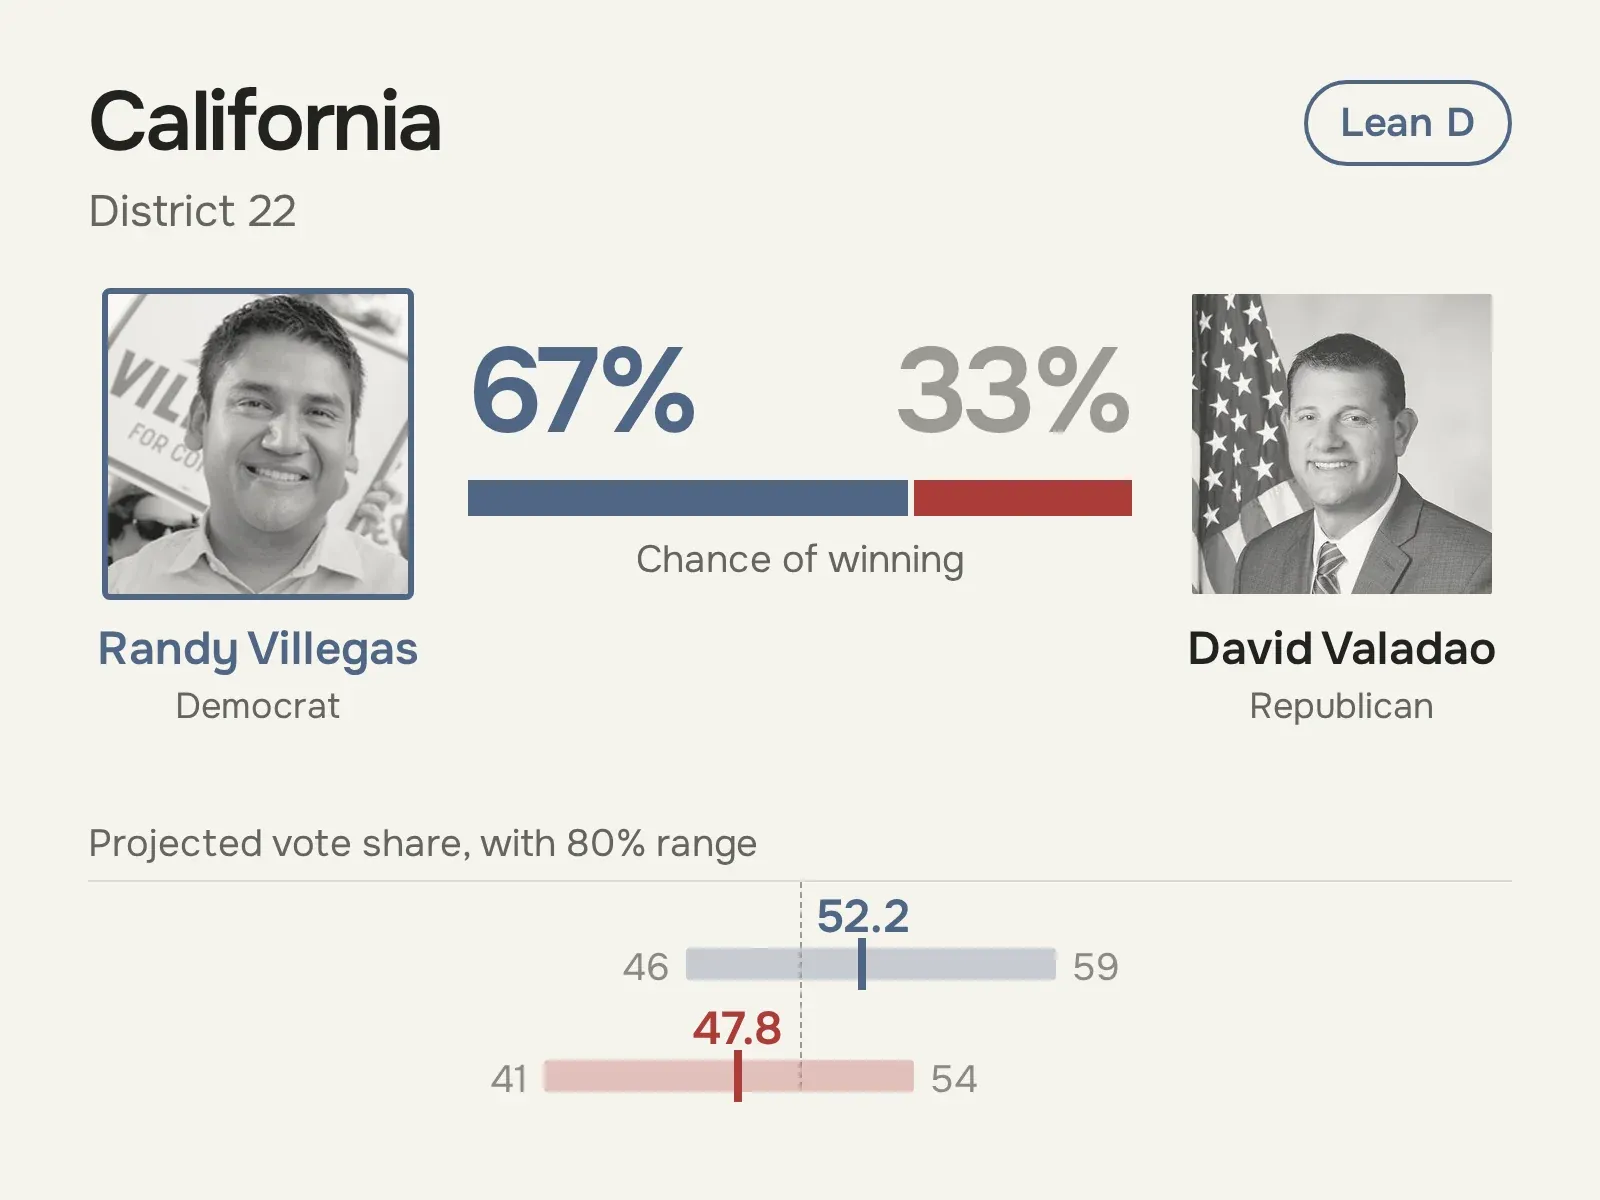
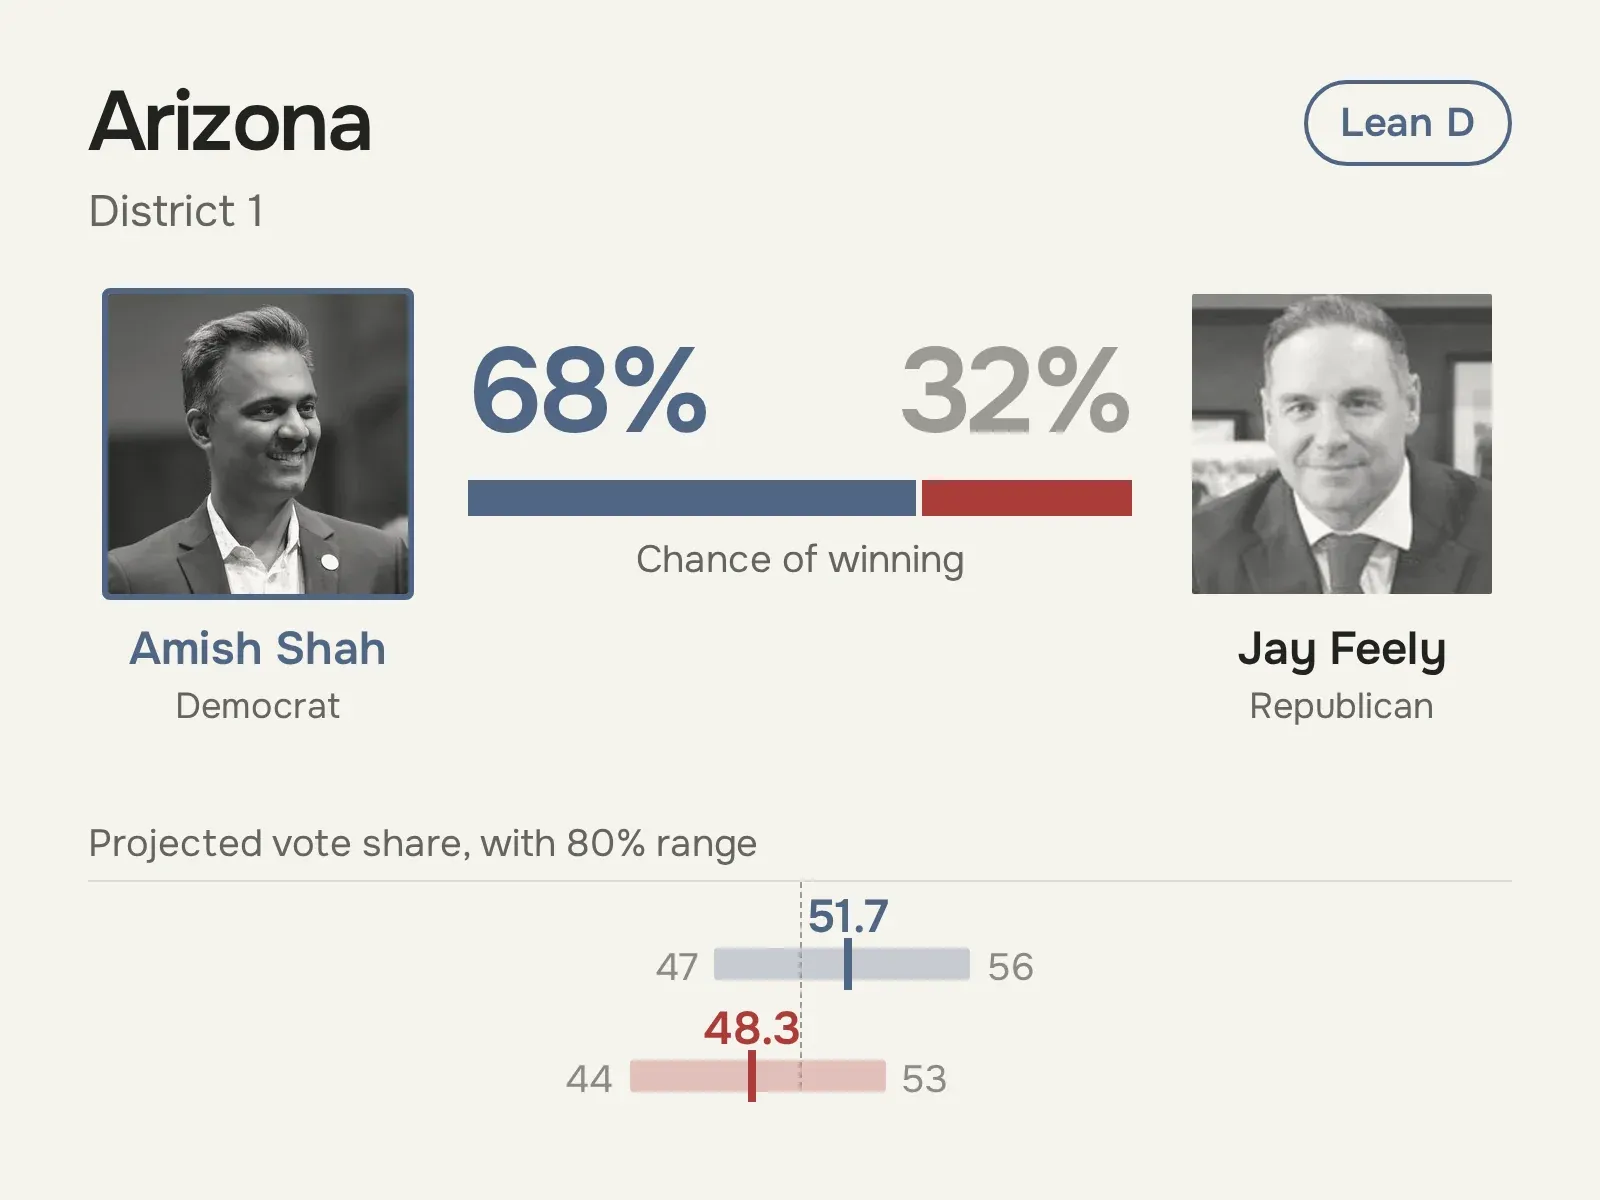
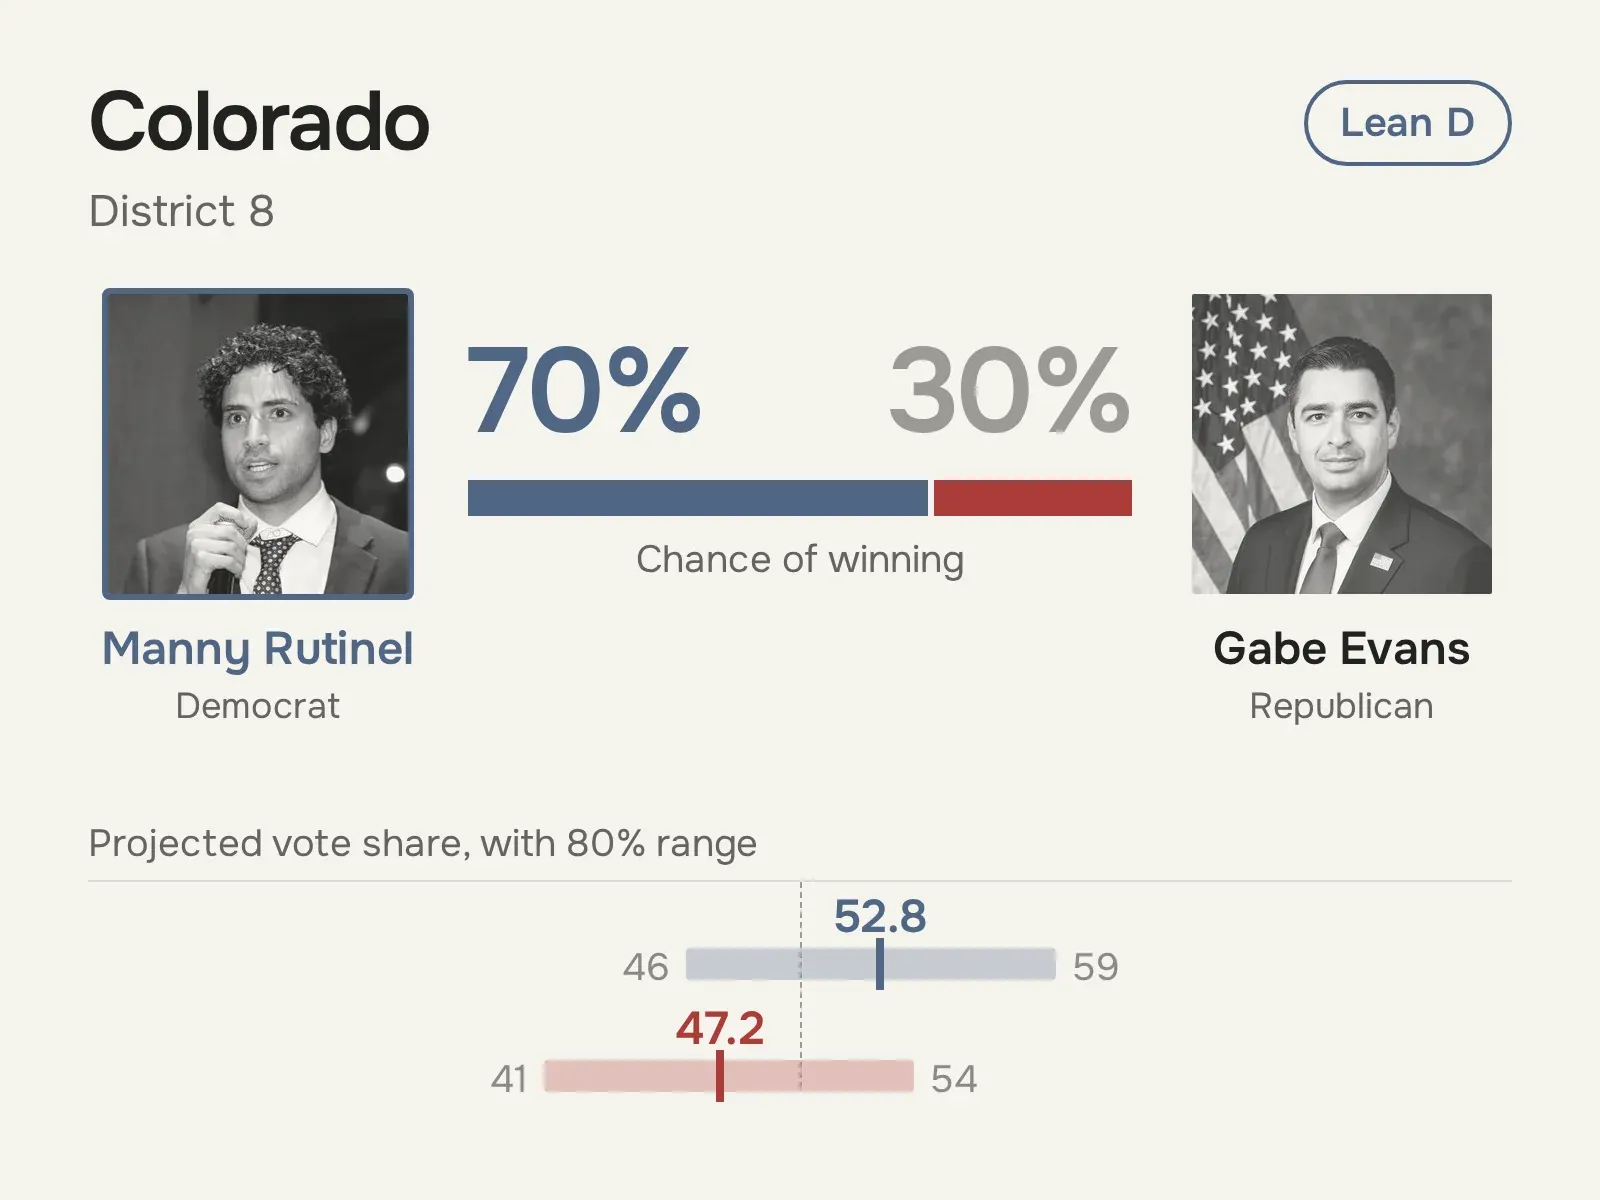
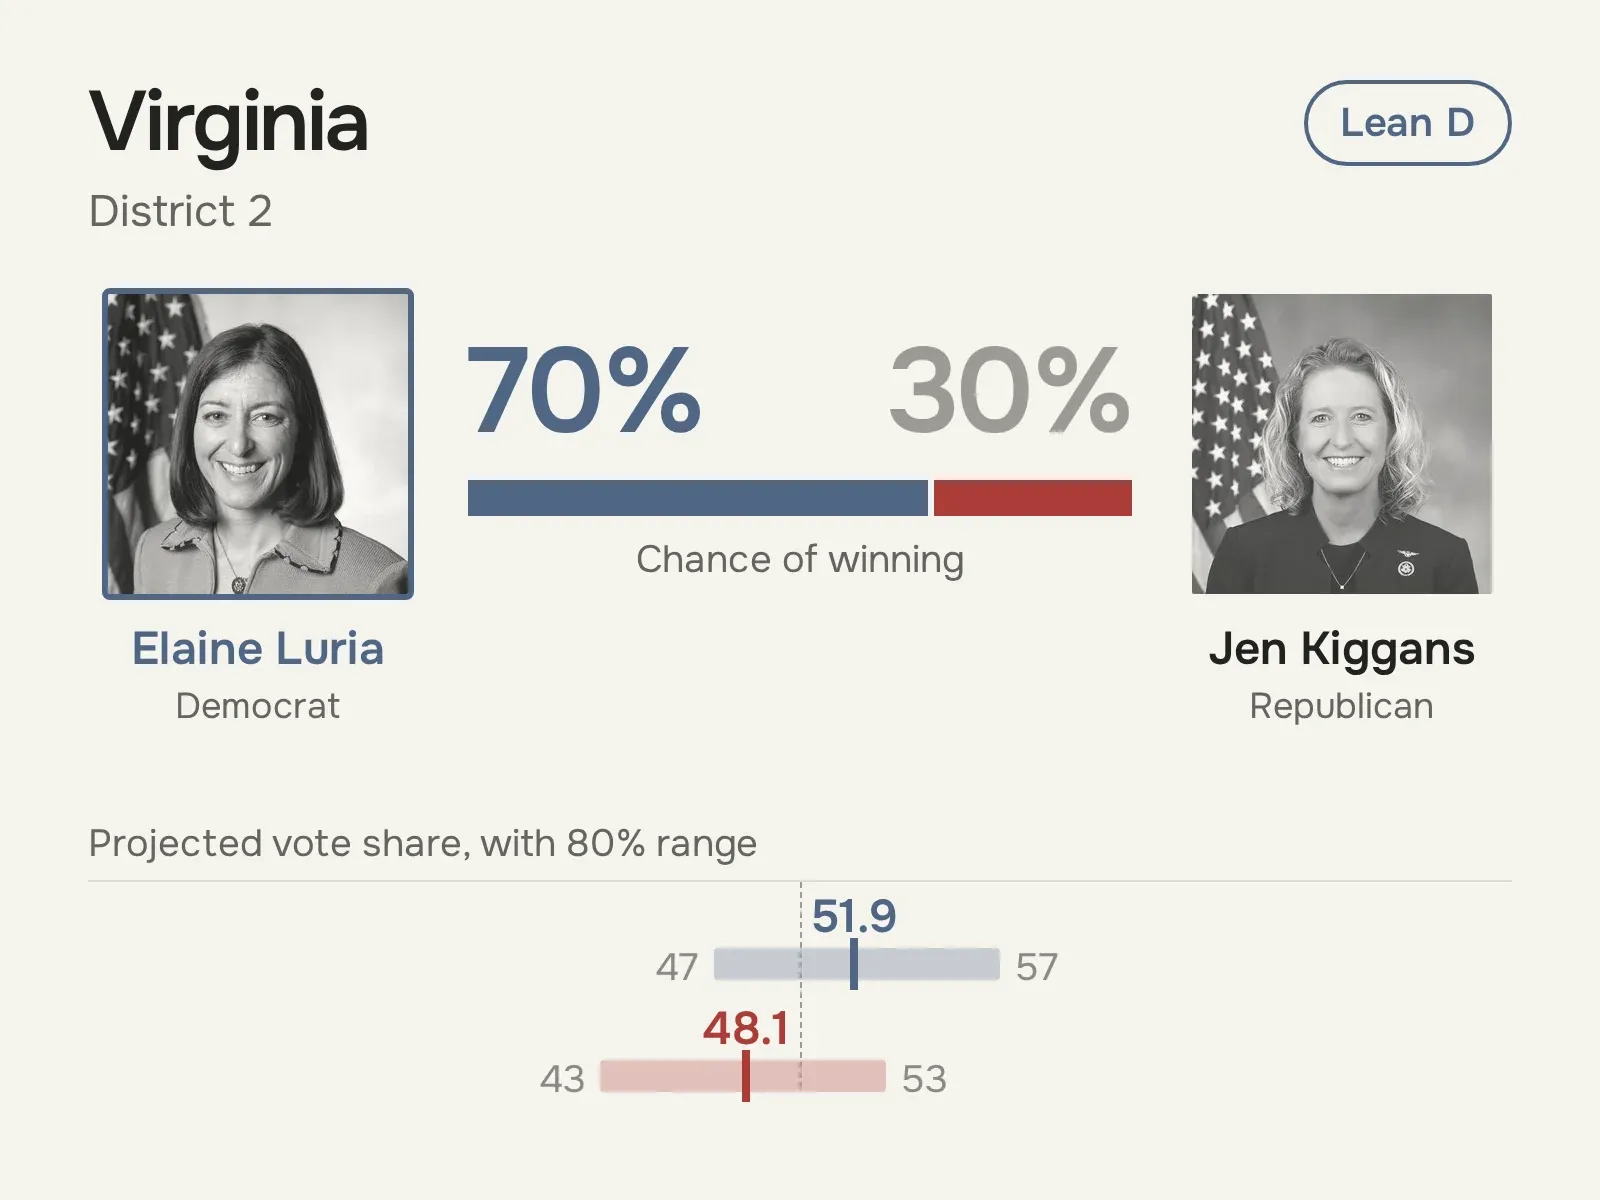
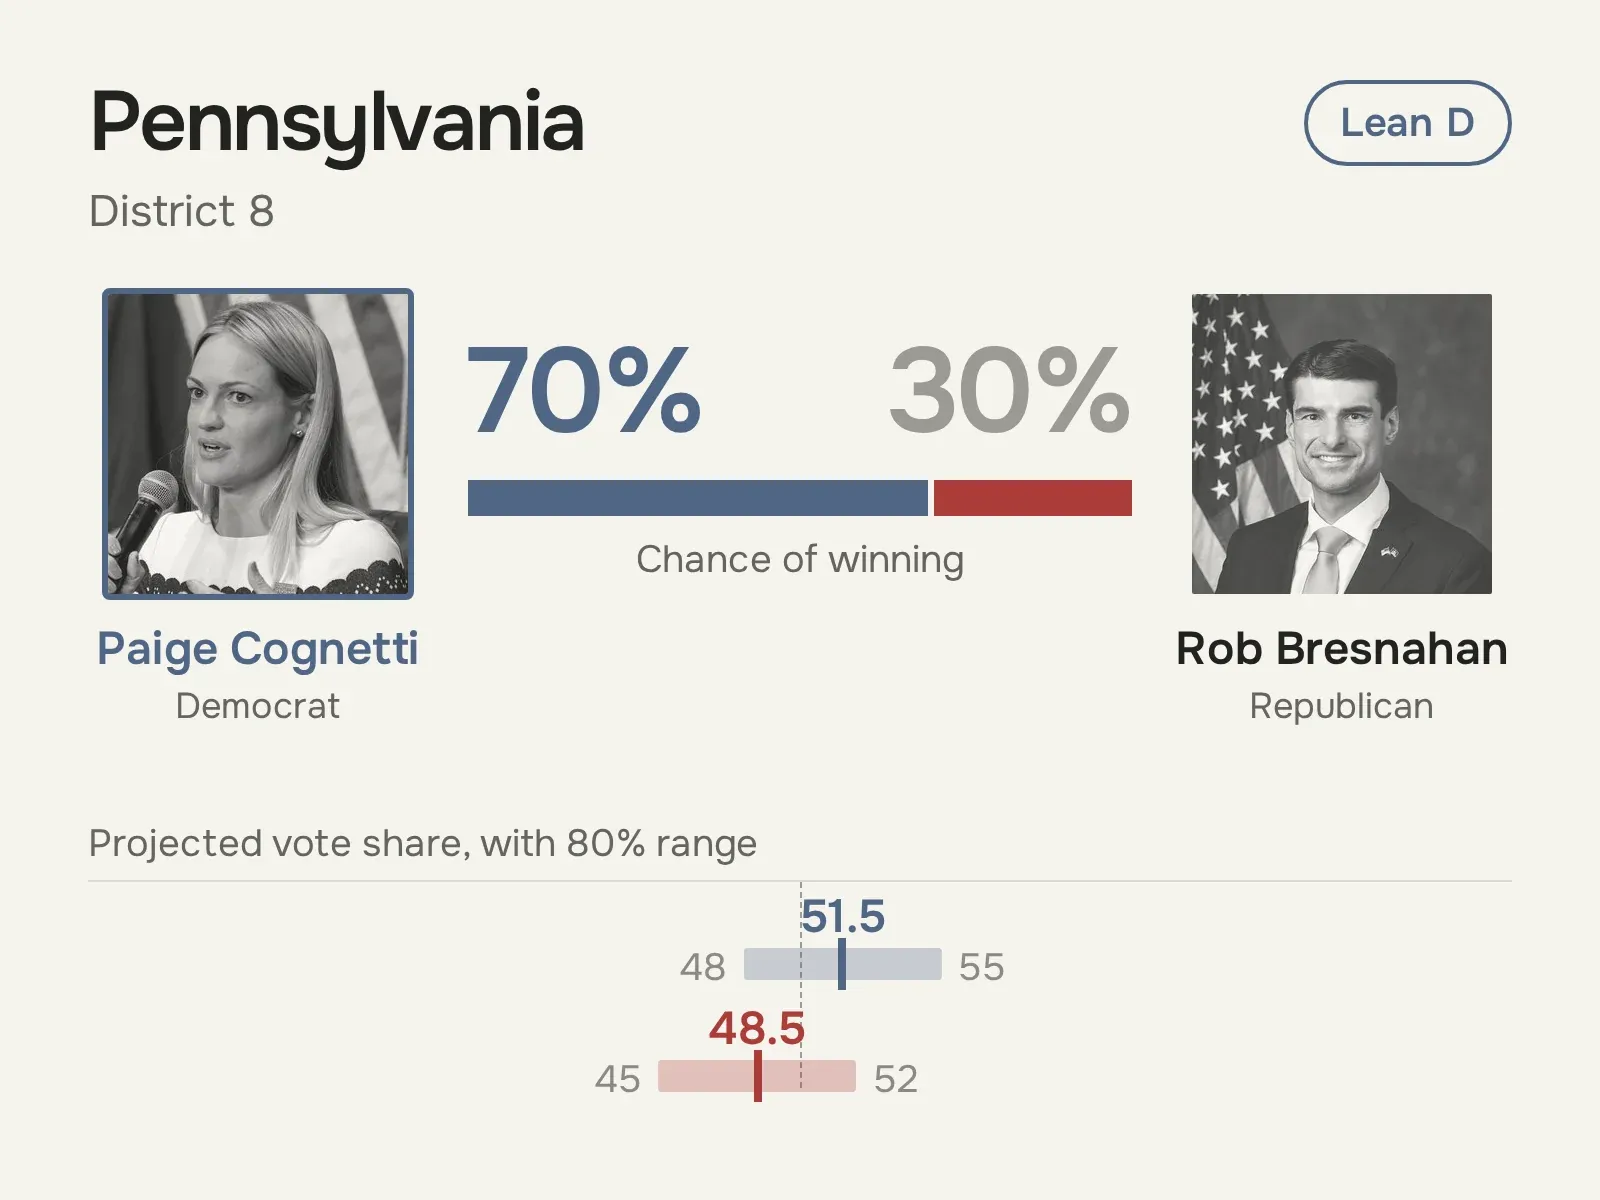
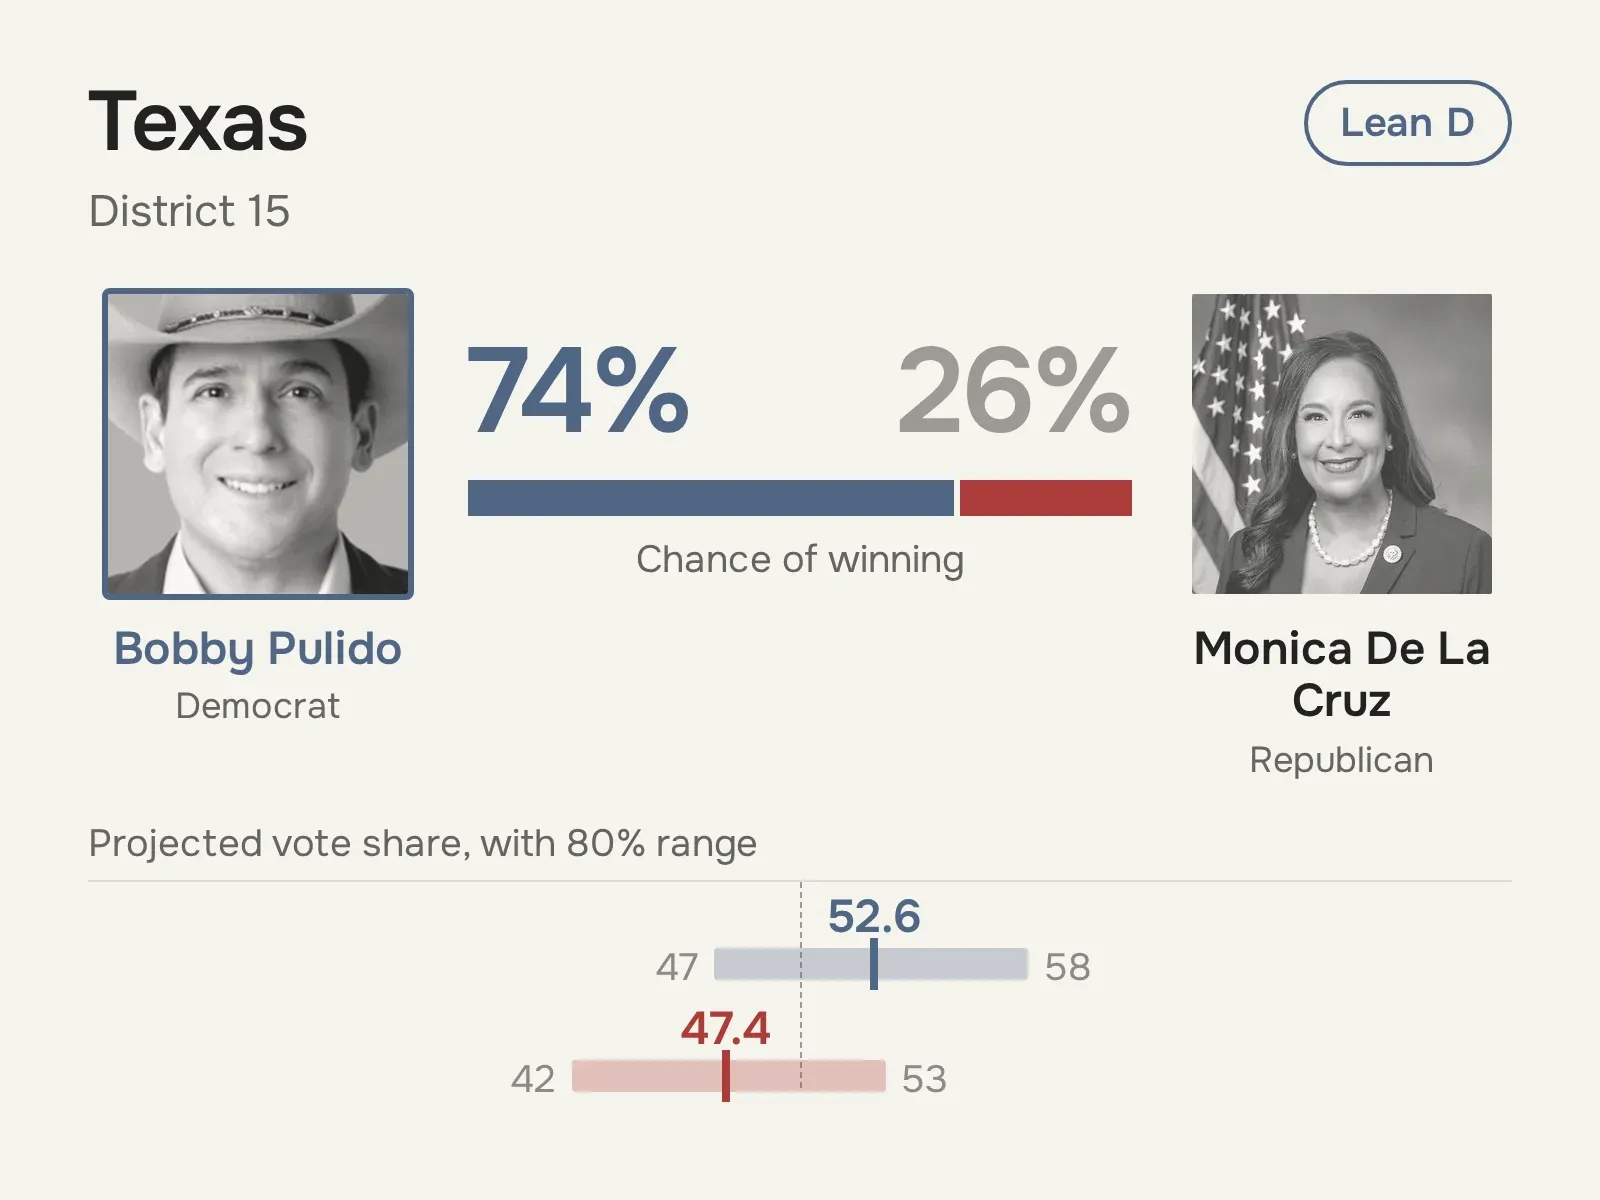
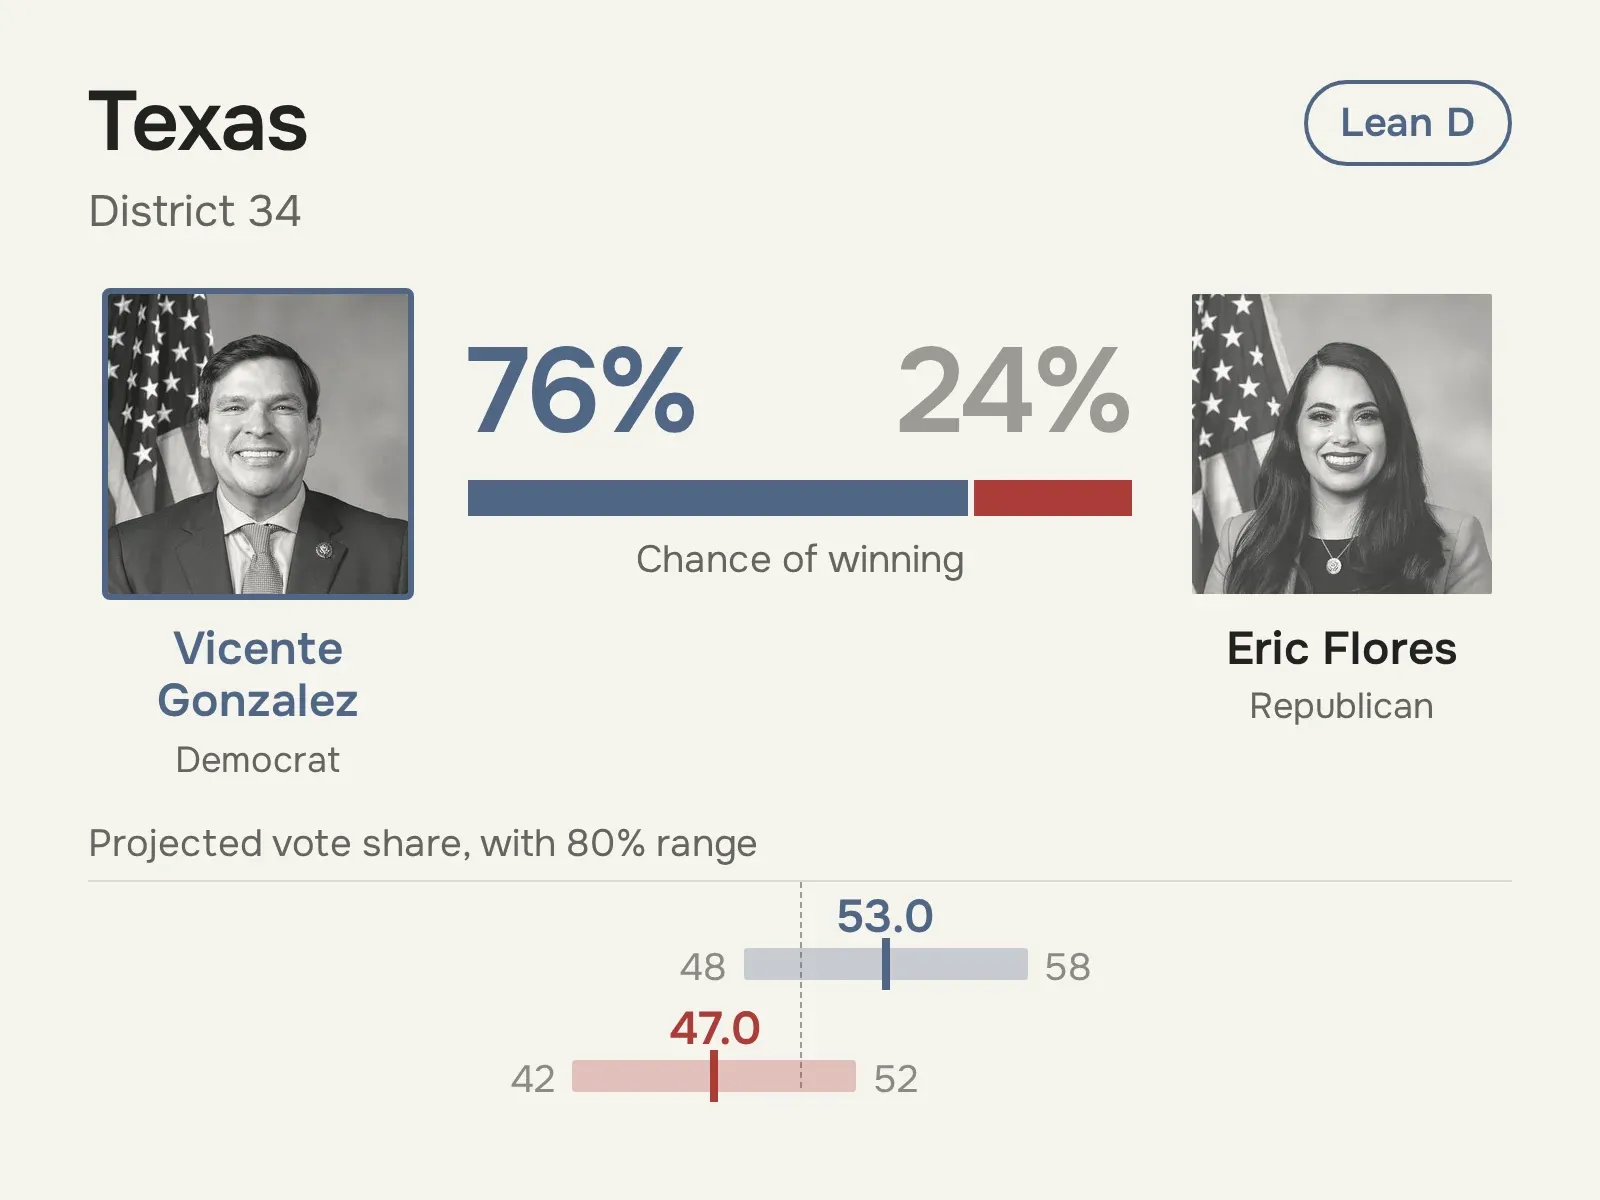
Lean R · 27 races (leader 60–79%)
 View full size ↗
 View full size ↗
 View full size ↗
 View full size ↗
 View full size ↗
 View full size ↗
 View full size ↗
 View full size ↗
 View full size ↗
 View full size ↗
 View full size ↗
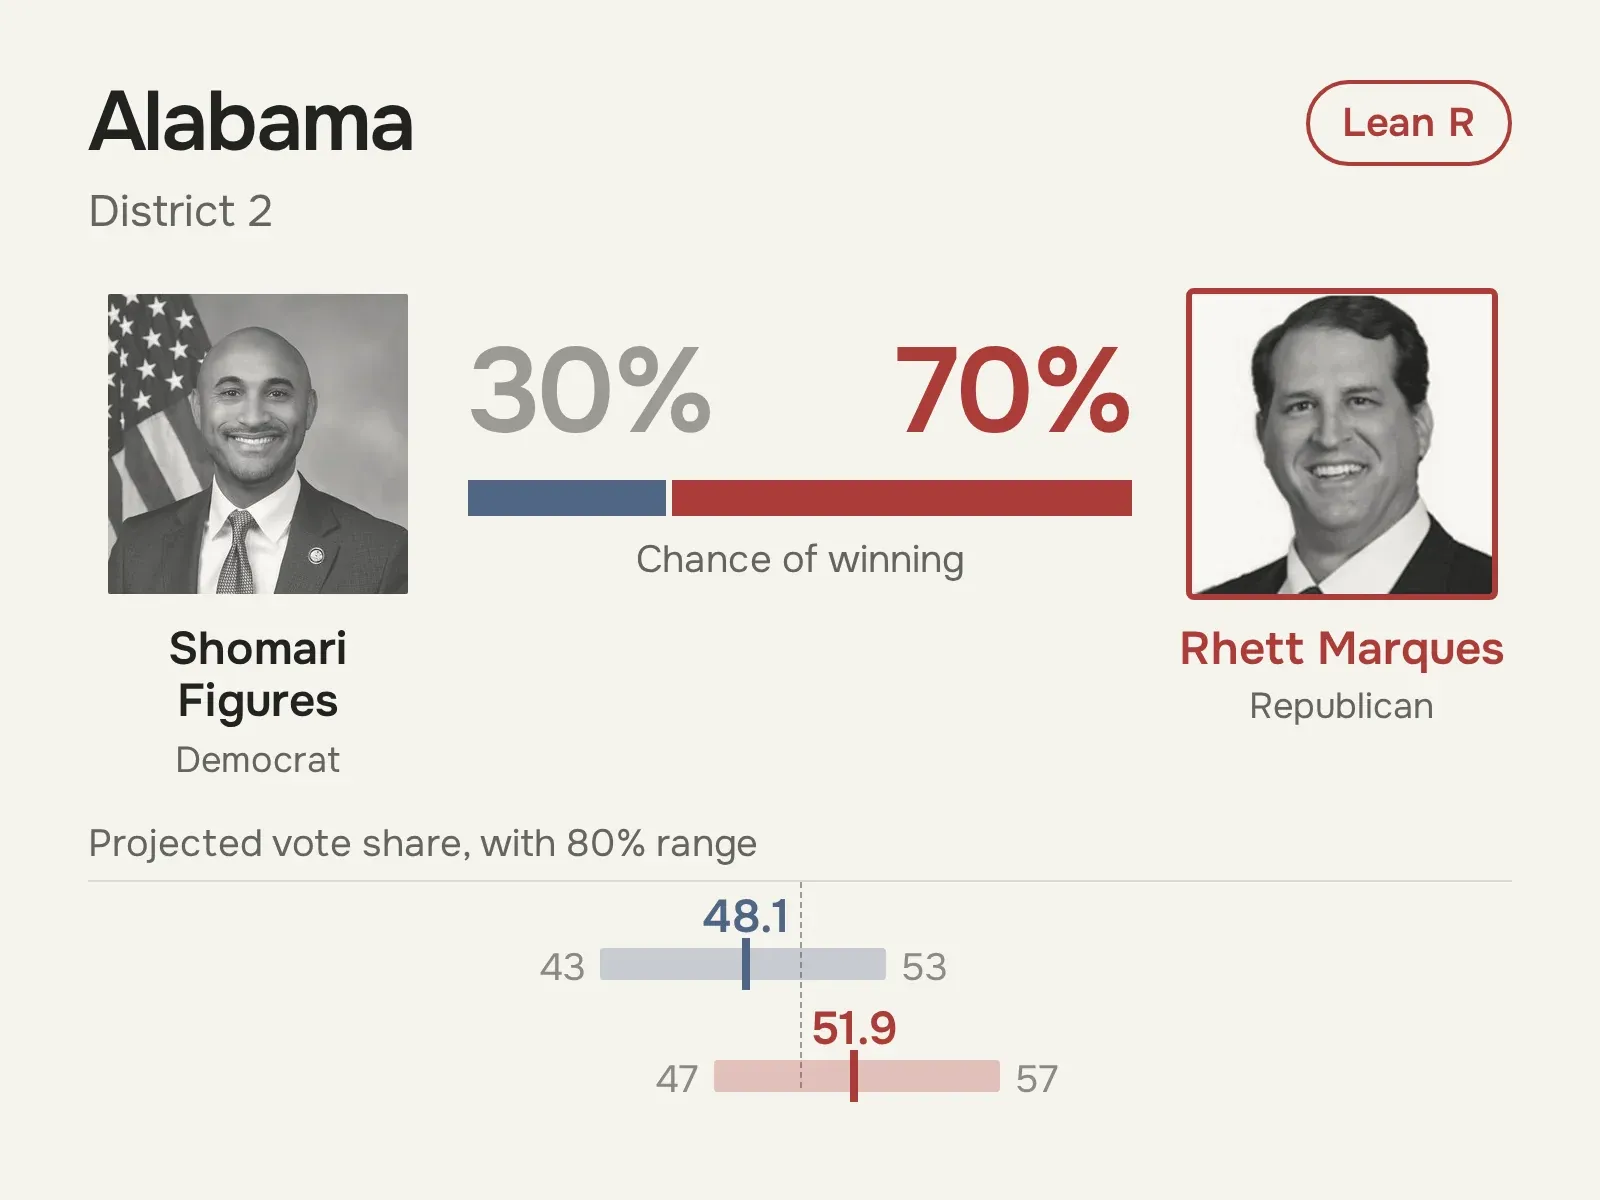 View full size ↗
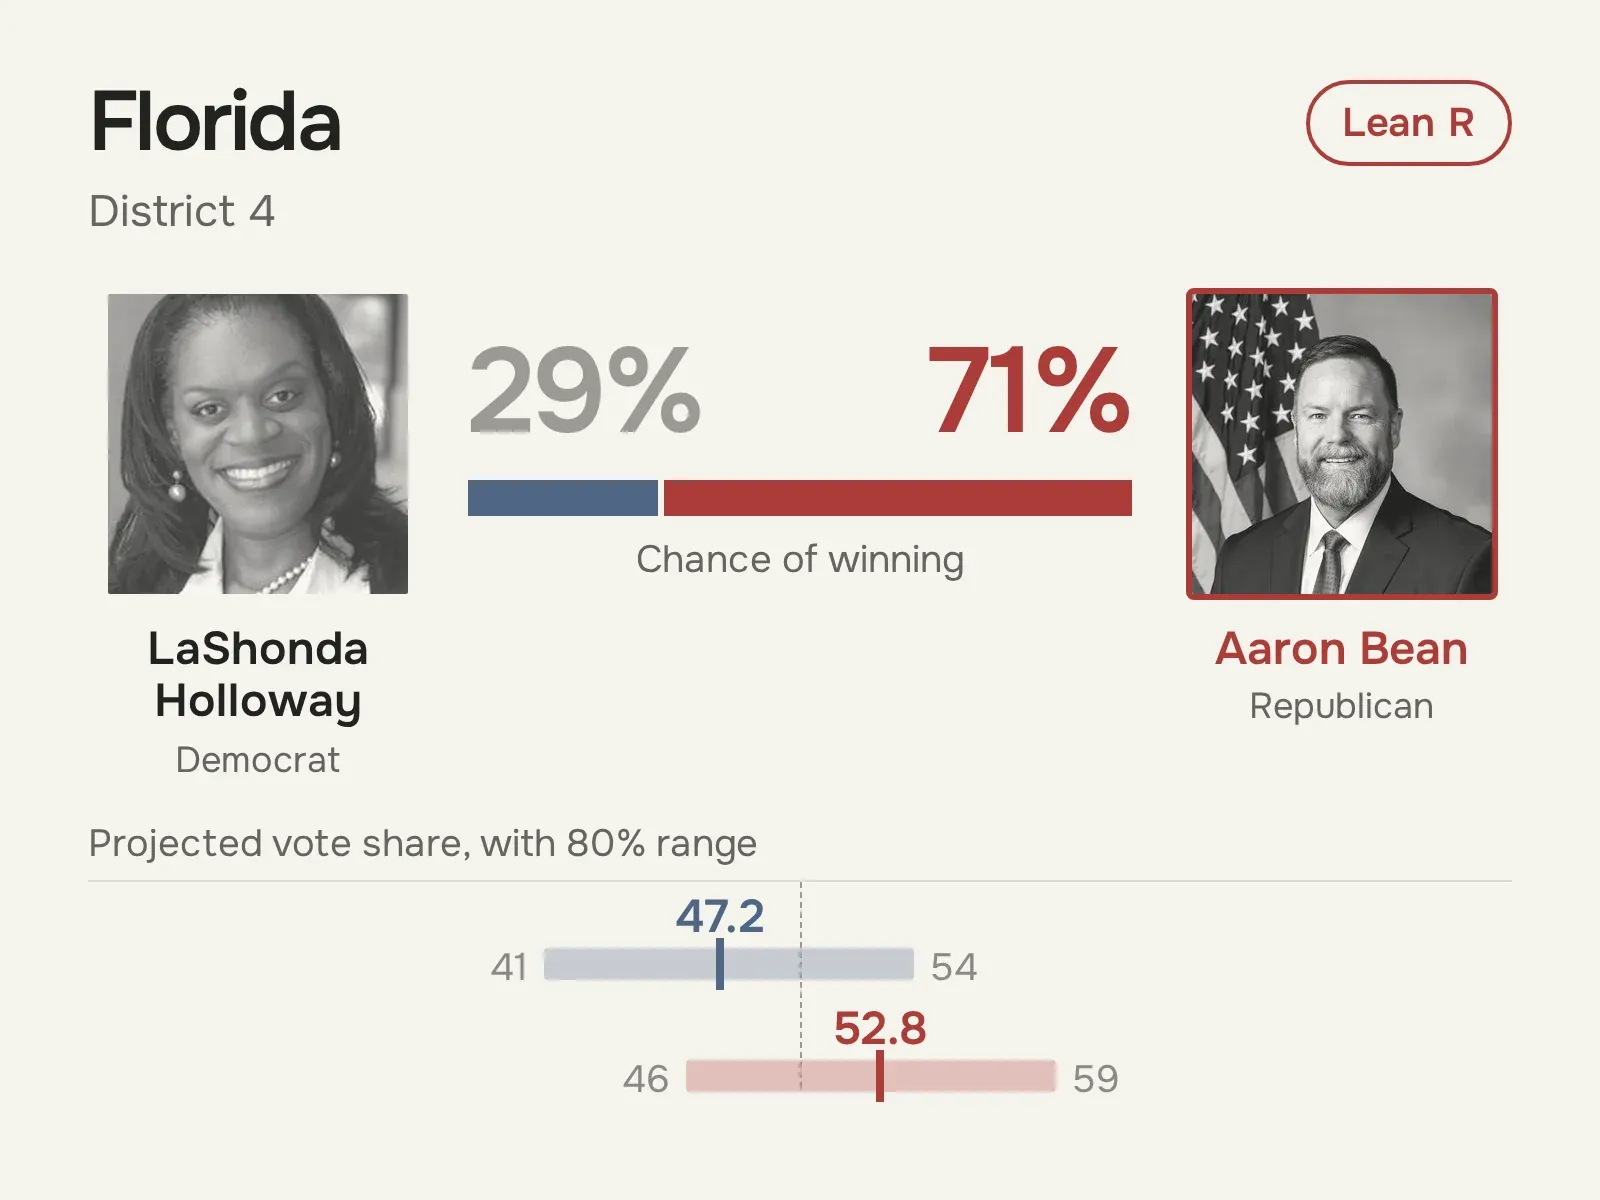 View full size ↗
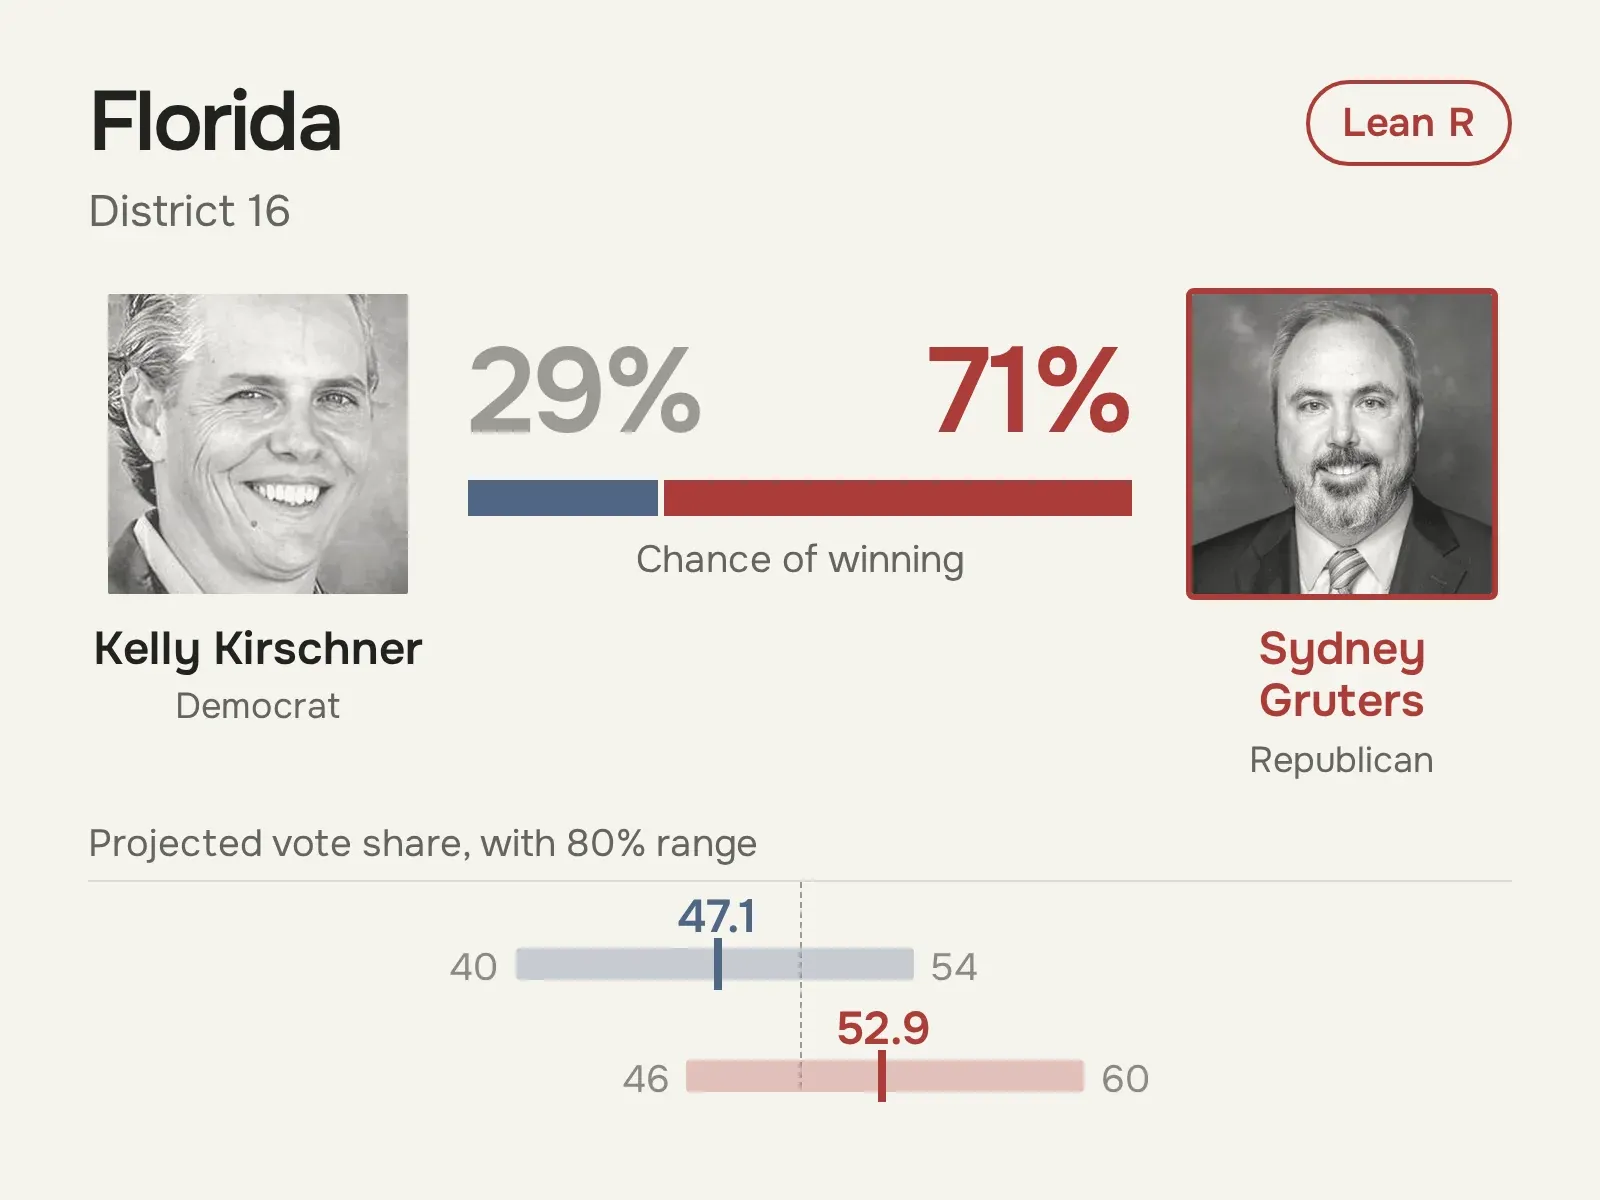 View full size ↗
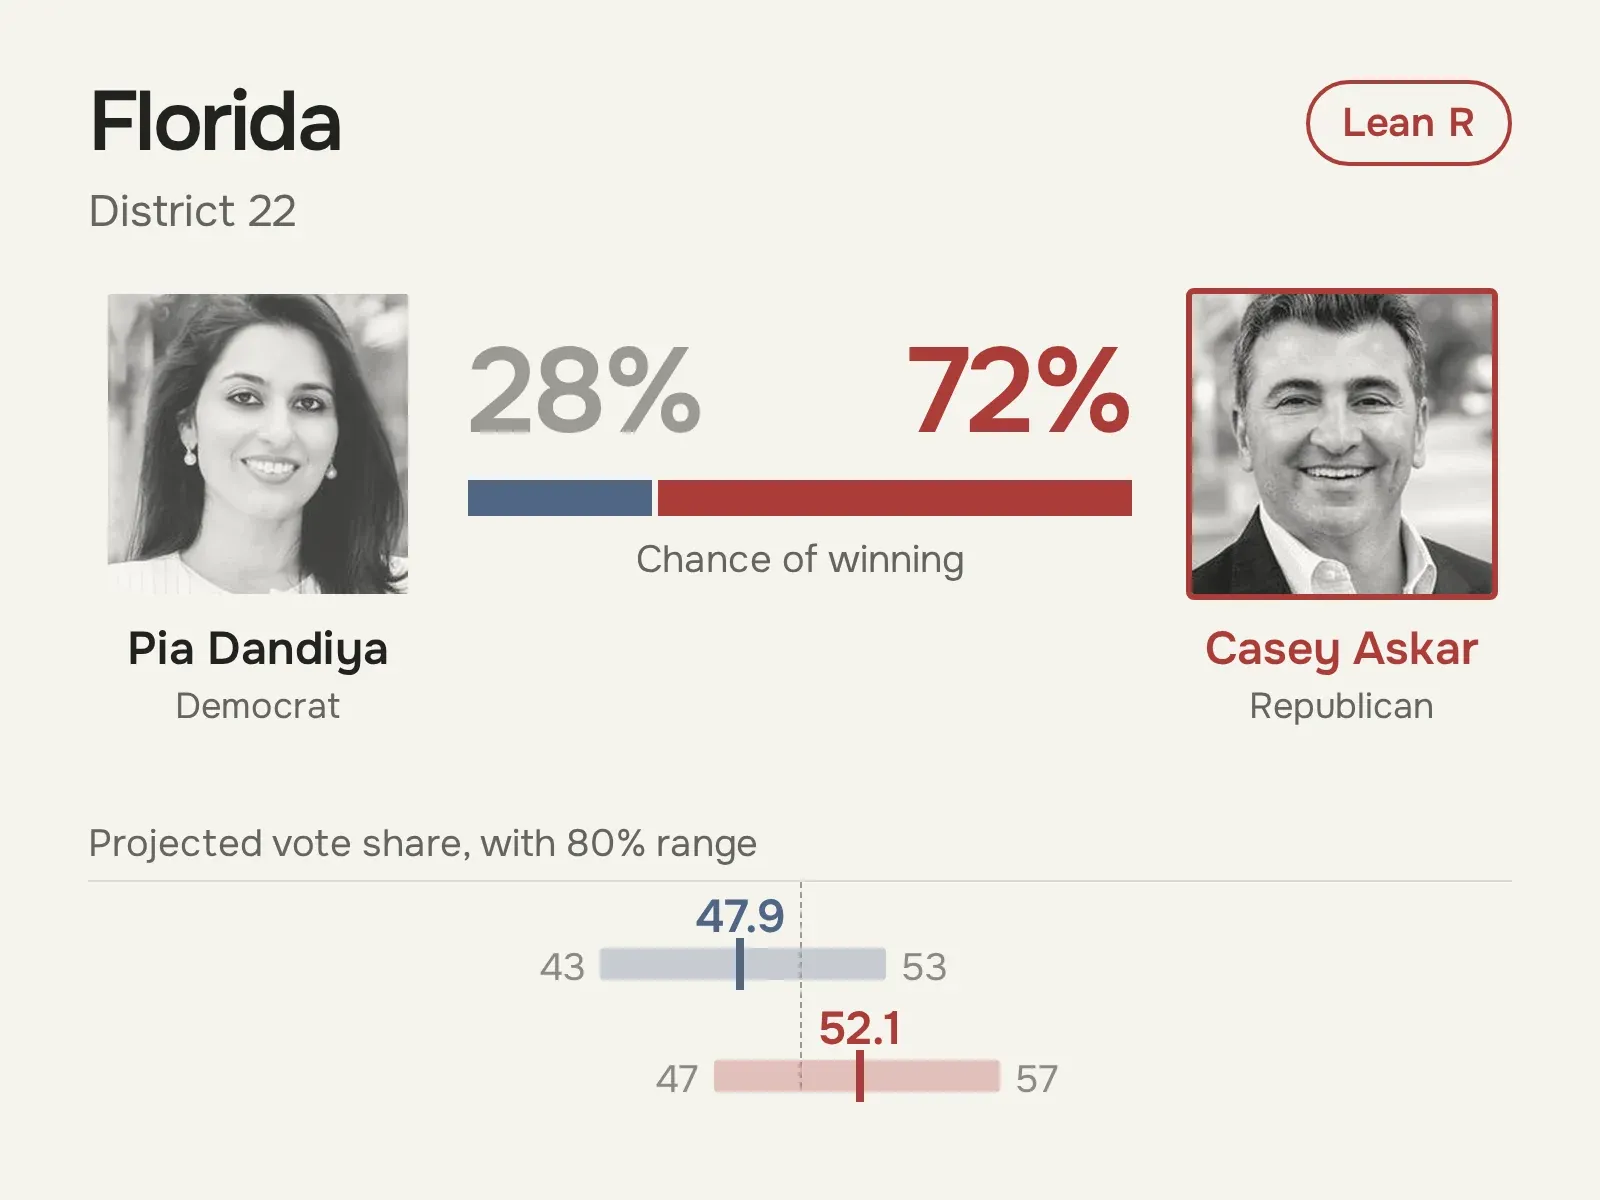 View full size ↗
 View full size ↗
 View full size ↗
 View full size ↗
 View full size ↗
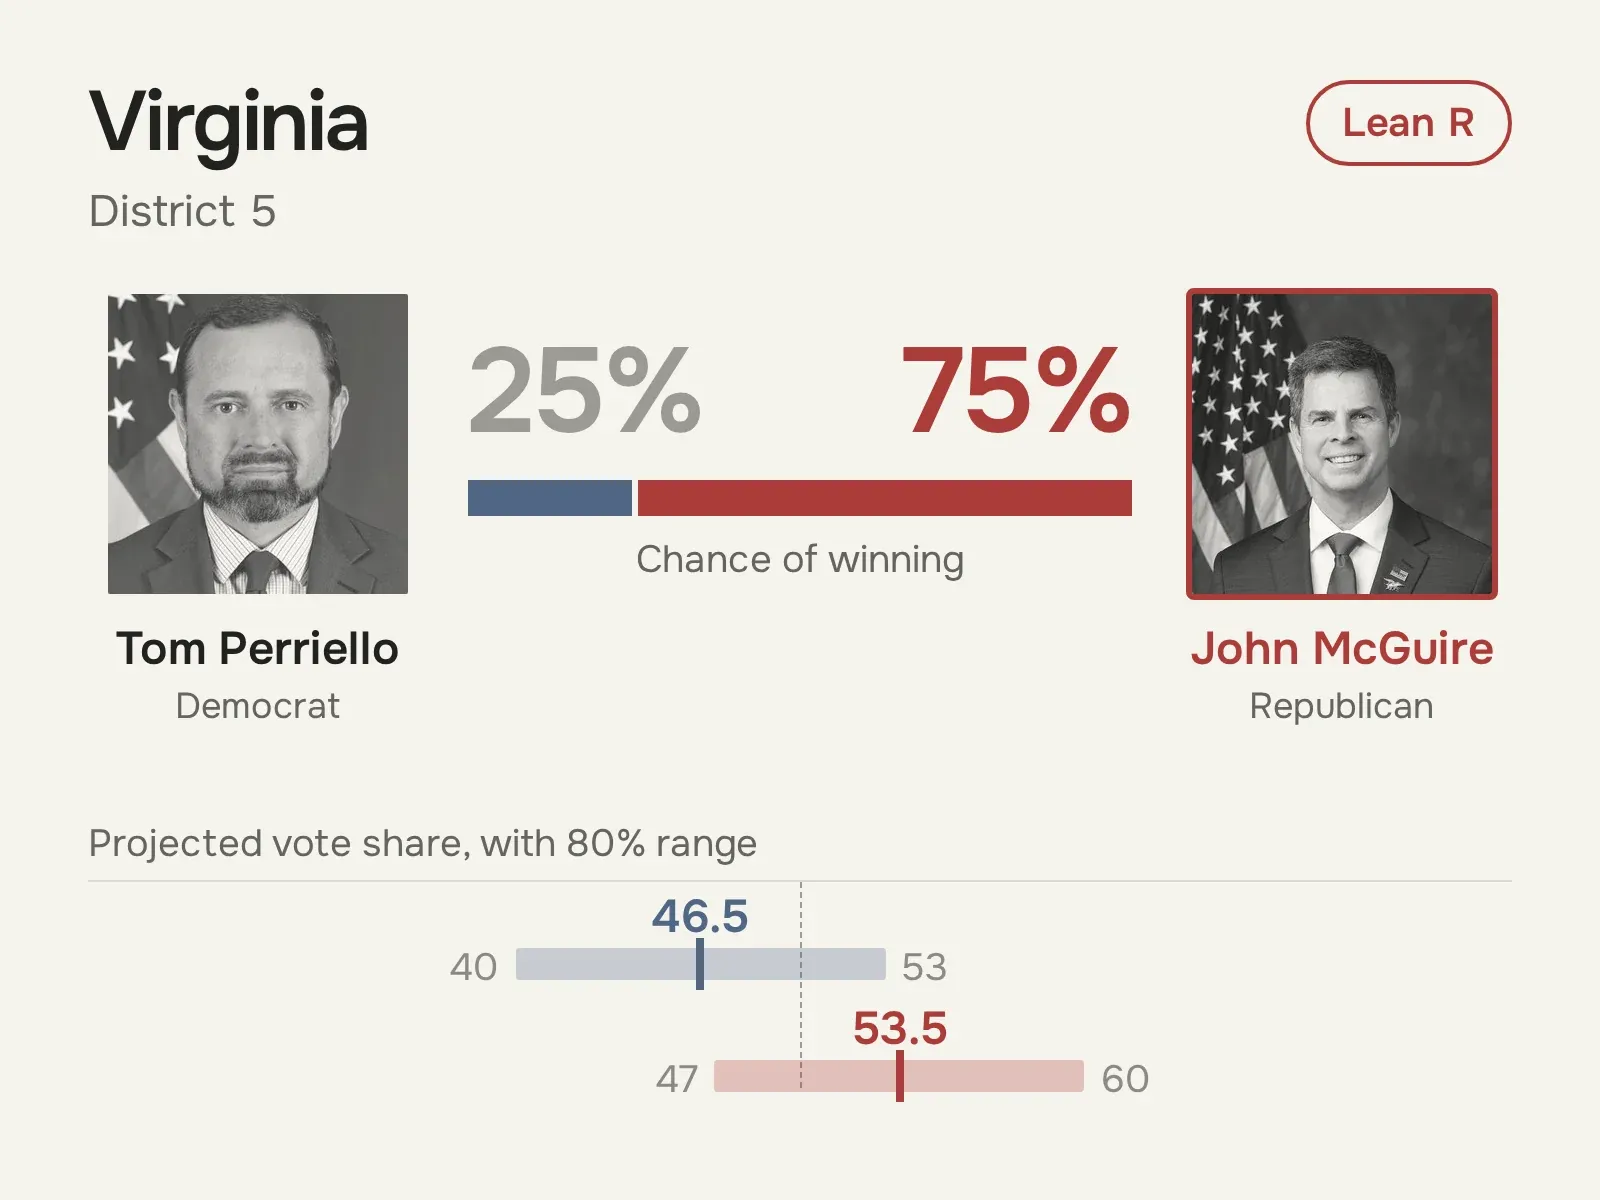 View full size ↗
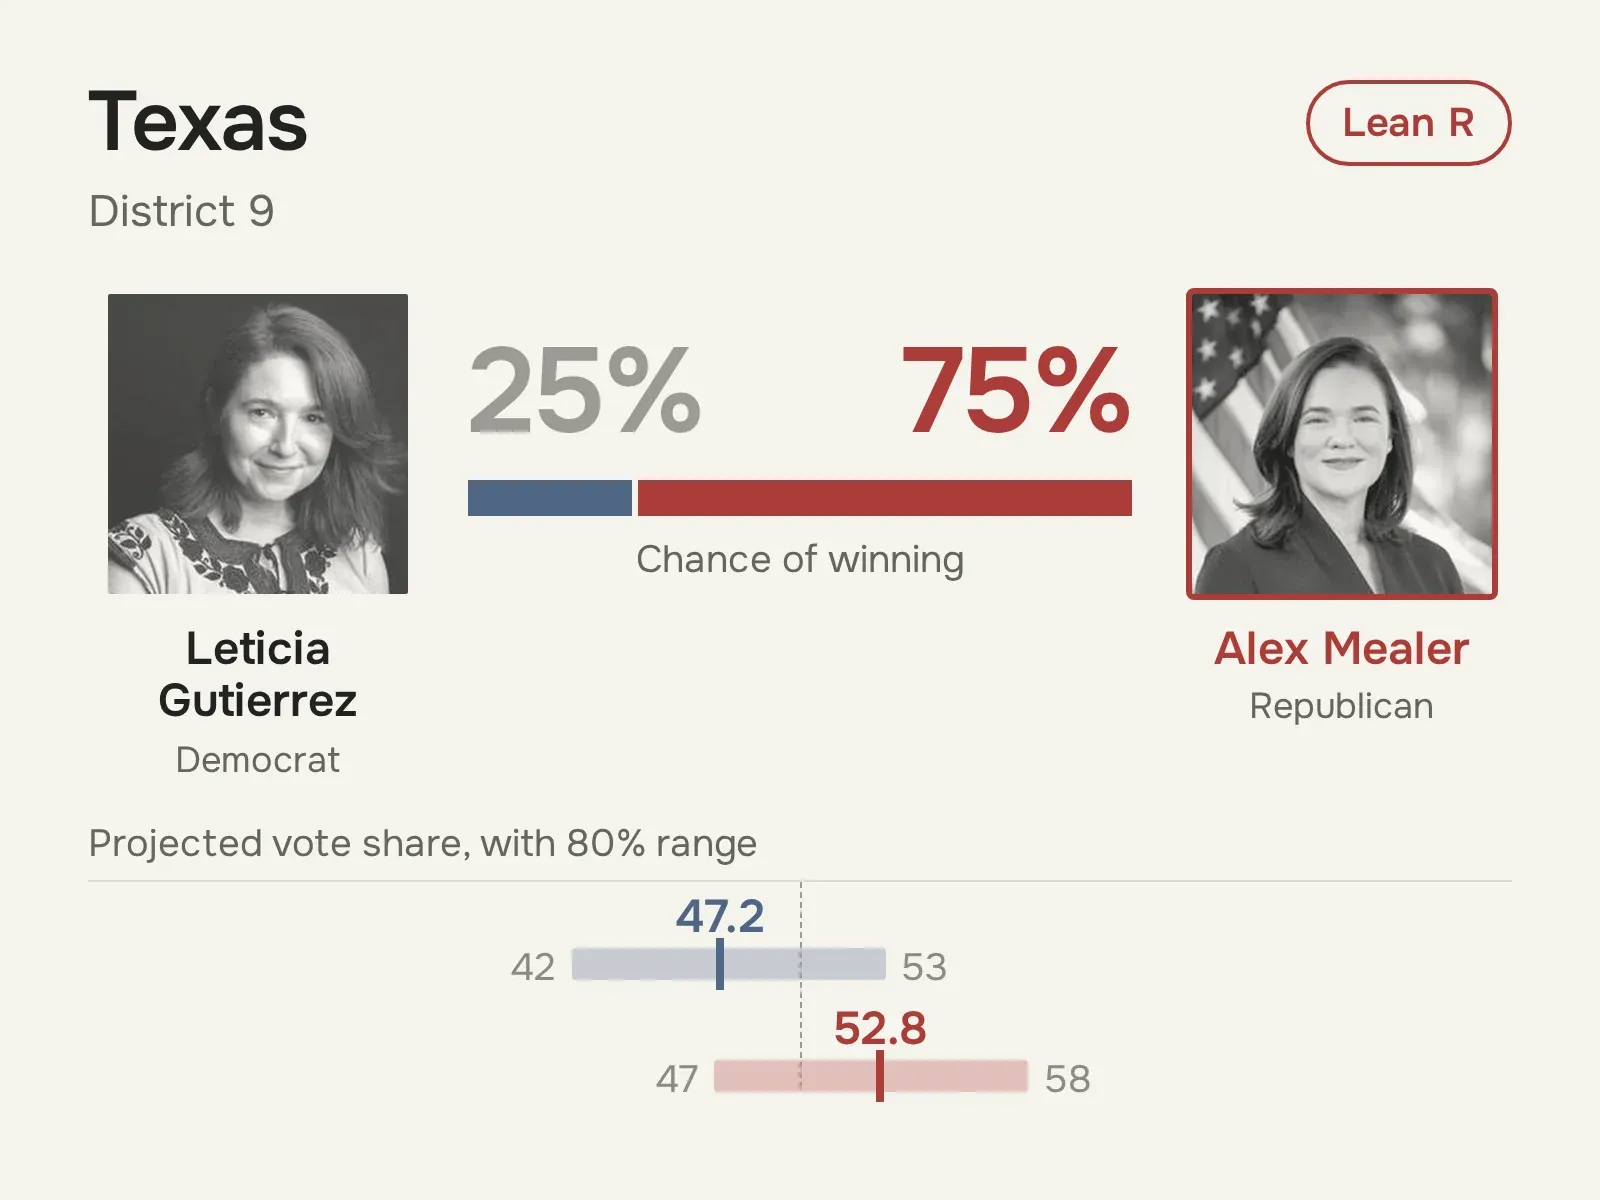 View full size ↗
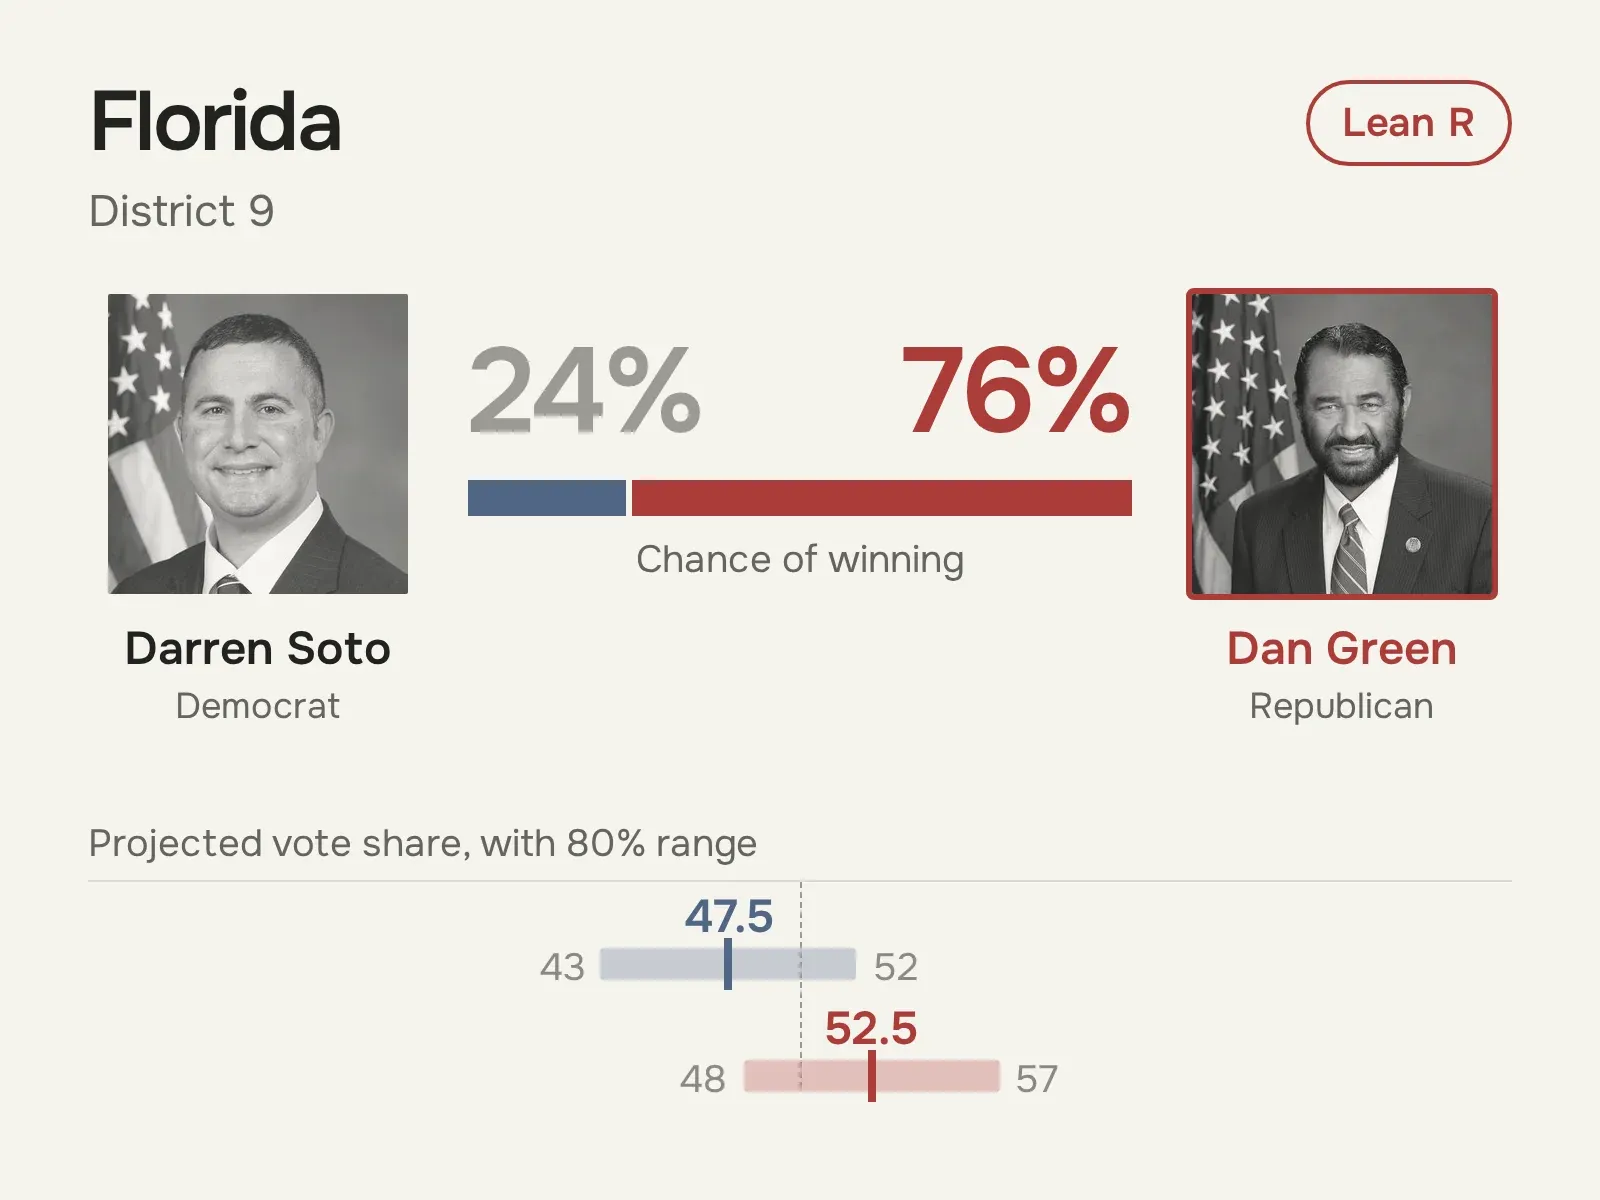 View full size ↗
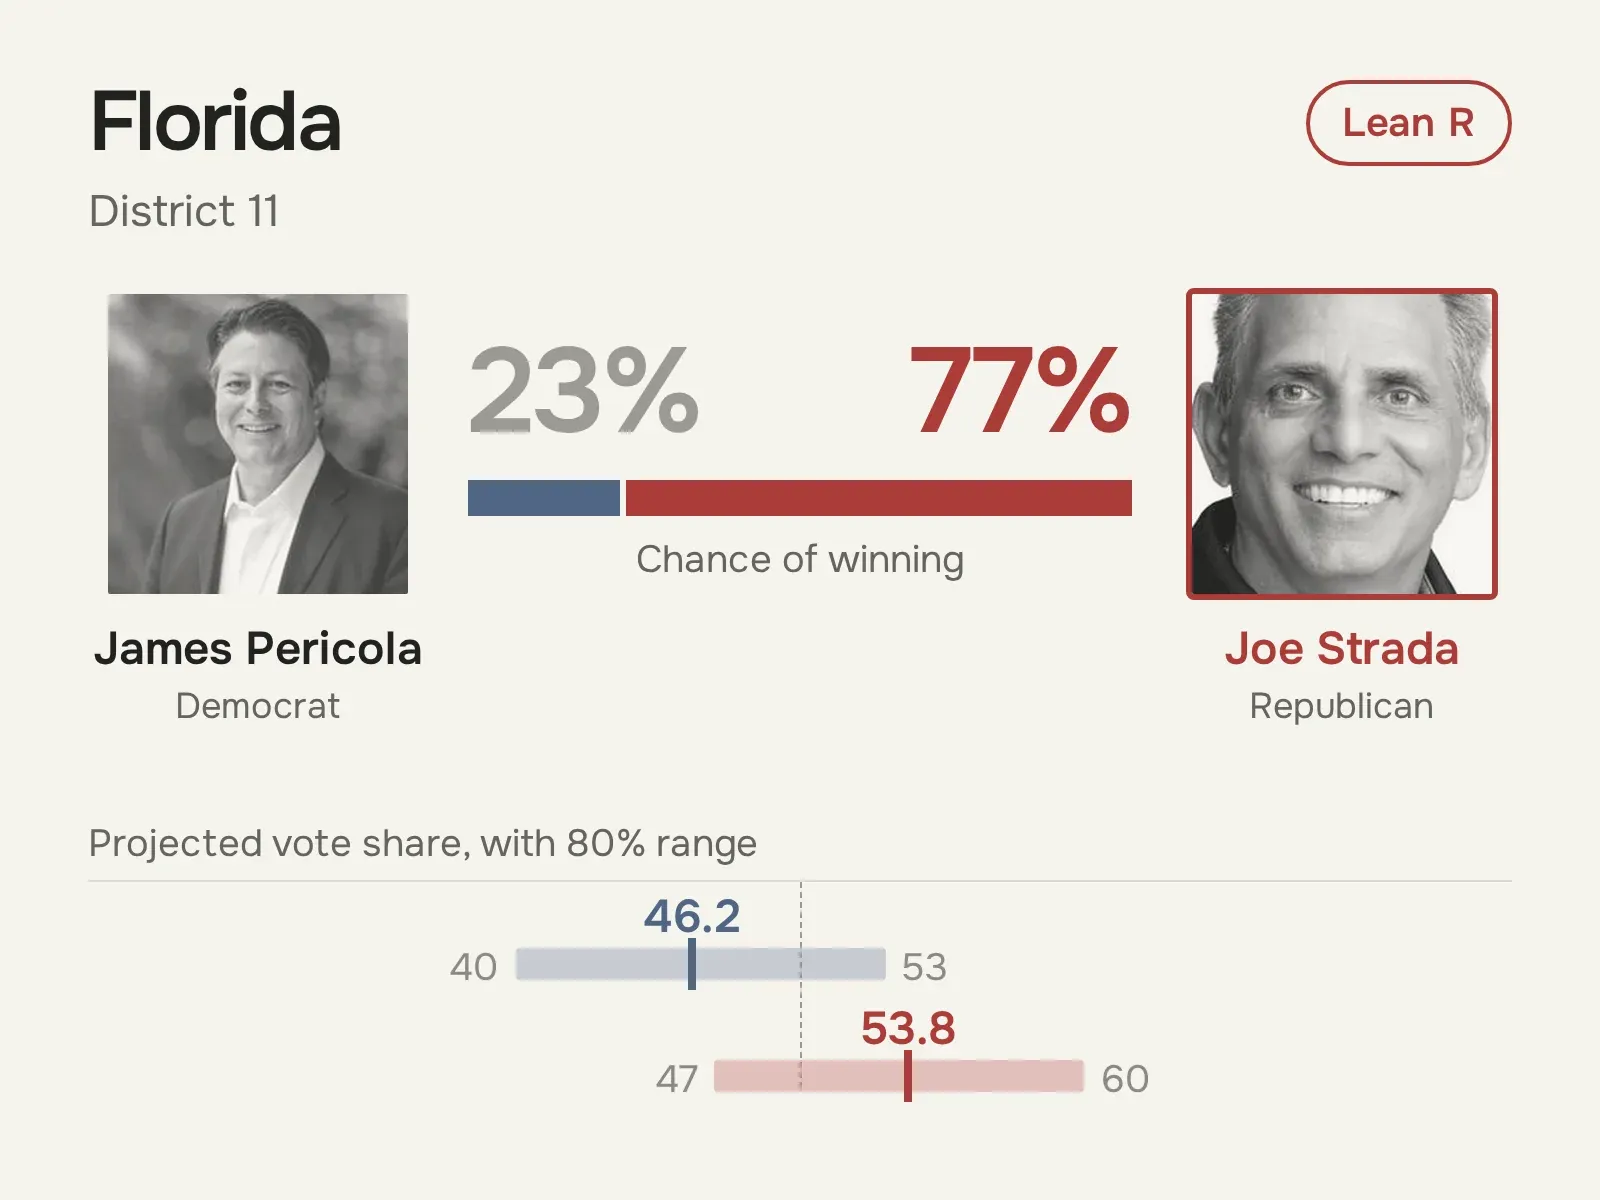 View full size ↗
 View full size ↗